ABM Dashboard 2026: Metrics, Tools & KPIs That Win
Most ABM dashboards track vanity metrics that hide real account momentum. Here's how to build one that actually predicts pipeline.
TL;DR#
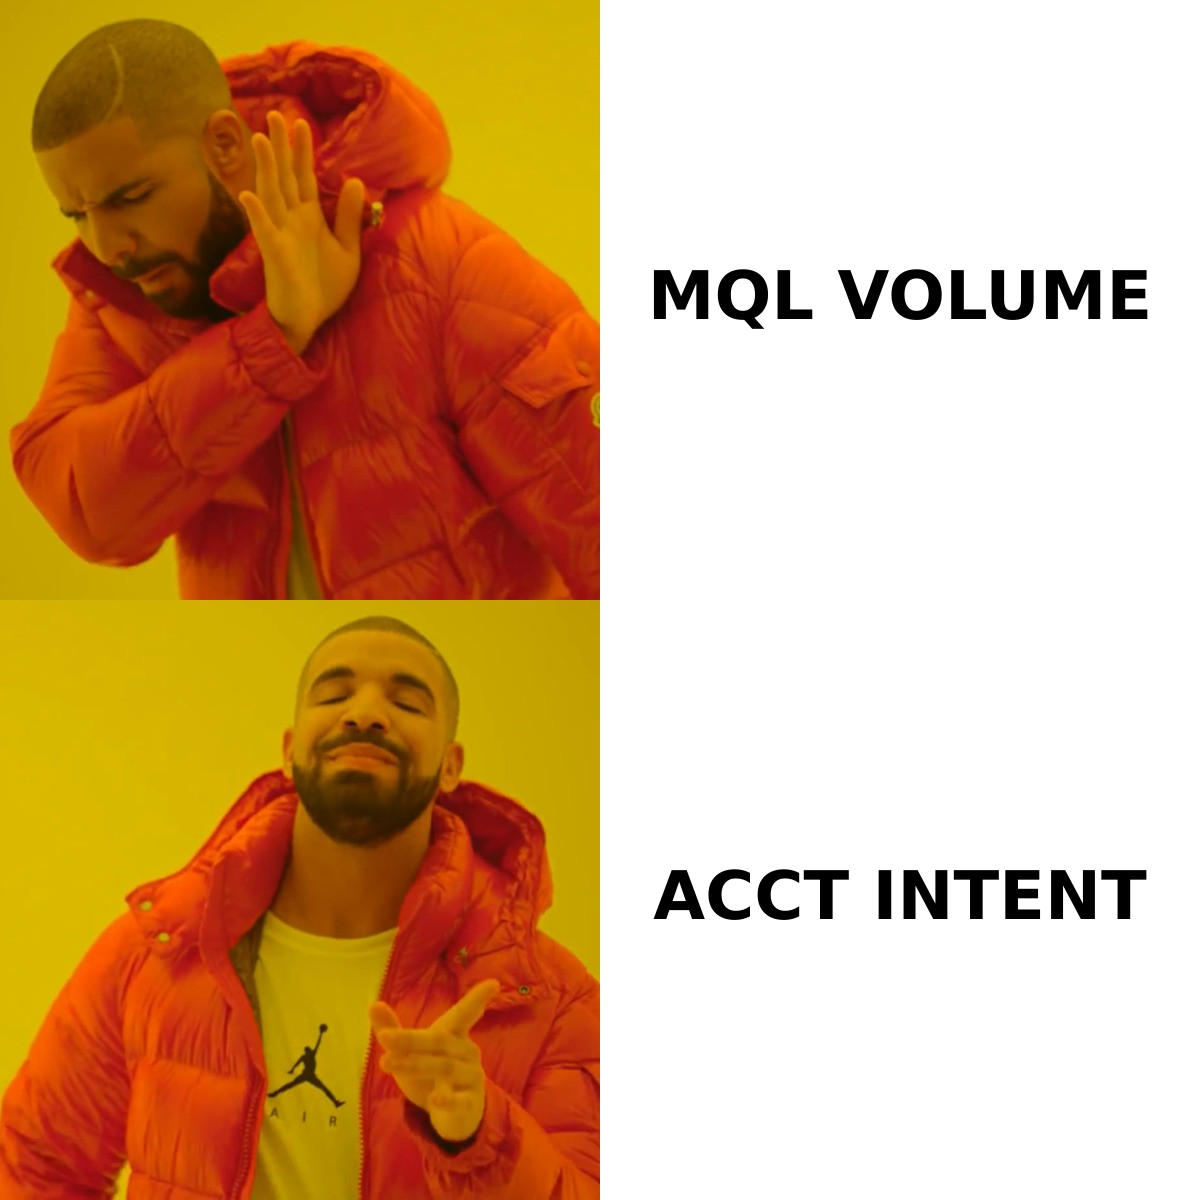
- An ABM dashboard is a single pane of glass that tracks account-level engagement, intent, pipeline velocity, and revenue across your target list — not lead volume.
- Most teams fail because they bolt MQL metrics onto an account model. The fix is replacing lead-count widgets with account-tier coverage, multi-threading depth, and intent acceleration.
- The four metric families that actually matter in 2026: Coverage, Awareness, Engagement, Reach + Revenue (sometimes shortened to "TEAM" by Demandbase).
- Best-fit tools depend on stack maturity: 6sense and Demandbase for enterprise, HubSpot ABM + RollWorks for mid-market, Clearbit + a BI layer for lean teams.
- Your contact data is the foundation. Tomba's email and phone enrichment fills the gaps before any dashboard can be trusted.
What is an ABM dashboard?#
An ABM dashboard is a reporting surface that aggregates account-level signals — firmographic fit, third-party intent, first-party engagement, opportunity stage, and closed revenue — for the named accounts your go-to-market team is pursuing.
Think of it like a flight control panel rather than a speedometer. A speedometer tells you how fast you're driving. A flight panel tells you altitude, heading, fuel, weather, and ETA at once because any one of those alone is meaningless. ABM works the same way: pageviews mean nothing without intent surge, intent surge means nothing without buying-committee coverage, and coverage means nothing without pipeline conversion.
Technically, it's a reporting layer that pulls from your CRM, marketing automation platform, intent provider (Bombora, G2, 6sense), ad platforms, and product analytics — then re-keys everything from lead_id to account_id.
Why do most ABM dashboards fail?#
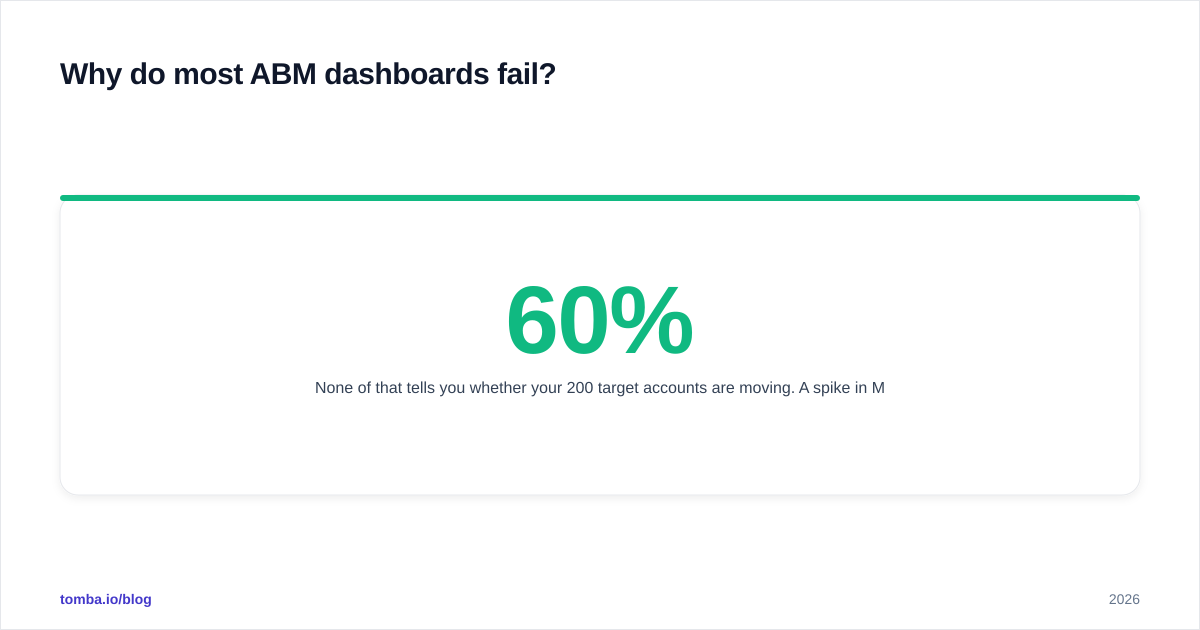
Most ABM dashboards fail because they were built by people who ran demand gen and never let go of MQL thinking. You see this pattern over and over:
- Top widget: "MQLs this month"
- Middle widget: "Email opens by campaign"
- Bottom widget: "Cost per lead"
None of that tells you whether your 200 target accounts are moving. A spike in MQLs from outside your ICP looks identical to a spike from inside it. A 60% open rate from junior contacts at low-fit companies looks healthier than a 12% open rate from the actual buying committee at a $50M target account — but the second one is what closes.
The fix is to rebuild the dashboard around the account as the unit of measurement, with leads rolled up underneath it.
What metrics should an ABM dashboard track?#
Borrowing loosely from Demandbase's TEAM framework (Target, Engage, Activate, Measure) and ITSMA's classic three-tier model, the metrics that matter cluster into four families.
1. Coverage metrics#
These answer: are we even talking to enough of the right people?
- Tier 1/2/3 account count vs target — did you actually load your named list?
- Contact coverage per account — how many decision-makers do you have for each account? Six is the modern benchmark for committee-buy software.
- Title coverage — economic buyer, champion, user, finance, security — present or missing?
- Data freshness — what % of contacts have a verified email in the last 90 days?
2. Awareness metrics#
Pre-engagement signals. Has the account noticed you exist?
- Reach % across the target list (impressions / list size)
- Branded search lift in target geos
- Direct visits from target-account IPs (via reverse IP — see website visitor reveal)
- Ad frequency by account tier
3. Engagement metrics#
The middle of the funnel — what most dashboards miss.
- Engagement minutes (not pageviews) per account, per week
- Multi-threading depth — number of distinct contacts engaged in the last 30 days
- Buying-stage intent from Bombora/G2/6sense — surge vs baseline
- Sales activity coverage — % of accounts touched by an SDR or AE this quarter
4. Revenue metrics#
The outcome layer.
- Pipeline created from target accounts ($)
- Win rate, target accounts vs control
- Average deal size, target vs non-target
- Sales cycle length
- Net revenue retention from existing ABM accounts
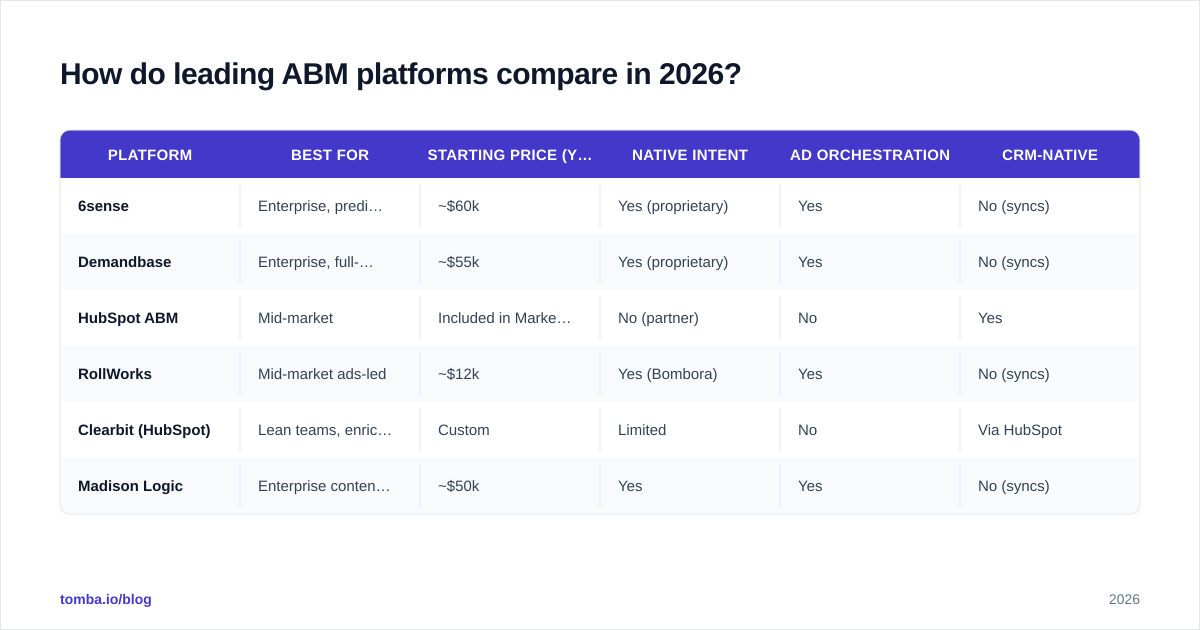
How do leading ABM platforms compare in 2026?#
If you're picking a platform — or auditing your current one — these are the realistic options. Pricing reflects publicly available info plus typical 2026 quotes; check vendor sites for current numbers.
| Platform | Best for | Starting price (yr) | Native intent | Ad orchestration | CRM-native |
|---|---|---|---|---|---|
| 6sense | Enterprise, predictive | ~$60k | Yes (proprietary) | Yes | No (syncs) |
| Demandbase | Enterprise, full-stack | ~$55k | Yes (proprietary) | Yes | No (syncs) |
| HubSpot ABM | Mid-market | Included in Marketing Hub Pro+ | No (partner) | No | Yes |
| RollWorks | Mid-market ads-led | ~$12k | Yes (Bombora) | Yes | No (syncs) |
| Clearbit (HubSpot) | Lean teams, enrichment-first | Custom | Limited | No | Via HubSpot |
| Madison Logic | Enterprise content syndication | ~$50k | Yes | Yes | No (syncs) |
For evaluating each of these honestly, G2's ABM category is a less-biased starting point than vendor websites. You'll also see useful comparison data on Gartner Peer Insights.
If 6sense or Demandbase pricing is out of reach, a 6sense alternative or Demandbase alternative built from intent data plus your CRM can cover 70% of the use case at a fraction of the cost.
How should the dashboard be structured?#
Three views, each answering a different question.
View 1: Executive (weekly)#
Built for the CRO and CMO. Numbers, no detail.
- Pipeline from target accounts (this period vs last)
- Win rate lift over control group
- Account tier movement (how many Tier 3 → Tier 2 → Tier 1 this period)
- Net new logos from ABM motion
View 2: Marketing Ops (daily)#
Built for the team running the program.
- Spend pacing per tier
- Reach % per tier
- Engagement minutes trend
- Intent surge alerts (which accounts spiked above baseline today)
- Data hygiene — % of accounts missing critical contacts
View 3: Sales (real-time)#
Built for AEs and SDRs. This is the one that actually drives revenue.
- My accounts ranked by engagement score
- Newly engaged contacts (last 7 days)
- Intent topics surging at my accounts
- Recommended next action per account
- Buying group gaps (which roles are missing)
What data feeds do you need?#
A dashboard is only as good as the pipes feeding it. At minimum:
- CRM (Salesforce, HubSpot, Pipedrive) — accounts, opportunities, contacts
- MAP (Marketo, HubSpot, Pardot) — email engagement, form fills, scoring
- Intent provider — Bombora, G2 Buyer Intent, TrustRadius, or built-in (6sense/Demandbase)
- Ad platforms — LinkedIn Campaign Manager, Google Ads, RollWorks
- Product analytics — Mixpanel, Amplitude, Heap (for product-led ABM)
- Enrichment + contact data — Tomba, Clearbit,
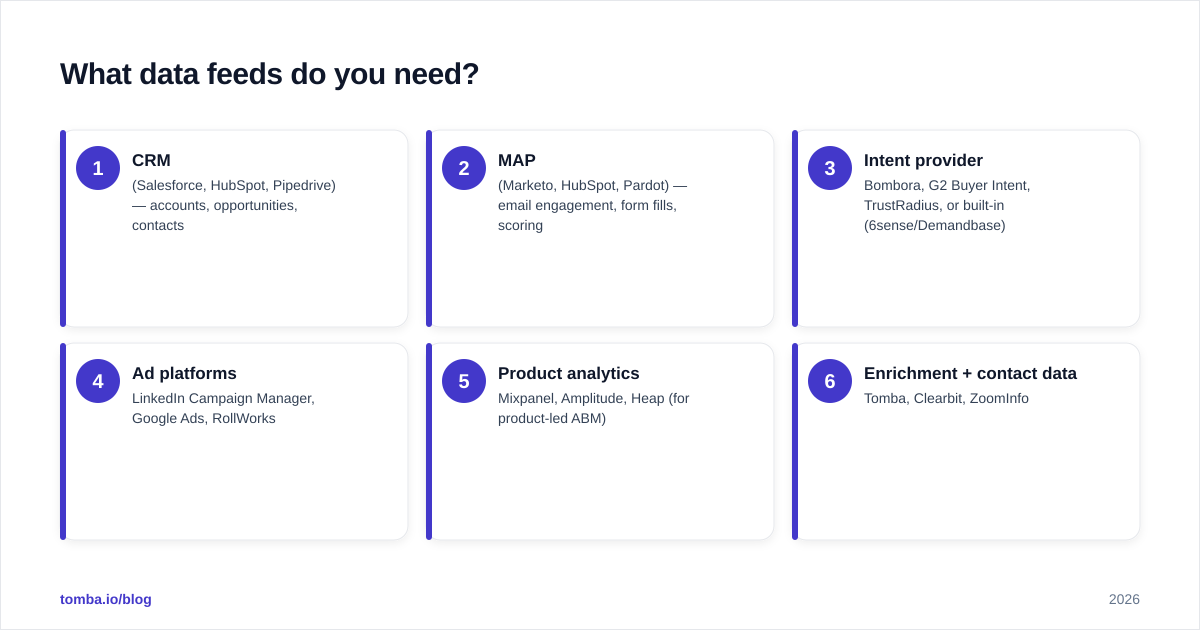
ZoomInfo
The enrichment layer is the foundation everything else sits on. If your CRM has 200 target accounts and 400 contacts, you're under-threaded. Closing big deals in 2026 takes 6–10 stakeholders per buying committee — Forrester's data backs this up — so plan for ~1,200–2,000 contacts behind those 200 accounts.
That's where a high-accuracy email finder plus B2B phone numbers keeps your account records actually contactable instead of just listed. And before you push contacts into outreach, run them through an email verifier to keep sender reputation intact.
How do you measure ABM dashboard ROI?#
A dashboard itself doesn't produce ROI — but the decisions it enables do. Track:
| Question | Metric to watch |
|---|---|
| Are we picking the right accounts? | Win rate of target accounts vs non-target |
| Are we reaching them? | Reach % per tier, frequency caps holding |
| Are we engaging the right people? | Multi-threading depth, title coverage |
| Are we converting engagement to pipeline? | Engaged-account-to-opportunity rate |
| Are we closing faster? | Sales cycle length, ABM cohort vs control |
| Are we expanding? | NRR on ABM-acquired customers |
A reasonable benchmark from real programs: target accounts should show a 30–50% higher win rate and 20–40% larger deal size than your non-ABM baseline within 12 months. If they don't, your dashboard is showing you something — listen.
How do you build it without a $60k platform?#
Plenty of teams ship a working ABM dashboard on a fraction of the budget. The stack:
- CRM as source of truth — accounts, opps, contacts (Salesforce or HubSpot)
- Bombora Surge or G2 Buyer Intent — third-party intent ($10–20k/yr)
- Tomba for data enrichment and contact coverage
- LinkedIn Matched Audiences — account-targeted ads
- Looker, Metabase, or Hex — the actual dashboard layer
- Reverse Etl (Hightouch, Census) — push intent + engagement back into CRM
Total cost: a tenth of a 6sense seat, with a 4–6 week build. The trade-off is you maintain the model yourself — but you also understand it, which is more than most 6sense customers can say about their own black-box scores.
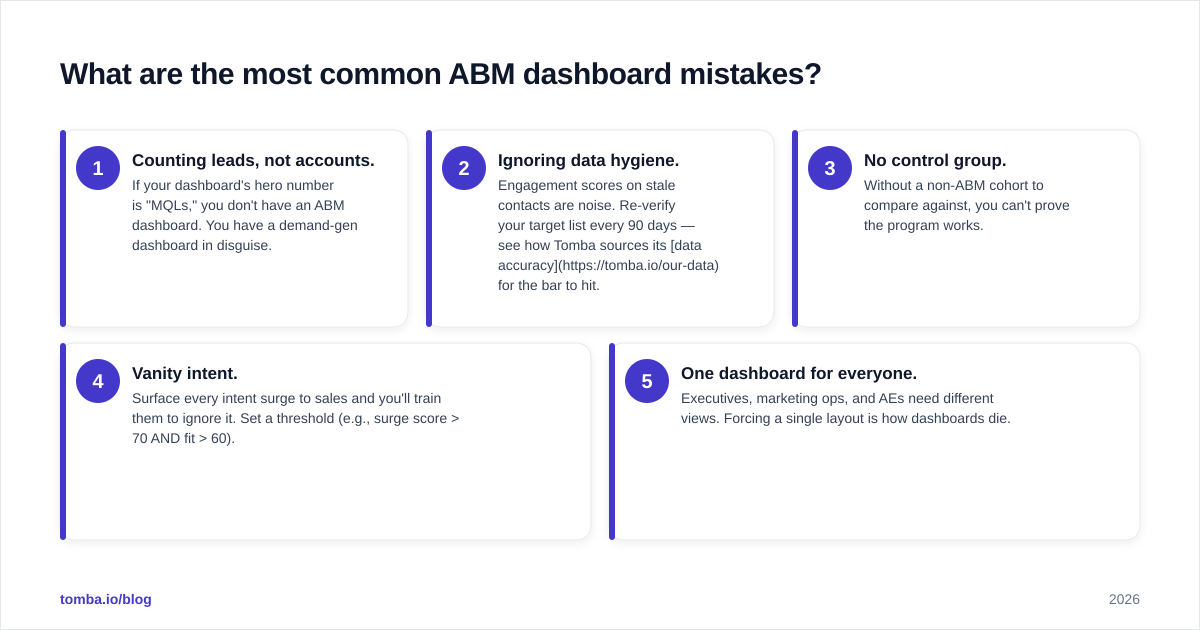
What are the most common ABM dashboard mistakes?#
After auditing dozens of programs, the same five mistakes keep appearing:
- Counting leads, not accounts. If your dashboard's hero number is "MQLs," you don't have an ABM dashboard. You have a demand-gen dashboard in disguise.
- Ignoring data hygiene. Engagement scores on stale contacts are noise. Re-verify your target list every 90 days — see how Tomba sources its data accuracy for the bar to hit.
- No control group. Without a non-ABM cohort to compare against, you can't prove the program works.
- Vanity intent. Surface every intent surge to sales and you'll train them to ignore it. Set a threshold (e.g., surge score > 70 AND fit > 60).
- One dashboard for everyone. Executives, marketing ops, and AEs need different views. Forcing a single layout is how dashboards die.
Frequently asked questions#
How often should I refresh an ABM dashboard? Sales view: real-time or hourly. Ops view: daily. Executive view: weekly. Refreshing the exec view in real time creates anxiety, not insight.
Is an ABM dashboard the same as a marketing dashboard? No. Marketing dashboards roll up by campaign or channel. ABM dashboards roll up by account, with campaigns nested underneath.
What's the minimum account count for ABM to make sense? Around 50 named accounts for a 1-to-few motion, or 25 for true 1-to-1. Below that, account-level tooling is overhead.
Where does product-led growth fit? Product-qualified accounts (PQAs) are an engagement signal. Feed product analytics into the same dashboard as intent and ads.
Closing thought#
An ABM dashboard isn't a reporting exercise — it's how revenue teams decide where to spend the next hour. Build it around accounts, fed by clean contact data, and make sure each view answers a question someone actually asks on Monday morning.
Before any of that works, your account records need real, verified buying-committee contacts. Start with Tomba Email Finder — find decision-maker emails by domain, verify them in the same call, and push them into your CRM so your ABM dashboard reports on accounts you can actually reach.
Get the Tomba newsletter
Practical outbound tactics and product updates — once every two weeks.
About the author