ABM Report 2026: What to Track, Show, and Skip
Most ABM reports drown executives in vanity metrics. Here is the 2026 template that proves account-based marketing actually moves revenue.
ABM Report 2026: What to Track, Show, and Skip
TL;DR
- A useful ABM report answers three questions: are we reaching the right accounts, are they engaging, and is that engagement turning into pipeline and revenue?
- Drop MQLs. Account-based marketing fails the moment you grade individual leads instead of buying groups.
- The five metrics that matter in 2026: account coverage, account engagement score, pipeline velocity per tier, win rate by program, and influenced revenue.
- Reports break when the CRM, intent data, ad platform, and outreach tool live in separate spreadsheets. Centralize on one account record.
- Executives want a one-page summary. Operators want the dashboard underneath. Build both, not one or the other.
What is an ABM report, really?#
An ABM report is the dashboard that proves your account-based program is producing pipeline, deals, and revenue from the specific accounts you targeted, not from random inbound noise.
That definition matters because most "ABM reports" are just renamed demand-gen reports. They count leads, MQLs, form fills, and email opens, then sprinkle the word "account" on top. That breaks the second a CFO asks the only question that counts: did the accounts we picked at the start of the quarter actually buy more than the accounts we ignored?
A real account-based report tracks accounts as the unit of analysis. Every metric rolls up to an account ID, not a lead ID. Every program (display, direct mail, BDR sequences, field events) gets attributed back to the same account list. And the report compares targeted vs untargeted control groups so the lift is provable, not just plausible.
Why do most ABM reports fail to convince executives?#
Three reasons keep showing up when CMOs lose ABM budget reviews.
They report activity, not outcomes. "We sent 4,200 emails to target accounts" is not a result. It is a step. The board wants to see closed-won revenue from the target list versus a control group, not a vanity count of touches.
They mix leads and accounts. A buying committee in a 5,000-person company has 8 to 14 stakeholders. If your report tells the CRO "we generated 312 MQLs," nobody knows whether that is 312 different companies or 12 companies with very enthusiastic interns. The MQL is the wrong unit.
They cannot prove incrementality. Without a holdout or matched-control segment, you cannot tell whether ABM produced pipeline or whether those accounts were going to buy anyway. Most reports skip this and hope the audience does too.
What metrics belong in a 2026 ABM report?#
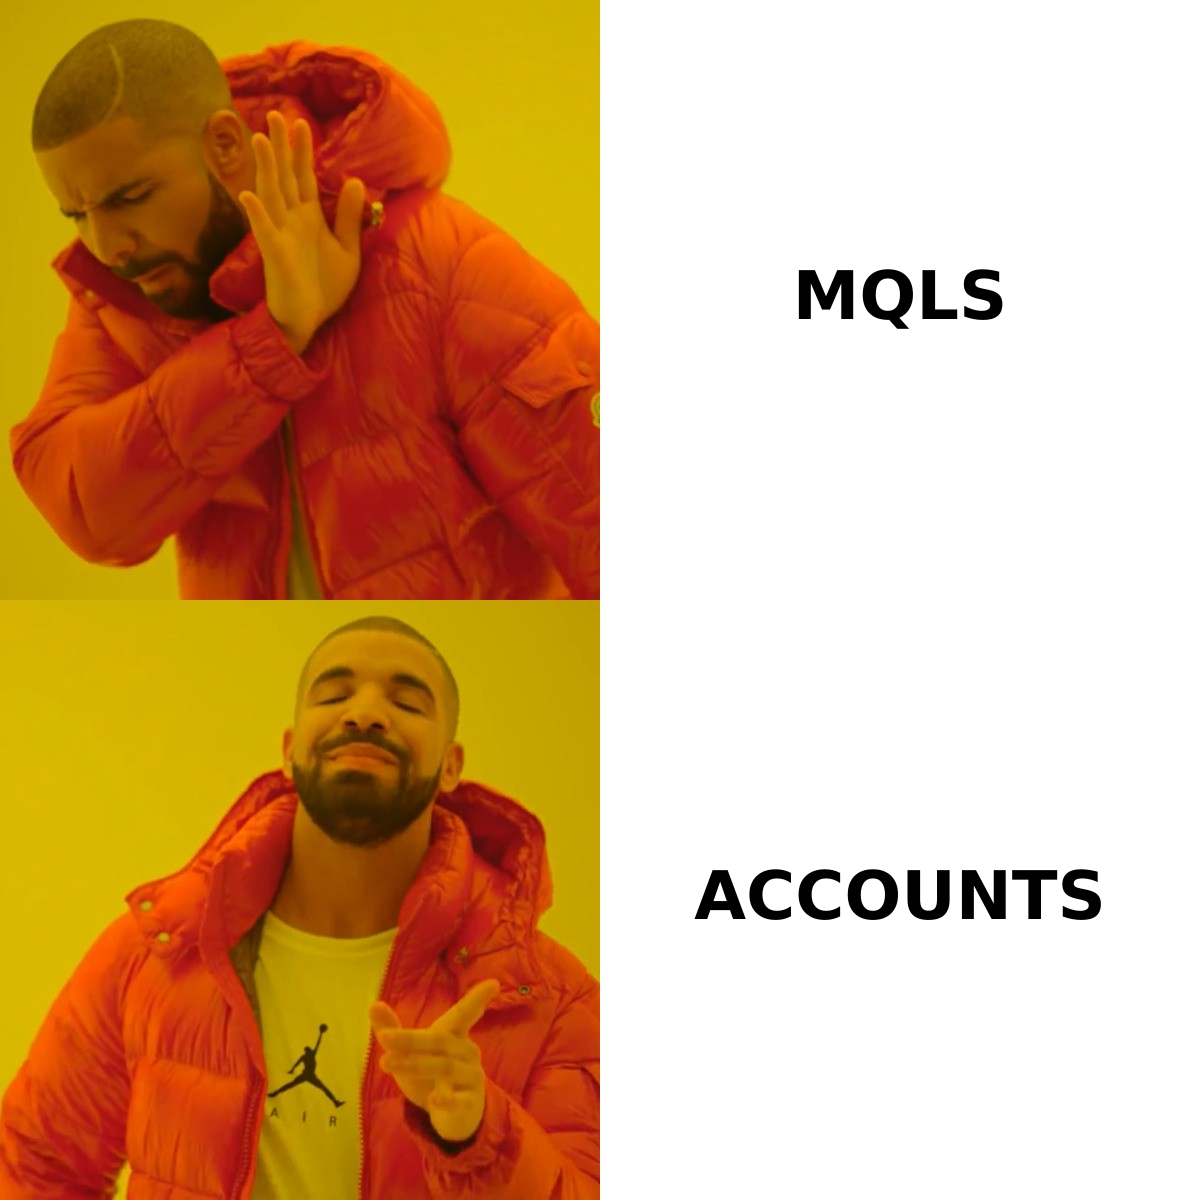
There is no single right list, but the table below shows the metrics that actually predict revenue versus the ones that mostly comfort the marketing team.
| Metric | Unit | Why it matters | Common mistake |
|---|---|---|---|
| Account coverage | % of target accounts with any engagement | Tells you if your reach is working at all | Counting one cookie hit as "covered" |
| Account engagement score | Composite 0-100 per account | Predicts when an account is ready for a BDR play | Hiding the formula from the rep |
| Buying group identified | # contacts per account | Proves you are selling to a committee, not a champion | Stopping at one decision-maker |
| Pipeline created per tier | $ by account tier | Shows where to spend next quarter | Lumping Tier 1 and Tier 3 together |
| Pipeline velocity | Days from first touch to opportunity | Catches stalled programs early | Tracking only deals that closed |
| Win rate (target vs control) | % | The only metric that proves incrementality | No control group |
| Influenced revenue | $ closed-won touched by ABM | Justifies the program to finance | Claiming influence with zero engagement |
| Cost per opportunity | $ | Lets you compare ABM to other channels honestly | Excluding internal time |
The engagement score deserves its own moment. It should weight high-intent signals (demo requests, pricing page visits, multiple stakeholders engaging in the same week) far more than low-intent signals (single open, single ad impression). When two reps look at the same account, they should agree on the score, not argue about it.
How should the report be structured?#
Build three layers. Each layer answers a different audience's question.
Layer 1 — Executive summary (one page). Pipeline created, pipeline closed, win rate vs control, cost per opportunity, and one chart of the trend over the last four quarters. Nothing else. If the CFO has to scroll, you have already lost.
Layer 2 — Program performance. Break performance down by play: 1:1 ABM (named accounts, custom plays), 1:few ABM (industry pods, 20-50 accounts), and 1:many ABM (broader tier 3 with personalized ads). Each should show coverage, engagement, pipeline, and ROI. This is the layer your VP of Marketing reads on Monday.
Layer 3 — Account-by-account detail. A sortable table of every target account: tier, owner, engagement score, last activity, identified buying group size, current stage, and dollar value if there is an open deal. This is the operator's tool. BDRs and AEs live here.
Which tools actually feed the ABM report?#
The reporting stack matters because a beautiful dashboard with stale data is worse than no dashboard. Here is the honest comparison of the main categories.
| Tool category | Examples | What it contributes | Limitation |
|---|---|---|---|
| ABM platform | 6sense, Demandbase, RollWorks | Intent signals, ad delivery, account scoring | Pricey; intent quality varies by industry |
| CRM | Salesforce, HubSpot | Source of truth for pipeline and revenue | Account/contact data hygiene is on you |
| Data + email finder | Tomba, Apollo,ZoomInfo | Builds the buying group, fills missing contacts | Coverage gaps in long-tail SMB |
| Sales engagement | Outreach, Salesloft, Instantly | Tracks BDR touches at the contact level | Often siloed from ABM platform |
| Web analytics | GA4, Mutiny, RB2B | Anonymous visitor de-anonymization | Cookie deprecation is a real problem |
| BI / dashboards | Looker, Tableau, Hex | Stitches everything into one report | Only as good as the upstream data model |
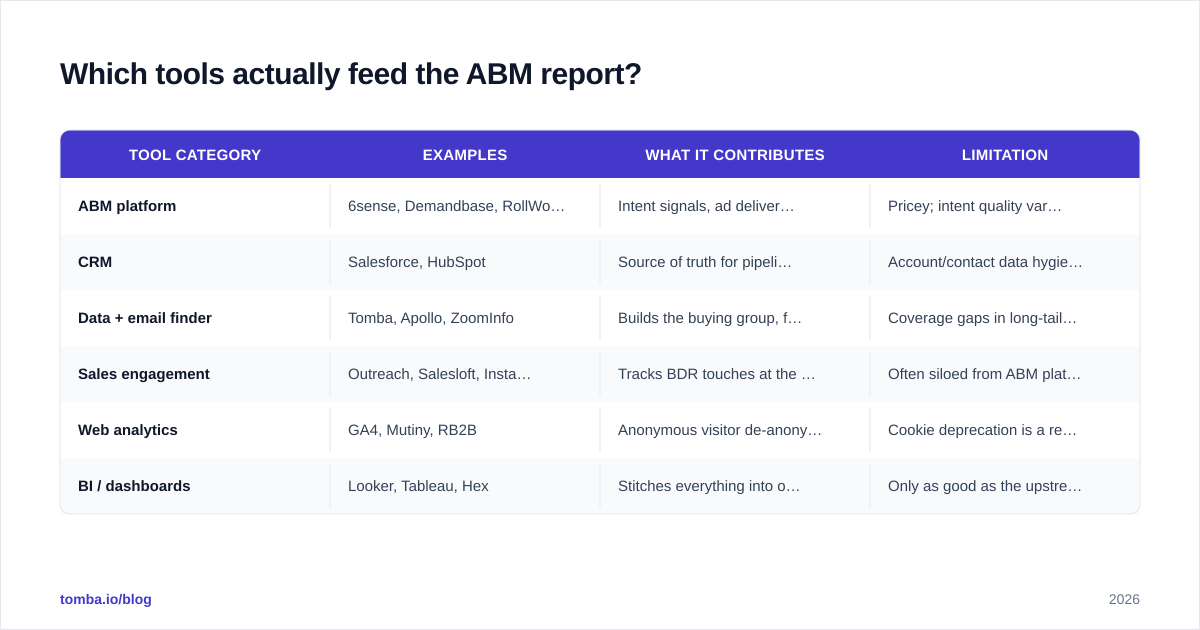
For the buying-group step specifically, a focused email finder plus a domain search workflow is usually the cheapest way to go from "we know the account is engaged" to "here are the 12 people on the committee with verified emails and titles." Without that step, your engagement score is measuring one cookie, not a real buying motion.
How do you build the report when you only have a CRM?#
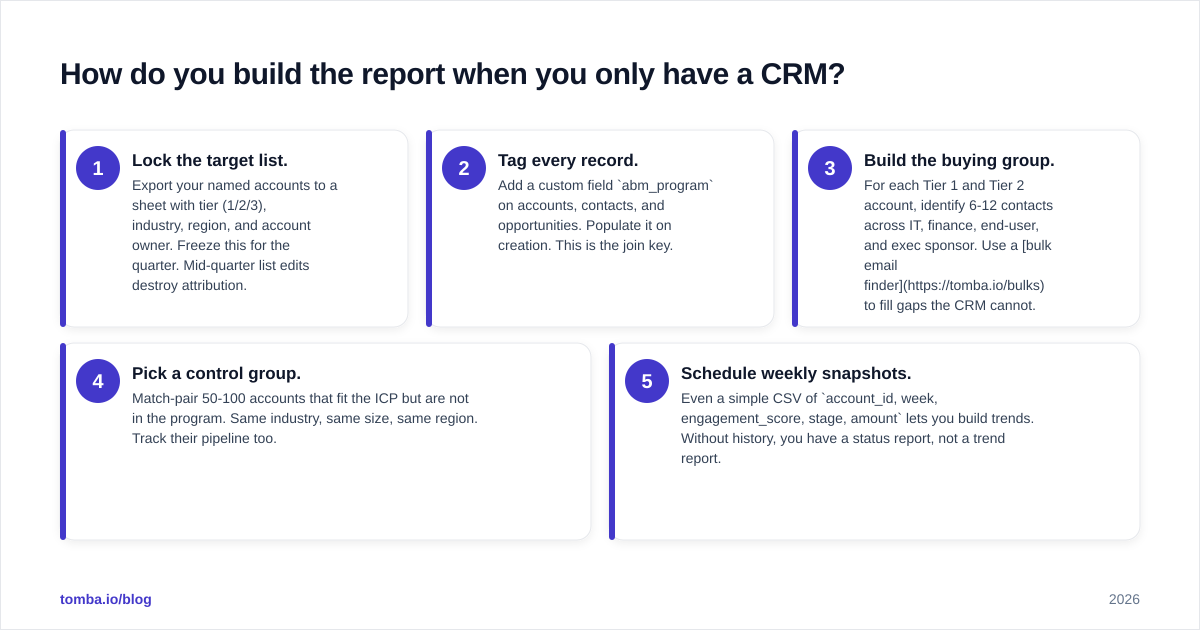
You do not need a full ABM platform on day one. A scrappy version of the report works on Salesforce or HubSpot plus a spreadsheet.
- Lock the target list. Export your named accounts to a sheet with tier (1/2/3), industry, region, and account owner. Freeze this for the quarter. Mid-quarter list edits destroy attribution.
- Tag every record. Add a custom field
abm_programon accounts, contacts, and opportunities. Populate it on creation. This is the join key. - Build the buying group. For each Tier 1 and Tier 2 account, identify 6-12 contacts across IT, finance, end-user, and exec sponsor. Use a bulk email finder to fill gaps the CRM cannot.
- Pick a control group. Match-pair 50-100 accounts that fit the ICP but are not in the program. Same industry, same size, same region. Track their pipeline too.
- Schedule weekly snapshots. Even a simple CSV of
account_id, week, engagement_score, stage, amountlets you build trends. Without history, you have a status report, not a trend report.
This is unglamorous but it works. Most teams that "need a platform" actually need clean account tagging.
What should you stop reporting?#
Cutting metrics is harder than adding them. These are the ones that mostly mislead.
- Raw email opens. Apple Mail Privacy Protection inflates this number by 30-60%. Treat opens as directional at best.
- Cost per MQL. If MQLs are not the unit, CPMQL is noise. Track cost per qualified account or cost per opportunity instead.
- Page views per target account, isolated. One curious intern at SAP can produce 80 page views. Use engagement score, which weights by buying-stage signal.
- Influenced pipeline with a 365-day attribution window. That number is too generous to mean anything. Use 90 days for influence and require at least one meaningful touch (demo, content download, two unique stakeholders engaged).
When you stop reporting these, the report shrinks. That is the point. A shorter, sharper report gets read.
How do you connect ABM reporting to sales execution?#
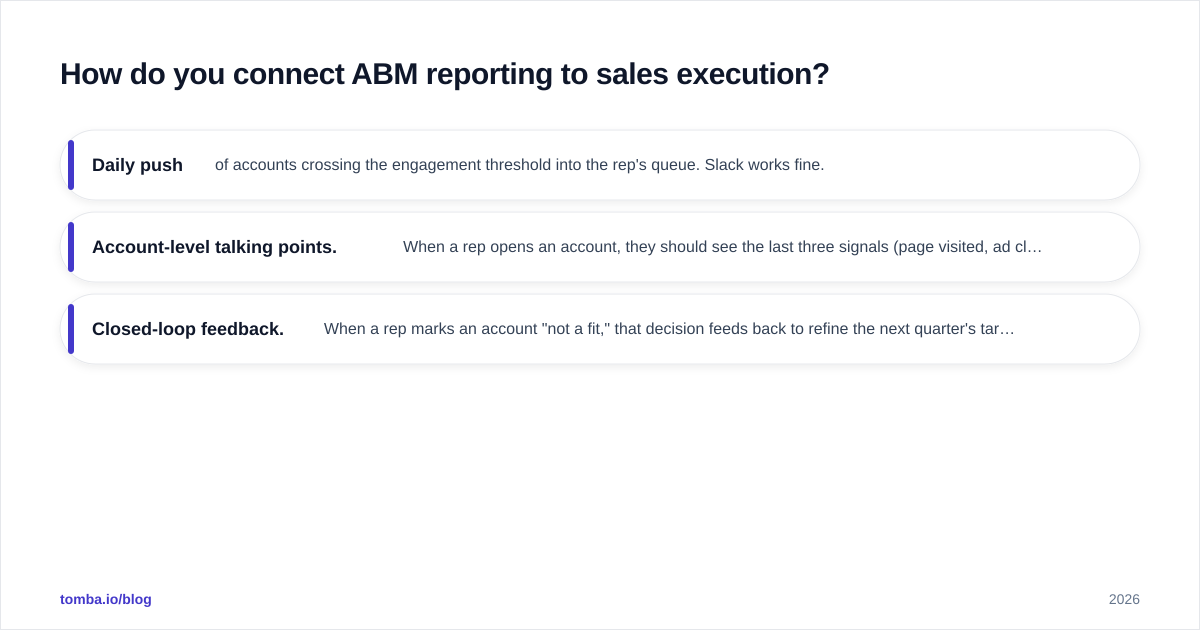
A report that sits in Looker but never reaches a rep is a budget item, not a tool. Wire the report into the BDR and AE workflow.
- Daily push of accounts crossing the engagement threshold into the rep's queue. Slack works fine.
- Account-level talking points. When a rep opens an account, they should see the last three signals (page visited, ad clicked, content downloaded) and the identified buying group with verified contact info pulled from a data enrichment step.
- Closed-loop feedback. When a rep marks an account "not a fit," that decision feeds back to refine the next quarter's target list. ABM that does not learn becomes spam.
This is where reporting stops being a marketing exercise and starts being a RevOps function. Ownership matters: someone has to maintain the dashboard the same way a sales ops manager maintains the forecast.
How do industry leaders structure their ABM reporting?#
Look at how Gartner frames the buying journey or how vendors like Demandbase and 6sense publish their reference dashboards. They all converge on the same shape: account coverage at the top of the funnel, engagement in the middle, and pipeline plus revenue at the bottom, with control-group lift expressed as a percentage difference. If your report does not fit on that skeleton, it is either too cluttered or missing a layer.
Two practical tips from teams running mature programs:
- Report cadence beats report depth. A 30-minute weekly review with the CRO is worth more than a quarterly 40-page deck nobody reads.
- One number per audience. Board: pipeline. CRO: win rate vs control. CMO: engaged accounts. CDO: data coverage. Picking the one number forces honesty.
Build your buying group before you build the dashboard#
Most ABM reports look bad because the data underneath is bad. The single most common failure: you can see that Acme Corp is engaged, but you have one contact in the CRM, and that contact left in 2024.
Fix the data first. Use Tomba's email finder to identify and verify the full buying group on every Tier 1 and Tier 2 account in your program. Pair it with a bulk lookup for refresh sweeps each quarter so the buying group does not rot. With clean, verified contacts feeding into the report, your engagement scores reflect real committee activity, your BDRs talk to real people, and your ABM report finally has a denominator the CFO will accept.
Start free with 25 searches a month, and scale to Tomba's Starter plan at $49/mo when the program proves itself. The report only works when the data does.
Ready to find emails that actually work?
Join 150,000+ professionals who stopped guessing and started sending. Free credits on signup — no credit card required.
Get the Tomba newsletter
Practical outbound tactics and product updates — once every two weeks.
About the author