ABM Reporting in 2026: The Metrics That Actually Prove Pipeline
Most ABM dashboards report vanity metrics that never tie to revenue. Here's the 2026 reporting stack — account engagement, pipeline velocity, and influenced revenue — that actually convinces your CFO.
ABM Reporting in 2026: The Metrics That Actually Prove Pipeline
TL;DR
- ABM reporting is broken at most companies because teams still measure leads, opens, and MQLs — none of which map to how buying committees actually behave.
- The 2026 reporting stack is built on four pillars: account coverage, account engagement, pipeline velocity, and influenced revenue.
- Multi-touch attribution alone is not enough — pair it with a holdout group and a CFO-readable dashboard or your budget gets cut.
- The platforms (6sense, Demandbase, HubSpot, Salesforce) all give you the raw signals, but the model and the metric definitions are yours to own.
- Start with five reports, not fifty. Fewer dashboards, deeper accountability.
You launched ABM. You bought the platform. You picked the 250 accounts. Now your CFO is asking what you got for the spend and your dashboard shows "engagement minutes" climbing while pipeline is flat. That's the problem this post solves.
ABM reporting is not "marketing reporting with accounts instead of leads." It's a different operating model — and if your dashboards still center on lead volume, MQL conversion, or email open rate, you are reporting on the wrong unit of analysis.
What is ABM reporting and why is it different?#
Account-based marketing reporting measures the performance of a coordinated sales-and-marketing motion against a defined list of target accounts. The unit of analysis is the account, not the lead.
That switch sounds small. It is not.
In demand-gen reporting, a lead is a row. You can count it, score it, route it, and call it qualified. In ABM, an account is a group of 6 to 17 buying-committee members (per Gartner's B2B buying research) whose collective behavior matters. One person downloading a whitepaper is signal. Three people from the same account engaging across email, web, and LinkedIn within two weeks is intent.
The reporting consequence: every metric needs to roll up to the account, then to the tier, then to the segment. If your BI tool can't do that join, your ABM reporting is structurally broken before you pick a single chart.
For a refresher on the underlying operating model, see the revenue operations entry in our glossary — RevOps owns the data plumbing that makes ABM reporting possible.
What are the four pillars of ABM reporting in 2026?#
Strip away the vendor jargon and every credible ABM reporting framework collapses to four pillars. Run them in order — coverage feeds engagement, engagement feeds pipeline, pipeline feeds revenue.
Pillar 1: Account coverage#
Are you reaching the buying committee, not just one champion?
Coverage is the cheapest pillar to fix and the one most teams skip. If you have 250 target accounts and contact data for an average of 2.3 buying-committee members per account, your ceiling on pipeline is already set. Gartner's research says buying committees average 11 people in enterprise deals. You need depth.
Key reports:
- Contact coverage by tier (target: 6+ contacts per Tier-1 account, 3+ for Tier-2)
- Title coverage by persona (CFO, VP Eng, Head of Procurement filled in)
- Net-new contact velocity per month
This is where contact-acquisition tools earn their keep. Teams use the Tomba email finder and domain search to fill coverage gaps when their main provider misses a persona, and pipe net-new contacts into the CRM via the HubSpot integration or Salesforce integration.
Pillar 2: Account engagement#
Are the right people at the right accounts spending time with you?
Engagement is where ABM platforms shine and where reporting goes wrong. "Engagement minutes" is not a metric your CFO believes in. Translate it.
Key reports:
- Accounts in each engagement stage (Aware → Engaged → Active → Opportunity)
- Stage-progression velocity (days to move from Engaged to Active)
- Engagement spread (how many committee members touched in the last 30 days)
Pillar 3: Pipeline velocity#
Are ABM accounts moving through your funnel faster than the rest?
If they aren't, ABM isn't working — or your reporting can't see it. Compare ABM-cohort accounts against a matched non-ABM cohort on three dimensions: time to opportunity, average deal size, and win rate.
Pillar 4: Influenced and sourced revenue#
What revenue would not exist without ABM?
Sourced revenue (deal originated from ABM activity) is the floor. Influenced revenue (ABM touched the account before close) is the ceiling. Report both. Pair with a holdout group of comparable accounts that didn't receive ABM treatment, and the gap is your honest answer.
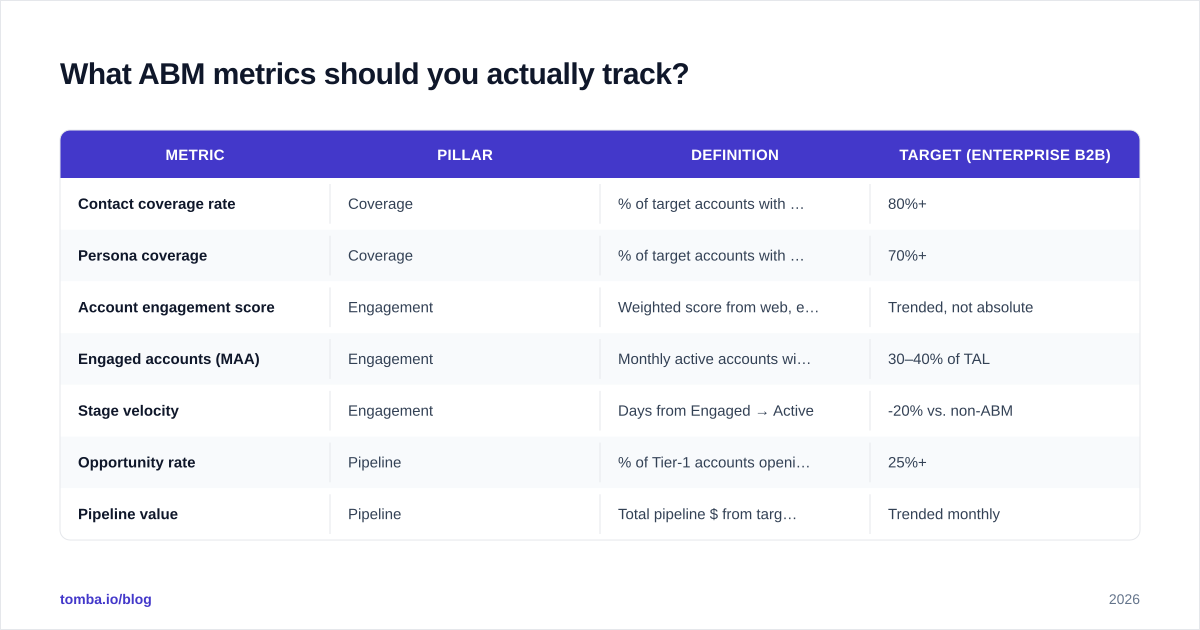
What ABM metrics should you actually track?#
Below is the working set. Not every team needs all 12, but anything outside this list should be questioned hard before it earns dashboard real estate.
| Metric | Pillar | Definition | Target (enterprise B2B) |
|---|---|---|---|
| Contact coverage rate | Coverage | % of target accounts with ≥6 mapped contacts | 80%+ |
| Persona coverage | Coverage | % of target accounts with key personas filled | 70%+ |
| Account engagement score | Engagement | Weighted score from web, email, ads, intent | Trended, not absolute |
| Engaged accounts (MAA) | Engagement | Monthly active accounts with ≥3 interactions | 30–40% of TAL |
| Stage velocity | Engagement | Days from Engaged → Active | -20% vs. non-ABM |
| Opportunity rate | Pipeline | % of Tier-1 accounts opening an opp in 12 months | 25%+ |
| Pipeline value | Pipeline | Total pipeline $ from target accounts | Trended monthly |
| Average deal size | Pipeline | ABM cohort vs. non-ABM cohort | +30% lift |
| Win rate | Revenue | Closed-won % on ABM-sourced opps | +15% lift |
| Sales cycle | Revenue | Avg days from opp to close | -20% lift |
| Sourced revenue | Revenue | Revenue from ABM-originated opps | Quarterly target |
| Influenced revenue | Revenue | Revenue where ABM touched the account pre-close | Quarterly target |
A note on the engagement score: keep it relative, not absolute. A score of "112" means nothing on its own. What matters is the trend per account and whether crossing a threshold (e.g., 100+) reliably predicts an opportunity opening within 60 days. Validate that correlation quarterly or stop using the score.
How do you build an ABM reporting dashboard that survives a CFO review?#
A CFO does not want 47 charts. They want three answers: how much pipeline, how much revenue, and how do I know it wouldn't have happened anyway?
Build five reports. Five.
- Executive summary — quarterly sourced + influenced revenue, ABM vs. holdout lift, total program cost, ROI multiple.
- Account funnel — TAL → Engaged → Active → Opportunity → Closed-Won, with conversion rates per stage.
- Tier performance — same funnel split by Tier 1 / 2 / 3 so you can see which tier earns its cost.
- Velocity comparison — ABM cohort vs. matched non-ABM cohort on cycle length, deal size, win rate.
- Coverage health — contact and persona coverage by tier, plus net-new contacts added this month.
That's it. Everything else is a drill-down inside those five.
The five-report rule is not a stylistic preference. It's a forcing function. If a metric doesn't earn a spot in those five, it earns a spot in a quarterly review deck — or in the archive.
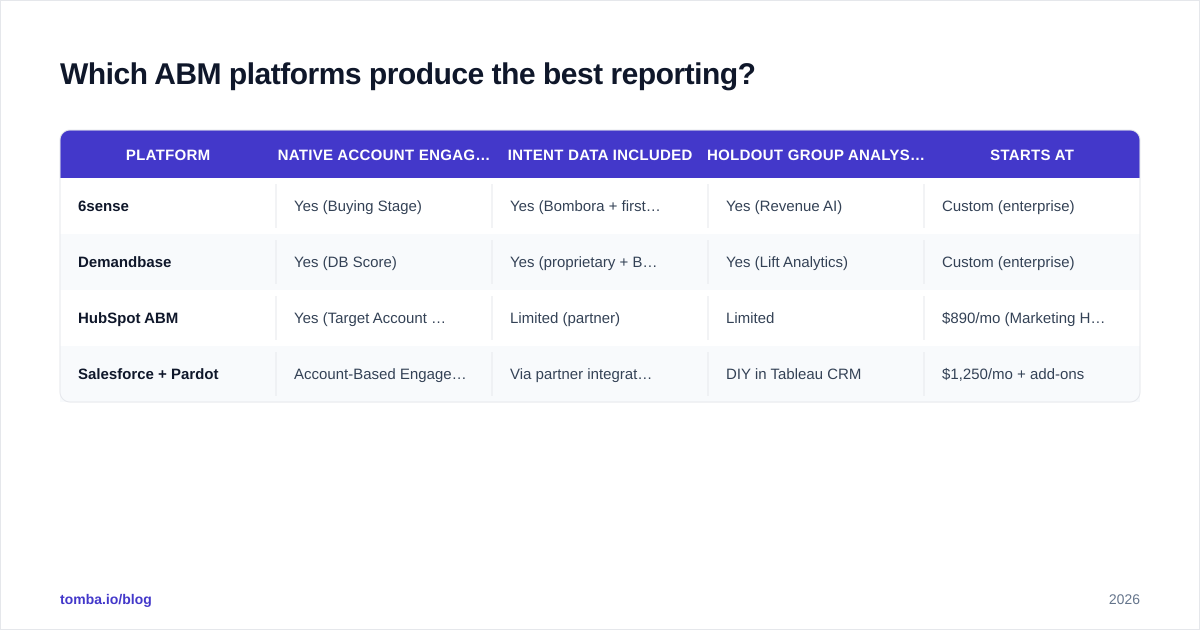
Which ABM platforms produce the best reporting?#
The platform market in 2026 is mature. The differences are at the edges. Here's how the four most-asked-about options compare from a reporting-output perspective.
| Platform | Native account engagement scoring | Intent data included | Holdout group analysis | Starts at |
|---|---|---|---|---|
| 6sense | Yes (Buying Stage) | Yes (Bombora + first-party) | Yes (Revenue AI) | Custom (enterprise) |
| Demandbase | Yes (DB Score) | Yes (proprietary + Bombora) | Yes (Lift Analytics) | Custom (enterprise) |
| HubSpot ABM | Yes (Target Account scoring) | Limited (partner) | Limited | $890/mo (Marketing Hub Pro) |
| Salesforce + Pardot | Account-Based Engagement add-on | Via partner integrations | DIY in Tableau CRM | $1,250/mo + add-ons |
If you're evaluating 6sense or Demandbase specifically, our 6sense alternative and Demandbase alternative pages walk through where each is strongest and where you might want a different fit. Independent reviews on G2 and Capterra also give you side-by-side user-reported reporting depth scores.
Whichever platform you pick, the reporting is only as good as the data flowing in. Garbage contact data, half-mapped accounts, broken UTM tracking — none of which is the platform's fault, all of which is your reporting team's problem to solve before the platform earns its first dashboard.
How do you handle ABM attribution without faking it?#
Attribution is the part of ABM reporting where most teams quietly cheat. Don't.
Three honest approaches:
Multi-touch attribution (MTA). Weight every touch in the buying journey. Good for explaining what worked. Weak at proving incrementality — if the deal would have closed without ABM, MTA still hands ABM credit.
Holdout testing. Pull a matched cohort of accounts that don't get ABM treatment. Run for two quarters. Measure the lift. Boring, slow, irrefutable. This is what the Forrester ABM research consistently flags as the gold standard.
Marketing mix modeling (MMM). Statistical attribution at the channel level. Useful for budget defense at scale. Overkill if you're under $5M ABM spend.
In 2026, most credible programs run MTA for tactical optimization plus a rolling holdout for executive reporting. Don't pick one. Run both.
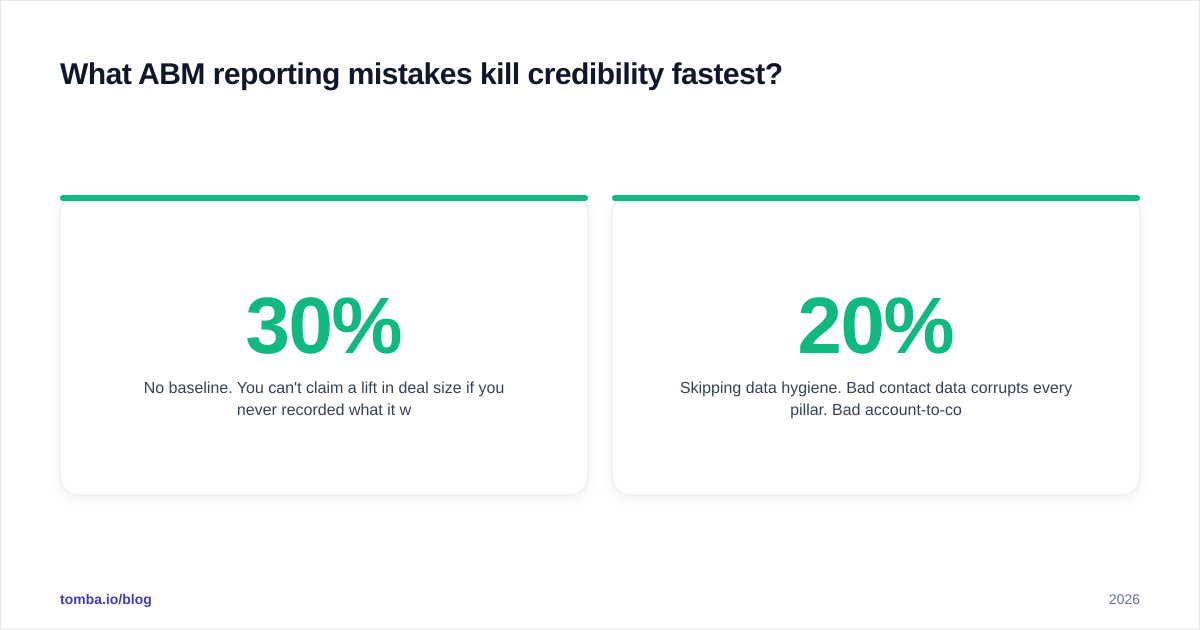
What ABM reporting mistakes kill credibility fastest?#
The pattern repeats across hundreds of programs. Same mistakes, same outcomes.
- Counting MQLs. ABM reports on accounts. The moment "MQLs from target accounts" appears in your dashboard, you've conceded the framework to demand-gen and you'll lose every budget fight.
- No baseline. You can't claim a 30% lift in deal size if you never recorded what it was before ABM started.
- Engagement score worship. A rising engagement score with flat pipeline is a warning sign. Validate the score predicts revenue every quarter or stop reporting it.
- Sourced revenue only. Sales takes credit for every closed deal. If you only report sourced, you'll always look small. Report influenced too — with a tight, honest definition.
- Quarterly reporting only. Pipeline movement happens weekly. Coverage gaps happen daily. If your reporting cadence is quarterly, you're managing on lagging indicators.
- One number for everyone. CFO needs ROI. CMO needs pipeline velocity. SDR manager needs persona coverage. Same data, different views.
- Skipping data hygiene. Bad contact data corrupts every pillar. Bad account-to-contact mapping corrupts engagement scores. Bad UTMs corrupt attribution. Invest 20% of program budget here or watch the other 80% misfire.
The last one is where most ABM reporting fails before it starts. You can't roll engagement up to the account if half your contacts aren't mapped to the right company record. You can't measure persona coverage if titles are unstandardized free-text. RevOps owns this. Reporting downstream is downstream.
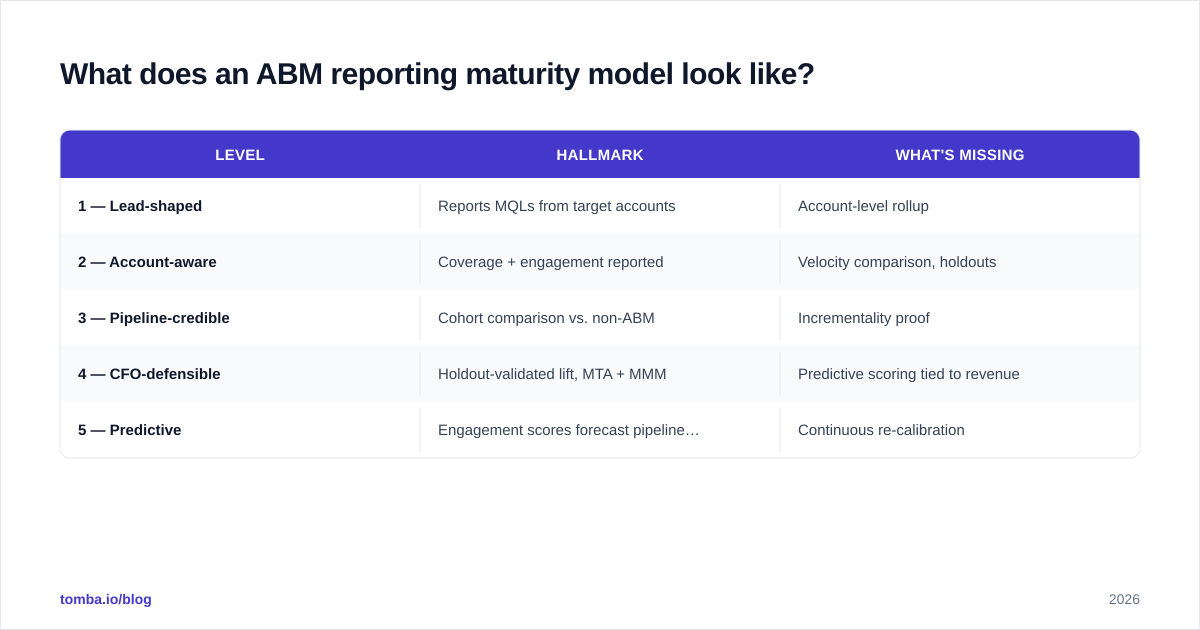
What does an ABM reporting maturity model look like?#
Most teams want to know where they stand. Use this rough ladder.
| Level | Hallmark | What's missing |
|---|---|---|
| 1 — Lead-shaped | Reports MQLs from target accounts | Account-level rollup |
| 2 — Account-aware | Coverage + engagement reported | Velocity comparison, holdouts |
| 3 — Pipeline-credible | Cohort comparison vs. non-ABM | Incrementality proof |
| 4 — CFO-defensible | Holdout-validated lift, MTA + MMM | Predictive scoring tied to revenue |
| 5 — Predictive | Engagement scores forecast pipeline by Tier | Continuous re-calibration |
Most teams in 2026 are sitting at Level 2 thinking they're at Level 4. Run a quick audit: if you can't produce a holdout comparison on demand, you are not above Level 3.
How does contact data quality affect ABM reporting?#
Your reporting is only as honest as your contact data. Three failure modes recur:
- Stale data. A 30%-per-year decay in B2B contact data (well-documented by HubSpot and others) means a list you bought 18 months ago is half wrong. Coverage reports based on stale data overstate readiness.
- Mis-mapped contacts. A contact at "Acme Corp HQ" and another at "Acme Corp - Europe" should both roll up to the same parent account. If they don't, engagement scores split and look weak.
- Missing personas. Reporting on persona coverage with empty title fields produces fiction. Standardize titles via enrichment before reporting on them.
The fix is unglamorous: continuous enrichment, regular bulk verification of your contact list, and a data enrichment workflow that runs on every new contact entering the CRM. Build it once, run it forever.
How often should you review ABM reporting?#
Three cadences:
- Weekly — SDR and AE pods review account coverage and engagement movement. Operational view.
- Monthly — Marketing + sales leadership review pipeline velocity and tier performance. Tactical view.
- Quarterly — Full holdout analysis, ROI calculation, program-level adjustments. Executive view.
Anything less frequent is decoration. Anything more frequent is noise.
Start reporting on what matters#
Most ABM programs don't fail because of bad strategy. They fail because the reporting can't prove they worked, the budget gets cut at renewal, and the platform sits unused by Q3. Fix the reporting and the budget defense follows.
Start with the four pillars. Build the five dashboards. Run a holdout. Get your contact data clean — coverage reports collapse fastest when 40% of your target accounts have stale or missing buying-committee data. The Tomba Email Finder plus the data enrichment workflow gives RevOps teams a fast way to plug coverage gaps before they show up in the executive dashboard — free tier includes 25 searches per month, paid plans start at $49/mo. Get your data right, your reporting will follow.
Get the Tomba newsletter
Practical outbound tactics and product updates — once every two weeks.
About the author