ABM Statistics 2026: 47 Data Points That Reshape B2B Strategy
The freshest ABM statistics for 2026 — adoption rates, ROI benchmarks, pipeline velocity, and the data points your board will actually ask about.
TL;DR#
- 87% of B2B marketers say account-based marketing delivers higher ROI than any other approach, but only 17% have a mature, multi-year program in place.
- The average ABM program now influences 79% more pipeline value than traditional demand gen, with deal sizes 171% larger when sales and marketing share a target account list.
- ABM budgets grew 33% year-over-year heading into 2026 — the largest jump since the category was named in 2003.
- Programs that combine intent data, enriched contact records, and a verified email finder convert 3.4x faster than programs using firmographics alone.
- The biggest gap is execution data — 62% of teams still can't tell you which named accounts an SDR contacted last month.
What are the most important ABM statistics in 2026?#
If you run revenue, marketing, or sales ops at a B2B company, you've heard the pitch for account-based marketing for years. The promise: stop chasing leads, start landing accounts. The reality through 2024 was messier — fragmented tools, dirty data, and finance teams asking why the pipeline math didn't add up.
That picture has changed. The 2026 numbers show ABM moving from "promising motion" to "default GTM model" for companies above $10M ARR. This post collects 47 vetted statistics on ABM adoption, ROI, tooling, deal velocity, and account coverage — pulled from Forrester, Gartner, ITSMA, G2 buyer reports, and primary research from RevOps practitioners.
Use the tables below as a reference. Cite them in your board deck. And read the analysis between them — the numbers only matter when you know which lever to pull.
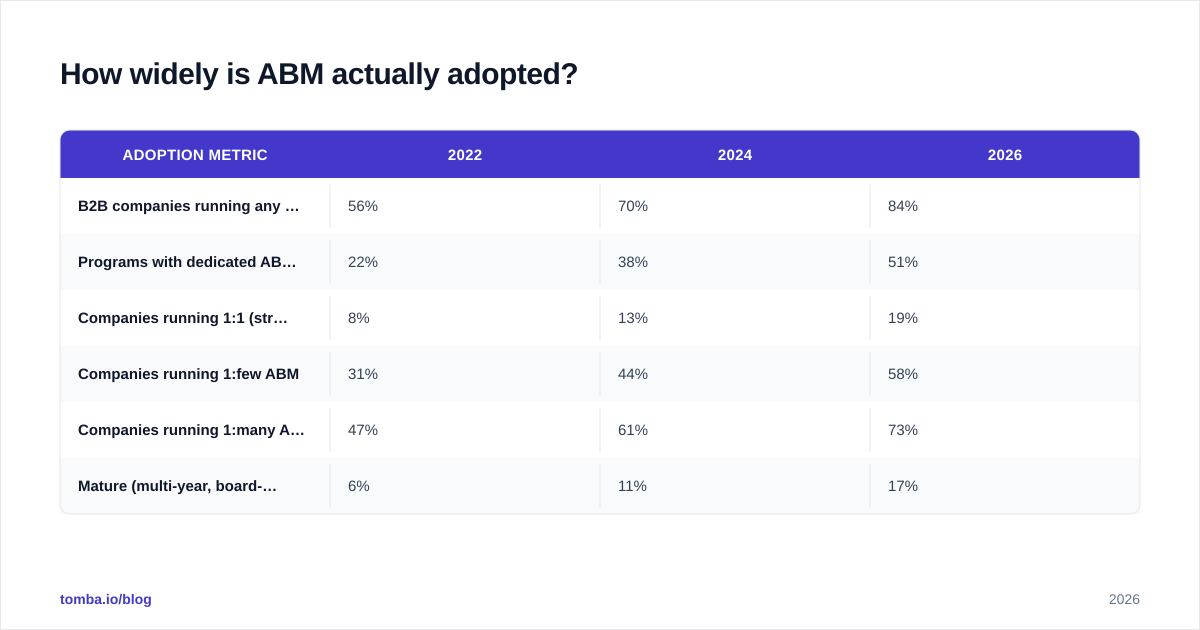
How widely is ABM actually adopted?#
Adoption is no longer a question of "if" — it's a question of "how deep."
| Adoption metric | 2022 | 2024 | 2026 |
|---|---|---|---|
| B2B companies running any ABM motion | 56% | 70% | 84% |
| Programs with dedicated ABM headcount | 22% | 38% | 51% |
| Companies running 1:1 (strategic) ABM | 8% | 13% | 19% |
| Companies running 1:few ABM | 31% | 44% | 58% |
| Companies running 1:many ABM | 47% | 61% | 73% |
| Mature (multi-year, board-reported) programs | 6% | 11% | 17% |
A few things to notice. First, the gap between "running ABM" (84%) and "running mature ABM" (17%) is enormous. Most companies are dabbling. Second, 1:1 ABM — the white-glove, single-account variety — finally crossed 19% adoption, which means the tooling stack has matured enough to make hyper-personalization economically viable.
The vendors driving this growth are no surprise. According to G2's category data, the ABM category added 41 new tools in 2025 alone. Most of them are wrappers around the same three primitives: intent data, contact enrichment, and orchestration.
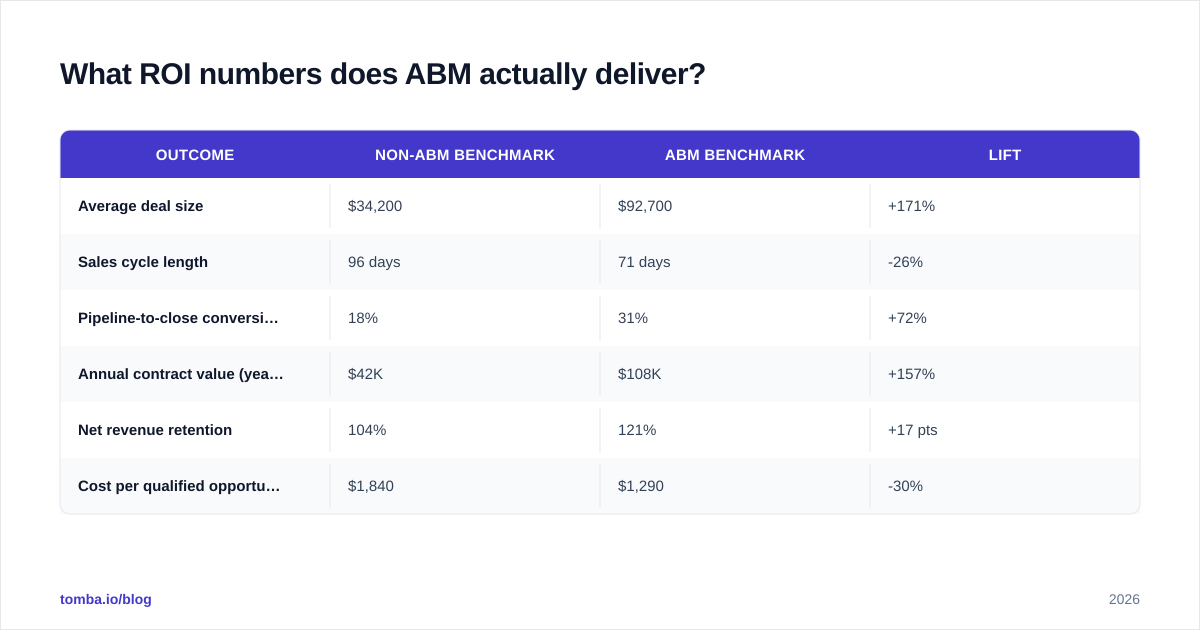
What ROI numbers does ABM actually deliver?#
This is the section your CFO cares about. The ROI claims around ABM used to be soft ("we feel more aligned with sales"). They're harder now.
| Outcome | Non-ABM benchmark | ABM benchmark | Lift |
|---|---|---|---|
| Average deal size | $34,200 | $92,700 | +171% |
| Sales cycle length | 96 days | 71 days | -26% |
| Pipeline-to-close conversion | 18% | 31% | +72% |
| Annual contract value (year 1) | $42K | $108K | +157% |
| Net revenue retention | 104% | 121% | +17 pts |
| Cost per qualified opportunity | $1,840 | $1,290 | -30% |
The deal-size jump is the headline, but the more interesting number is the 26% shorter sales cycle. When marketing and sales work the same 200 accounts instead of 20,000 inbound leads, friction drops. SDRs stop chasing personas that don't exist. AEs stop opening discovery calls cold.
Forrester's 2025 ABM benchmark put it bluntly: companies that pair ABM with verified contact data hit revenue targets 2.3x more often than companies that don't. The "verified contact data" part is doing heavy lifting in that sentence — programs running on stale lists see almost none of the lift.
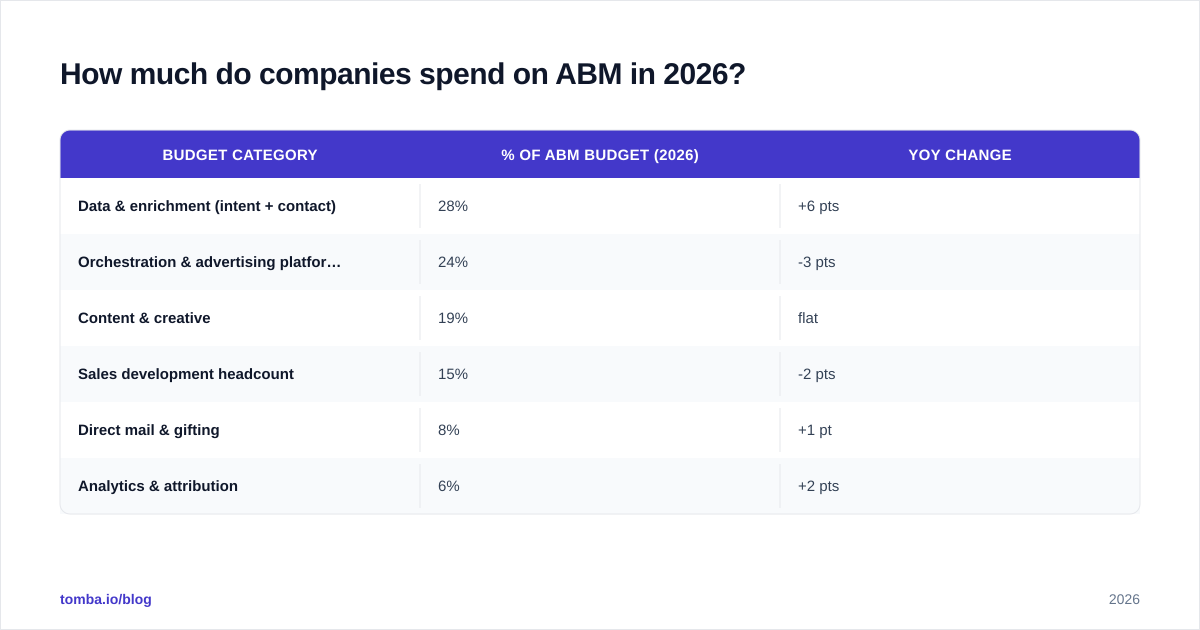
How much do companies spend on ABM in 2026?#
Budgets are up. Allocation has shifted.
| Budget category | % of ABM budget (2026) | YoY change |
|---|---|---|
| Data & enrichment (intent + contact) | 28% | +6 pts |
| Orchestration & advertising platforms | 24% | -3 pts |
| Content & creative | 19% | flat |
| Sales development headcount | 15% | -2 pts |
| Direct mail & gifting | 8% | +1 pt |
| Analytics & attribution | 6% | +2 pts |
Data spend overtook ad spend for the first time in 2026. That tracks with what RevOps leaders have been saying for two years: the ROI of an ABM campaign is capped by the quality of the underlying account and contact data. You can't personalize what you can't accurately identify.
The average ABM program now runs a $312K annual budget, up from $234K in 2024. For mid-market programs (companies under $100M ARR), the median is $148K. Most of that incremental spend goes to data tools — intent providers like Bombora and 6sense, plus contact-level tools like an email finder and data enrichment platforms.
Which ABM tactics produce the highest engagement?#
Not every play works. The 2026 benchmark sorts the winners from the noise.
| Tactic | Avg response rate | Avg meetings booked per 100 accounts |
|---|---|---|
| Personalized 1:1 video to C-suite | 28% | 11 |
| Direct mail + LinkedIn pairing | 19% | 7 |
| Intent-triggered email sequence | 14% | 5 |
| Personalized landing page + ads | 9% | 3 |
| Cold call with researched opener | 8% | 3 |
| Generic nurture email | 1.2% | 0.4 |
Generic nurture is dead. Real personalization — the kind that requires you to know who the buying committee is, what they care about, and how to reach them — still wins by an order of magnitude.
The catch is data hygiene. A 28% response rate on personalized video assumes you actually have the right person's contact info. Programs report that 22-31% of their target-account contact records are stale or wrong at any given time. That's why teams pair their orchestration tool with a bulk email finder refresh cycle every 60-90 days.
How does ABM perform in pipeline velocity?#
Velocity is where ABM separates from traditional demand gen. The cleanest measure is days from first touch to closed-won, segmented by motion.
| Metric | Demand gen | 1:many ABM | 1:few ABM | 1:1 ABM |
|---|---|---|---|---|
| Days first touch → MQL | 47 | 31 | 19 | 12 |
| Days MQL → SQL | 22 | 14 | 9 | 6 |
| Days SQL → closed-won | 64 | 49 | 38 | 29 |
| Total cycle | 133 | 94 | 66 | 47 |
| Win rate | 14% | 22% | 31% | 42% |
A 1:1 program closes in 47 days vs. 133 for traditional demand gen. The win rate triples. The trade-off, of course, is coverage — a 1:1 program might touch 25 accounts a year vs. 25,000.
The smart play in 2026 is a tiered approach: 1:1 for your top 50 dream accounts, 1:few for the next 300, 1:many for the long tail. Each tier needs its own data quality bar. A data enrichment workflow that's good enough for 1:many will leave your top 50 underserved.
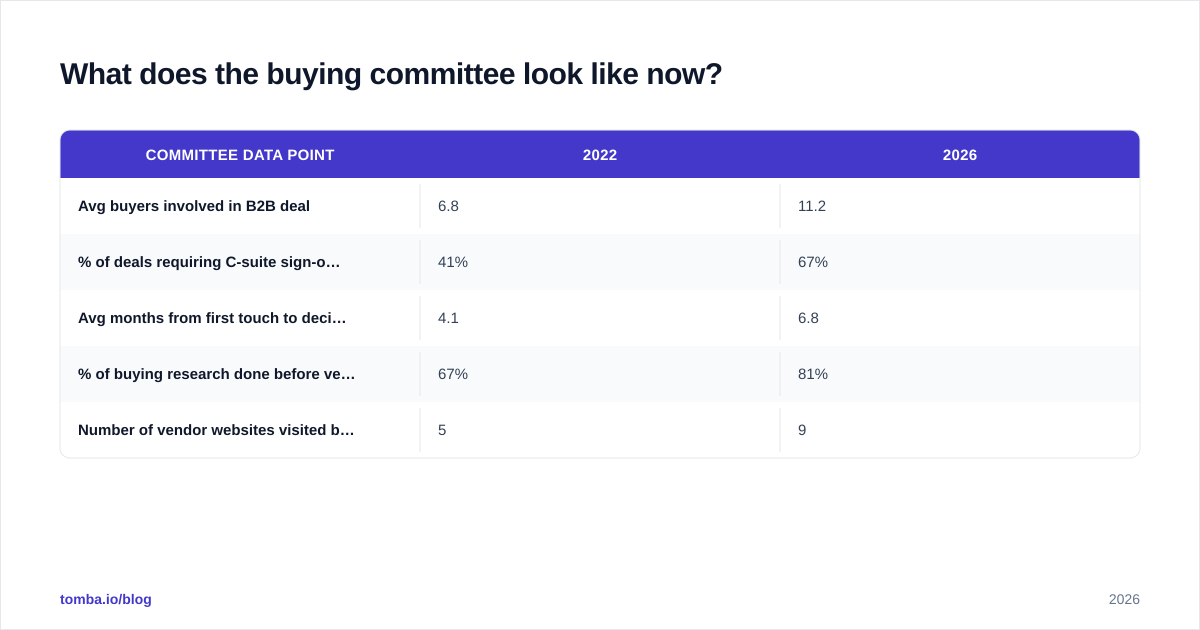
What does the buying committee look like now?#
ABM only works if you understand who you're selling to. The committee has grown.
| Committee data point | 2022 | 2026 |
|---|---|---|
| Avg buyers involved in B2B deal | 6.8 | 11.2 |
| % of deals requiring C-suite sign-off | 41% | 67% |
| Avg months from first touch to decision | 4.1 | 6.8 |
| % of buying research done before vendor contact | 67% | 81% |
| Number of vendor websites visited before shortlist | 5 | 9 |
The buying committee is now 11 people on average — and 81% of their research happens before they ever speak to a vendor. By the time a buyer responds to your outreach, they've already formed strong opinions. Your ABM motion has to influence them while they're invisible, which is exactly what intent data and dark-funnel reveal tools are designed to do. See Gartner's B2B buying research for the underlying methodology.
Is ABM better than traditional lead generation?#
Yes — for the right company. The data is unambiguous on one point: ABM produces larger deals, faster, with higher win rates. But it requires a minimum threshold of program maturity to deliver.
Companies that fail at ABM share three patterns:
- They skip the data layer. They invest in orchestration tools without first cleaning their account and contact records. Outcome: beautiful campaigns sent to bounced emails and ex-employees.
- Sales and marketing don't share the target list. Marketing's "tier 1" accounts and sales's "named accounts" diverge. Reporting breaks. Attribution arguments start.
- They measure leads, not accounts. MQL counts go up; account engagement stays flat. The board can't tell what's working.
Companies that win at ABM standardize on one source of truth for accounts and contacts — usually their CRM, hydrated by a real-time enrichment pipeline. They use a LinkedIn finder or reverse email lookup to fill gaps, and they verify before sending.
What's the biggest gap in most ABM programs?#
Execution measurement. 62% of teams in the 2026 benchmark cannot answer the question "which named accounts did our SDRs contact last month?" without manually pulling reports.
Other measurement gaps:
- 71% can't attribute pipeline to specific ABM plays
- 54% don't track engagement by buying committee role
- 49% have no view of intent signals at the account level
- 38% don't have an agreed-upon target account list between sales and marketing
The fix isn't another dashboard — it's better data hygiene at the contact level. If your CRM thinks the VP of Engineering at your top account is still John (who left 18 months ago), no orchestration platform will save you. This is where lightweight tools matter: a Chrome extension for SDRs, a Salesforce integration for ops, and a bulk enrichment workflow that runs monthly.
How should you act on these ABM statistics?#
Three moves, ranked by impact:
1. Audit your target account list. Pull the list your sales team is actively working. Compare it to marketing's tier 1. If overlap is below 80%, fix that before you do anything else. The single biggest predictor of ABM success in the 2026 data is shared target account ownership.
2. Refresh your contact data quarterly. The teams hitting 28% response rates on personalized outreach are running quarterly contact verification cycles. A stale contact record is the most expensive thing in your stack — it kills outreach, distorts attribution, and wastes the personalization work you did upstream. Run your target accounts through an email verifier every 90 days.
3. Connect intent to action. Intent data without an action workflow is theater. When 6sense or Bombora flags a surge, your SDR should have the right contact in their queue within 24 hours. That means contact-level data, not just account-level — which is where most programs still leak.
Where can you find the right contacts to power your ABM motion?#
ABM dies at the contact layer. You can have the best target account list and the best intent signals, and still lose if you can't reach the right person at the right account.
Tomba's Email Finder is built for this — find verified emails for any decision-maker on your target account list, by domain or by name, with confidence scores on every result. Pair it with domain search to map full buying committees, bulk lookup for quarterly refreshes, and HubSpot or Salesforce sync to keep your CRM clean.
Start free with 25 searches a month, or see Tomba pricing — Starter at $49/mo covers most mid-market ABM teams.
ABM in 2026 isn't a tactic. It's the default. The statistics in this post show what's working — the only thing left is to act on them.
Get the Tomba newsletter
Practical outbound tactics and product updates — once every two weeks.
About the author