ACV Meaning: Annual Contract Value Explained (2026 Guide)
ACV meaning, made simple: what Annual Contract Value is, the exact formula, worked examples, and how it differs from ARR, TCV, and MRR in modern SaaS sales.
TL;DR
- ACV meaning: Annual Contract Value is the average yearly revenue a single customer contract generates, normalized to a 12-month period.
- The basic formula is total contract value ÷ contract length in years (one-time fees handled separately).
- ACV is not ARR, TCV, or MRR — confusing them wrecks forecasts, quota planning, and CAC payback math.
- Sales and RevOps teams use ACV to compare deals of different lengths on equal footing and to spot expansion vs. churn trends.
- High ACV usually demands better data and tighter targeting — which is where contact accuracy directly affects pipeline quality.
What is the meaning of ACV?#
ACV (Annual Contract Value) is the normalized yearly revenue from a single customer contract. Think of it like the "miles per year" rating on a car lease: a three-year lease and a one-year lease look very different in total, but per-year they become comparable. ACV does the same for sales contracts of different lengths.
Technically, ACV takes the recurring value of a deal and expresses it as an annual number. If a customer signs a $36,000 deal over three years, the ACV is $12,000 — even though the cash and the total contract value are much larger. That single normalization is why ACV is one of the most-quoted metrics in B2B SaaS finance and revenue operations.
The reason the term matters: leaders cannot compare a 12-month deal against a 36-month deal using raw contract totals. One looks "bigger" only because it spans more time. ACV strips the time distortion out so a $12K/year customer and a $12K/year customer read as equals, regardless of how long each committed.
There is no single governing body that defines ACV, so definitions vary slightly between companies. Some include one-time onboarding fees; most exclude them. The important thing is to pick one definition and apply it consistently across every deal, dashboard, and board report.
How do you calculate ACV? (The formula)#
The core ACV formula is straightforward:
ACV = Total Recurring Contract Value ÷ Contract Term (in years)

Let's walk through worked examples so the meaning sticks.
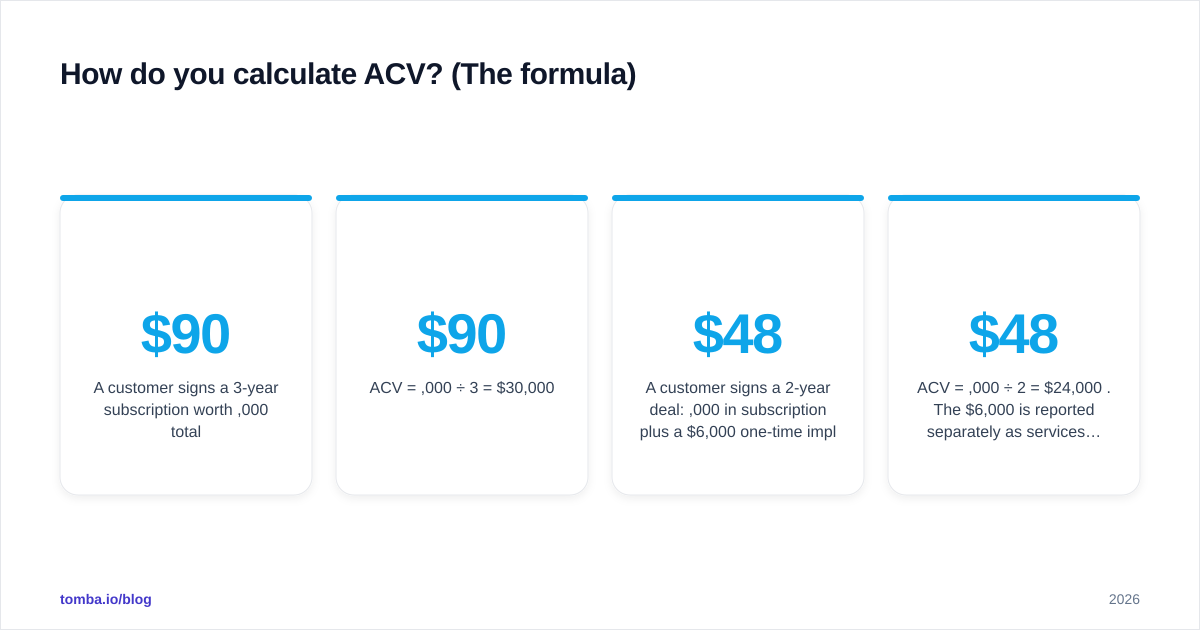
Example 1 — simple multi-year deal A customer signs a 3-year subscription worth $90,000 total. ACV = $90,000 ÷ 3 = $30,000 per year.
Example 2 — deal with a one-time fee A customer signs a 2-year deal: $48,000 in subscription plus a $6,000 one-time implementation fee. Most teams exclude one-time fees from ACV. ACV = $48,000 ÷ 2 = $24,000 per year. The $6,000 is reported separately as services revenue.
Example 3 — single-year deal A 12-month contract worth $15,000. ACV = $15,000 ÷ 1 = $15,000. For one-year deals, ACV and total contract value are identical, which is why people often confuse the two.
The one decision you must make up front: do you include one-time fees? HubSpot and most SaaS finance teams recommend excluding them so ACV reflects only the repeatable, renewable portion of revenue. If you bundle implementation fees into ACV, your year-one numbers inflate and your renewal forecasts break.

ACV vs ARR vs TCV vs MRR: what's the difference?#
This is where most confusion lives. These four metrics are related but answer different questions. Here's the direct comparison.
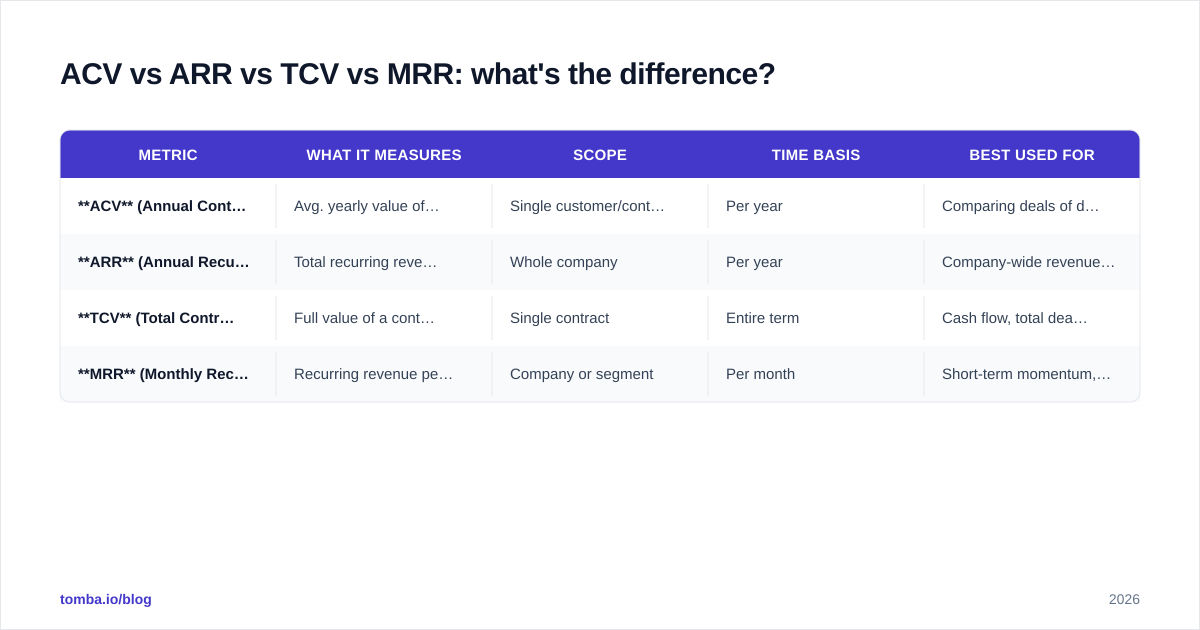
| Metric | What it measures | Scope | Time basis | Best used for |
|---|---|---|---|---|
| ACV (Annual Contract Value) | Avg. yearly value of one contract | Single customer/contract | Per year | Comparing deals of different lengths |
| ARR (Annual Recurring Revenue) | Total recurring revenue across all customers | Whole company | Per year | Company-wide revenue health |
| TCV (Total Contract Value) | Full value of a contract over its life | Single contract | Entire term | Cash flow, total deal size |
| MRR (Monthly Recurring Revenue) | Recurring revenue per month | Company or segment | Per month | Short-term momentum, monthly trends |
A few clarifying points:
- ACV is per-contract; ARR is per-company. If every customer paid the same ACV, ARR would simply be ACV × number of customers. In practice ACV is a deal-level lens and ARR is the aggregate.
- TCV is the whole pie; ACV is one annual slice. A $90,000 / 3-year deal has a TCV of $90,000 and an ACV of $30,000. Reps love quoting TCV because it sounds bigger — which is exactly why finance normalizes to ACV.
- MRR × 12 ≈ ARR at the company level, while ACV stays anchored to individual contracts.

Salesforce, Gartner, and most SaaS investors will ask for ARR first, then dig into ACV to understand deal quality. A company can grow ARR by closing many small deals or a few large ones — and ACV is what reveals which.
Why does ACV matter for sales and RevOps teams?#
ACV matters because it converts messy, variable-length contracts into a single number you can plan around. Here is where it does real work:
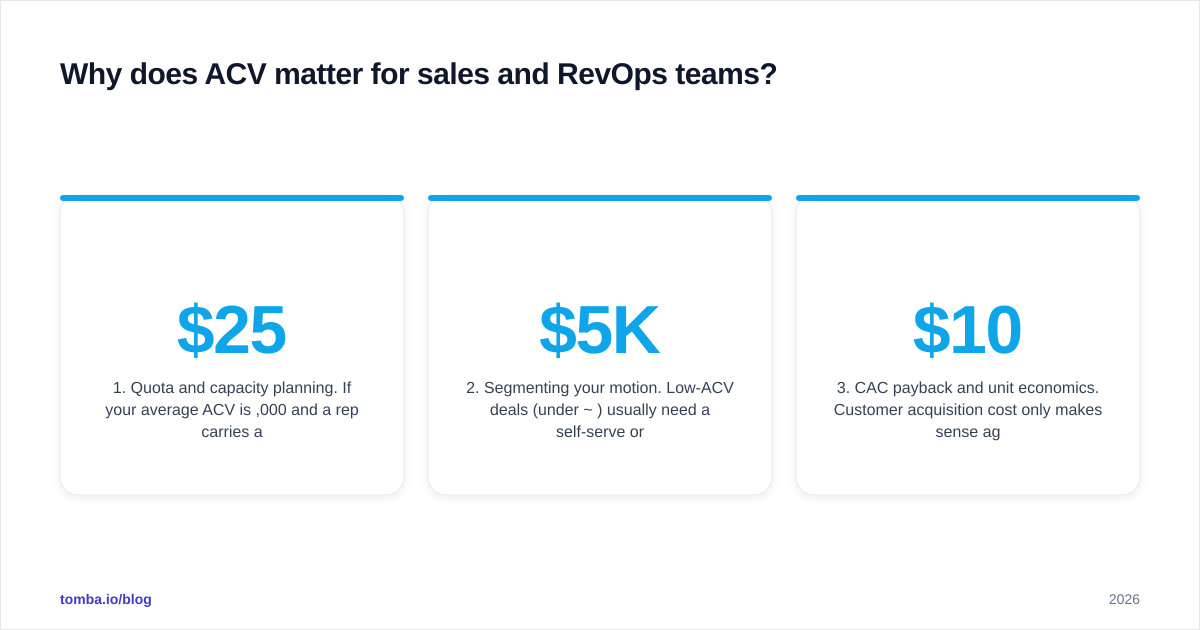
1. Quota and capacity planning. If your average ACV is $25,000 and a rep carries a $1M quota, you know they need roughly 40 new annualized deals. Without ACV, you'd be comparing apples (one-year deals) to oranges (multi-year deals) and your headcount math would drift.
2. Segmenting your motion. Low-ACV deals (under ~$5K/year) usually need a self-serve or high-velocity inside-sales motion. High-ACV deals (six figures) justify field sales, custom demos, and longer cycles. ACV is the dividing line that tells you which playbook a deal deserves.
3. CAC payback and unit economics. Customer acquisition cost only makes sense against the annual value a customer returns. A $10,000 CAC is reckless at $4,000 ACV and a bargain at $40,000 ACV. This ratio drives nearly every board conversation about efficiency.
4. Expansion and churn signals. Tracking ACV over time per account surfaces upsell (ACV rising) and contraction (ACV falling) before they show up in churn reports. RevOps teams build early-warning dashboards on exactly this movement.
5. Forecasting accuracy. Because ACV normalizes time, your pipeline forecast stops being skewed by a couple of long multi-year deals that would otherwise distort a quarter.
For teams obsessed with improving win rate and pipeline efficiency, ACV is the metric that connects activity to revenue reality. It tells you not just how many deals you closed, but how much durable annual revenue each one actually represents.
How do you increase ACV?#
Raising ACV is usually more profitable than chasing logo count, because you're growing revenue without proportionally growing acquisition cost. The proven levers:
- Tiered pricing and packaging. Move customers up a pricing ladder with clear feature gates. Good packaging is the single biggest ACV driver.
- Annual (or multi-year) commitments. Incentivize longer terms with a discount; you trade a small margin hit for predictable, higher-commitment revenue.
- Cross-sell and add-ons. Modules, seats, usage tiers, and premium support all lift the annual value of an existing relationship.
- Better-fit targeting. This is the quiet one. The fastest way to raise ACV is to start more conversations with companies that can actually afford and use your higher tiers. Selling a $50K product to $5K-budget prospects caps your ACV no matter how good your packaging is.
That last point is where your prospecting data quality becomes an ACV lever. If your outbound list is full of dead emails, junior contacts, or mis-sized companies, your average deal shrinks. Enriching and verifying your target accounts — getting to the right decision-maker at the right-sized company — pushes ACV up at the very top of the funnel. Clean data enrichment and accurate contact discovery aren't just deliverability hygiene; they shape the size of every deal you start.
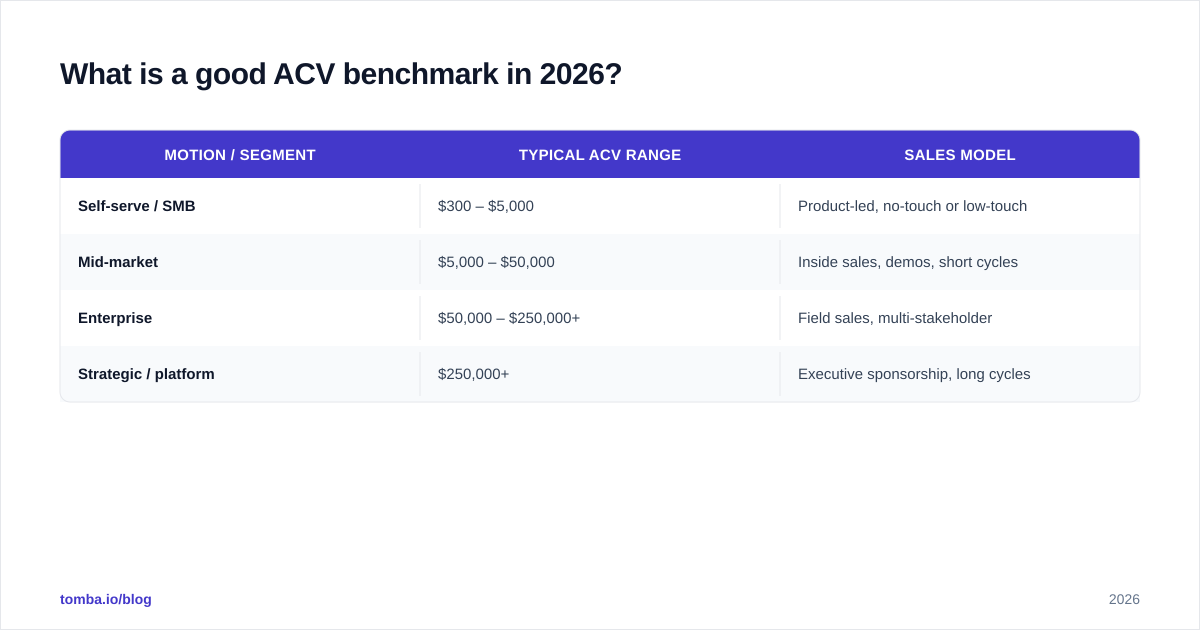
What is a good ACV benchmark in 2026?#
There is no universal "good" ACV — it's entirely segment-dependent. What's healthy is benchmarked against your motion:
| Motion / segment | Typical ACV range | Sales model |
|---|---|---|
| Self-serve / SMB | $300 – $5,000 | Product-led, no-touch or low-touch |
| Mid-market | $5,000 – $50,000 | Inside sales, demos, short cycles |
| Enterprise | $50,000 – $250,000+ | Field sales, multi-stakeholder |
| Strategic / platform | $250,000+ | Executive sponsorship, long cycles |
The trap is comparing your ACV to a company in a different tier. A product-led tool with a $1,200 ACV and 50,000 customers can be far healthier than an enterprise vendor with a $120,000 ACV and constant churn. What matters is whether your ACV is rising over time, whether it covers your CAC within a sensible payback window, and whether it's consistent with your go-to-market motion.
Watch for these red flags:
- ACV flat or falling while CAC rises — your unit economics are inverting.
- Wildly inconsistent ACV across reps — a sign of discounting chaos or unqualified pipeline.
- ACV propped up entirely by one-time fees — strip them out and the recurring base may be weak.
A practical 2026 habit: review ACV alongside net revenue retention. ACV tells you the entry size of new business; retention tells you whether that value compounds or leaks. Together they describe the real shape of your revenue.
Common ACV mistakes to avoid#
Even experienced teams trip on these:
- Mixing one-time fees into recurring ACV. It inflates year one and corrupts renewal forecasts. Keep services revenue separate.
- Confusing ACV with TCV in board decks. Quoting the multi-year total as if it were annual makes growth look better than it is — until renewals come due.
- Averaging ACV across wildly different segments. A blended number that mixes $500 SMB deals with $200K enterprise deals hides the truth. Segment first.
- Ignoring ACV at the discovery stage. If reps don't qualify for company size and budget early, low-ACV deals clog the pipeline. Better contact and account data up front prevents this.
- Letting CRM data rot. ACV reporting is only as good as the underlying CRM records. Stale contacts and duplicate accounts produce garbage averages.
Frequently asked questions about ACV#
Does ACV include one-time fees? Usually no. Most SaaS teams exclude one-time implementation or setup fees so ACV reflects only repeatable, renewable revenue. Report one-time fees separately as services revenue.
Is ACV the same as ARR? No. ACV is the annual value of a single contract; ARR is the total annual recurring revenue across all customers. ACV is a deal-level lens; ARR is the company-level aggregate.
What's the difference between ACV and TCV? TCV is the entire value of a contract over its full life; ACV is that value divided by the number of years. A $90K / 3-year deal has a $90K TCV and a $30K ACV.
Can ACV be higher than ARR? For a single very large customer, that customer's ACV could exceed a tiny company's total ARR — but at the company level, ARR is the sum of all annualized contract values, so company ARR is always ≥ any single deal's ACV.
Where Tomba fits into your ACV strategy#
Higher ACV starts with reaching the right decision-makers at the right-sized accounts — and that depends on accurate contact data. Tomba's Email Finder helps your team find and verify professional email addresses by domain, name, or company, so your outbound targets the buyers who can actually sign larger deals instead of bouncing on dead inboxes.
Pair it with bulk discovery and enrichment to size accounts before you spend a rep's time on them, and your average ACV climbs from the very first touch. Start on the free tier (25 searches/month) and scale up as your pipeline grows — see Tomba pricing for the Starter ($49/mo), Growth ($99/mo), and Pro ($249/mo) plans. Better data at the top of the funnel is the most underrated ACV lever you have.
Further reading on SaaS metrics: HubSpot's revenue glossary, Salesforce's sales metrics resources, and Gartner's go-to-market research.
Get the Tomba newsletter
Practical outbound tactics and product updates — once every two weeks.
About the author