ACV vs ARR in 2026: How to Use Each SaaS Metric Right
ACV and ARR sound interchangeable but measure different things. Here's how each metric works, when to use it, and how to stop mixing them up in board decks.
TL;DR
- ARR (annual recurring revenue) is the total recurring revenue your whole subscription base produces in a year. ACV (annual contract value) is the average yearly value of a single contract. One is a base, the other is a per-deal unit.
- Use ARR to track company-level growth, valuation, and net revenue retention. Use ACV to size deals, segment your market, and benchmark sales efficiency.
- The most common mistake is reporting ACV that includes one-time fees, then comparing it against ARR that excludes them. Pick one treatment of non-recurring revenue and apply it everywhere.
- For a five-customer, multi-year book, ARR and total ACV can look identical — but they diverge the moment contract lengths vary.
- ACV feeds CAC payback and quota math; ARR feeds the growth-rate story investors actually price.
What is the difference between ACV and ARR?#
Short answer: ARR measures your recurring revenue base; ACV measures the yearly worth of one contract. They answer different questions, so neither replaces the other.
ARR is a portfolio metric. It tells you, across every active subscription, how much recurring revenue you can expect over the next twelve months. When a board asks "how big is the business," ARR is the number on the slide.
ACV is a deal metric. It normalizes contracts of different lengths into a per-year figure so you can compare a 12-month deal against a 36-month deal fairly. When a sales leader asks "what's an average deal worth," ACV is the answer.
Here's the everyday analogy: think of a gym. ARR is the gym's total expected membership income for the year — every member's dues added up. ACV is what the average single membership is worth per year. Sign one new member and ACV barely moves; sign two hundred and ARR jumps. You need both numbers to run the gym, but you'd never use one in place of the other.

How do you calculate ACV and ARR?#
The formulas are simple; the discipline is in how you treat one-time fees.
ACV (single contract):
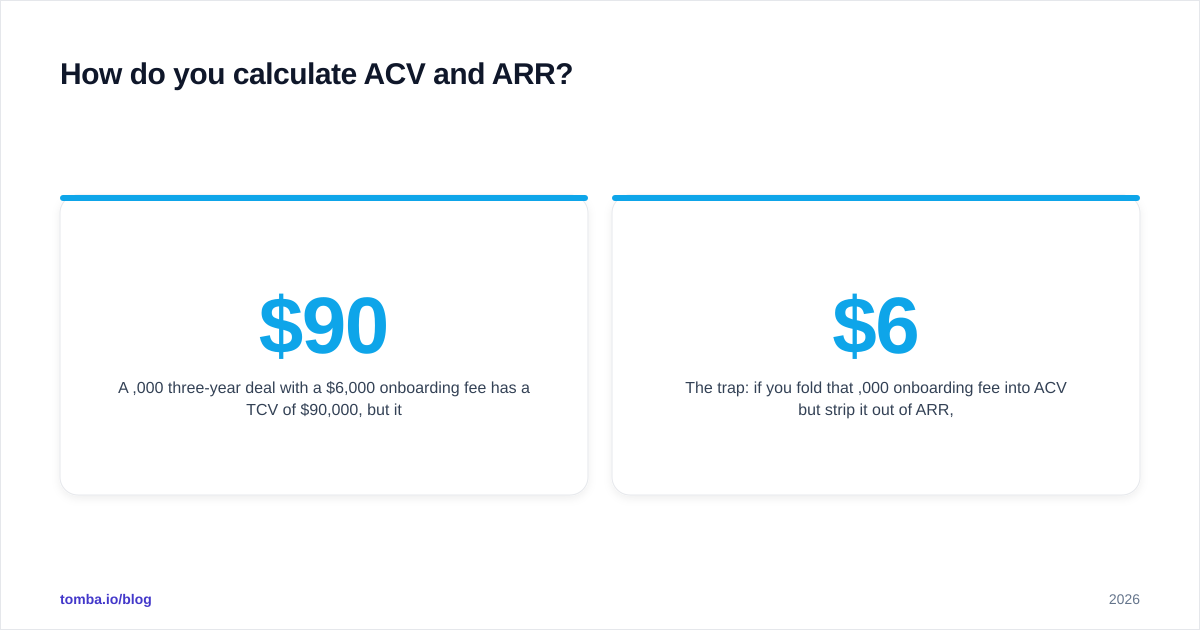
ACV = (Total Contract Value − one-time fees) / contract term in yearsA $90,000 three-year deal with a $6,000 onboarding fee has a TCV of $90,000, but its ACV is ($90,000 − $6,000) / 3 = $28,000 per year.
ARR (whole base):
ARR = sum of the annualized recurring revenue of all active subscriptionsOr, equivalently, ARR = MRR × 12 if you track monthly recurring revenue first.
The trap: if you fold that $6,000 onboarding fee into ACV but strip it out of ARR, your two metrics now live in different universes. Setup fees, professional services, and usage overages are all non-recurring — decide once whether they count, document it, and never let one report include them while another excludes them. This is exactly the kind of definition drift that good revenue operations hygiene exists to prevent.

ACV vs ARR: a side-by-side comparison#
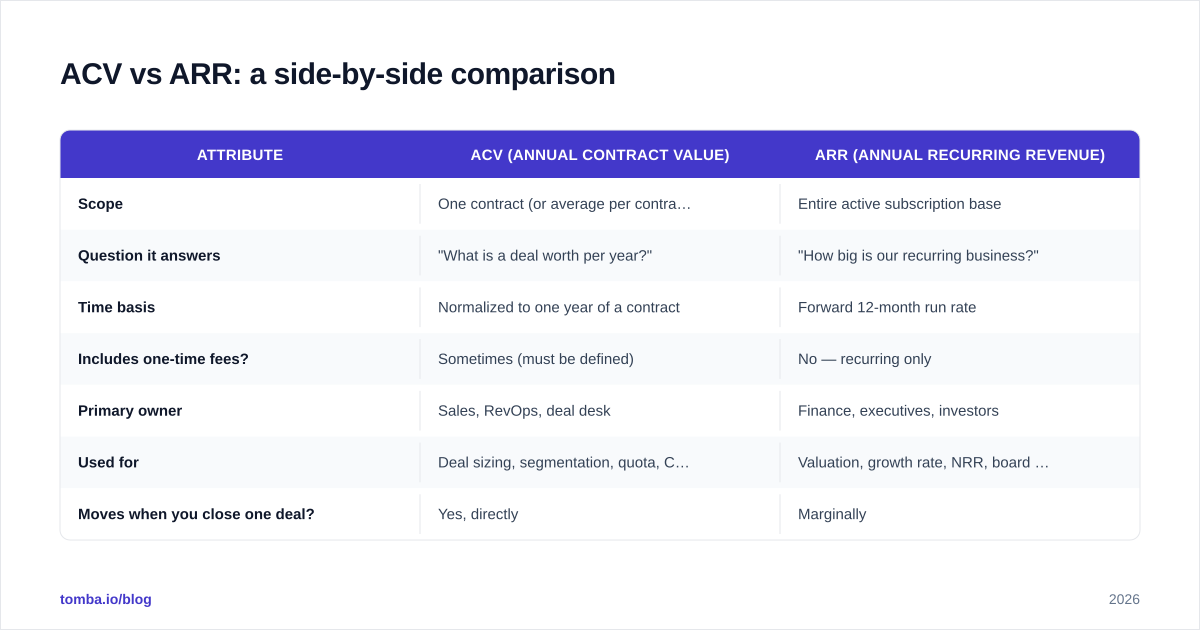
| Attribute | ACV (Annual Contract Value) | ARR (Annual Recurring Revenue) |
|---|---|---|
| Scope | One contract (or average per contract) | Entire active subscription base |
| Question it answers | "What is a deal worth per year?" | "How big is our recurring business?" |
| Time basis | Normalized to one year of a contract | Forward 12-month run rate |
| Includes one-time fees? | Sometimes (must be defined) | No — recurring only |
| Primary owner | Sales, RevOps, deal desk | Finance, executives, investors |
| Used for | Deal sizing, segmentation, quota, CAC payback | Valuation, growth rate, NRR, board reporting |
| Moves when you close one deal? | Yes, directly | Marginally |
| Typical view | Per-segment average (SMB vs Enterprise) | Single company-wide total |
The table makes the core point: these metrics rarely compete because they operate at different altitudes. ACV is a microscope on the deal; ARR is the satellite view of the company.
When should you use ACV instead of ARR?#
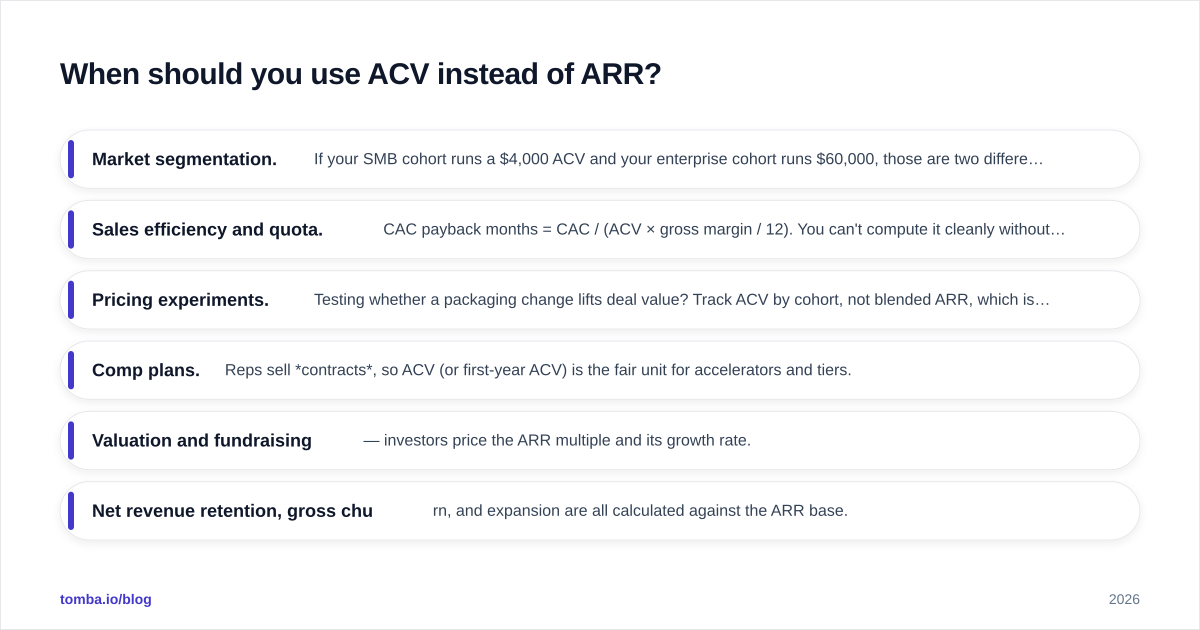
Reach for ACV whenever the decision is about deals, segments, or sales motion:
- Market segmentation. If your SMB cohort runs a $4,000 ACV and your enterprise cohort runs $60,000, those are two different businesses with different sales cycles, support loads, and CAC. ARR alone hides that spread.
- Sales efficiency and quota. CAC payback months = CAC / (ACV × gross margin / 12). You can't compute it cleanly without a per-deal annual figure.
- Pricing experiments. Testing whether a packaging change lifts deal value? Track ACV by cohort, not blended ARR, which is too noisy.
- Comp plans. Reps sell contracts, so ACV (or first-year ACV) is the fair unit for accelerators and tiers.
Reach for ARR when the question is about the company as a whole:
- Valuation and fundraising — investors price the ARR multiple and its growth rate.
- Net revenue retention, gross churn, and expansion are all calculated against the ARR base.
- Board-level "are we on plan" tracking.
A practical rule from most RevOps and GTM teams: ARR is the headline, ACV is the diagnosis. When ARR growth stalls, you slice ACV by segment to find out why.
Why do ACV and ARR get confused?#
Three reasons, all fixable.
1. They share a denominator. Both are annualized, so a tidy single-year, single-customer example makes them look like the same number. They only visibly diverge across multi-year terms and multiple customers.
2. "Average ACV" looks like ARR ÷ customers. It often is — but only if every contract is exactly one year with no non-recurring revenue. Add a 3-year deal or a setup fee and the shortcut breaks.
3. Inconsistent fee treatment. As covered above, the single biggest source of mismatched reporting is one team counting professional services in ACV while finance excludes them from ARR. The metrics aren't wrong; the definitions drifted.
The fix is governance, not math: one written definition per metric, owned by RevOps, referenced by every dashboard. Tools like the HubSpot and Salesforce reporting layers will happily compute whatever you tell them to — garbage definitions in, garbage board deck out. See how Salesforce defines ARR and HubSpot's breakdown of recurring revenue for two reputable baselines to anchor your own.

How do ACV and ARR work together in a worked example?#
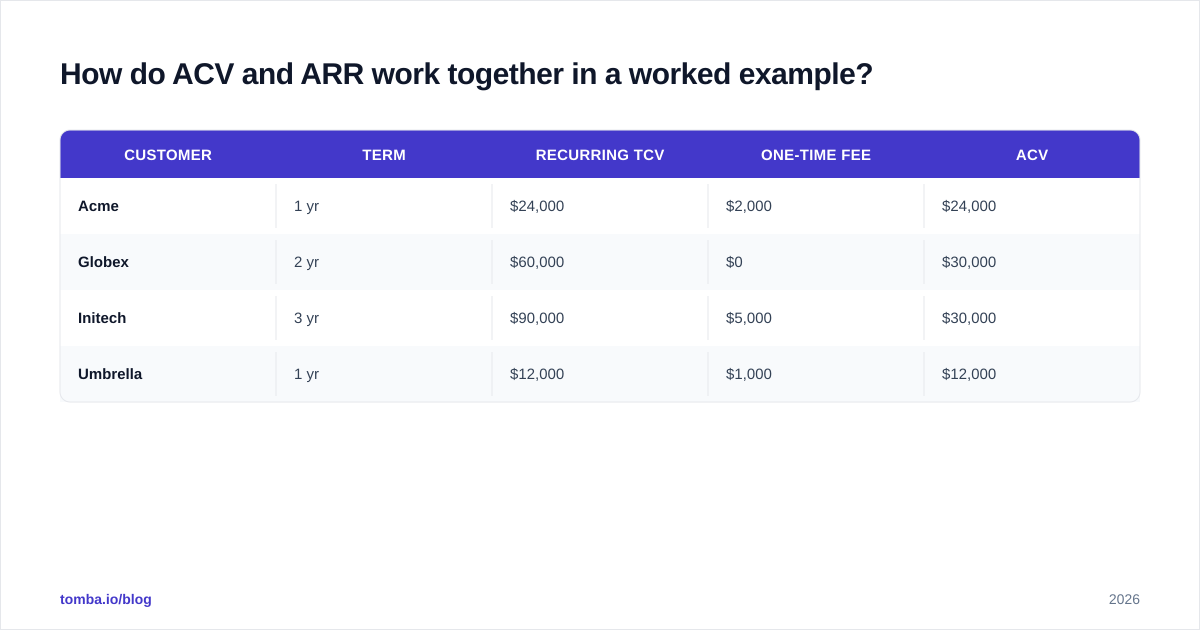
Imagine a SaaS company with four contracts signed this year:
| Customer | Term | Recurring TCV | One-time fee | ACV |
|---|---|---|---|---|
| Acme | 1 yr | $24,000 | $2,000 | $24,000 |
| Globex | 2 yr | $60,000 | $0 | $30,000 |
| Initech | 3 yr | $90,000 | $5,000 | $30,000 |
| Umbrella | 1 yr | $12,000 | $1,000 | $12,000 |
Average ACV = ($24,000 + $30,000 + $30,000 + $12,000) / 4 = $24,000.
ARR = sum of each contract's annual recurring revenue = $24,000 + $30,000 + $30,000 + $12,000 = $96,000.
Notice that in this snapshot ARR and total-of-ACV happen to match, because ACV is already annualized recurring revenue per contract. They line up here. They would not line up if you mistakenly added the one-time fees into one metric but not the other, or if you reported TCV ($186,000 recurring) as if it were ARR — a classic way to inflate the growth story by 90%.
This is also why blended averages can mislead. The $24,000 average ACV hides that half the book is $30K enterprise and a quarter is $12K SMB. Slice it and you get a real go-to-market signal; leave it blended and you get a number that's technically correct and strategically useless.
What metrics should you track alongside ACV and ARR?#
Neither metric is enough on its own. Pair them with:
- Net Revenue Retention (NRR) — expansion minus churn against the ARR base. Below 100% means you're leaking faster than you're growing accounts.
- CAC payback — months to recover acquisition cost, driven by ACV and margin.
- Win rate — your sales win rate tells you how much pipeline it takes to hit an ARR target.
- TCV (total contract value) — the full, non-annualized commitment; useful for cash and multi-year forecasting, dangerous if confused with ARR.
- Logo vs revenue churn — losing small-ACV logos hurts less than losing enterprise ARR.
The healthy operating rhythm: ARR sets the destination, ACV and segmentation map the route, and retention metrics tell you whether the bucket leaks. Strong pipeline and process discipline upstream is what keeps all three honest — because every one of these numbers is only as good as the contact and account data feeding your CRM.
How does data quality affect your ACV and ARR reporting?#
This is the part most metric guides skip: your ACV and ARR are only as trustworthy as the pipeline that produced them. If reps are chasing unqualified accounts or wrong contacts, your deal sizes skew, your segmentation blurs, and the averages stop meaning anything.
Clean, well-targeted prospecting is the upstream fix. When your top-of-funnel actually reaches decision-makers at the right-fit accounts, ACV by segment stabilizes and ARR forecasts get more reliable. That's where accurate contact data earns its keep — fewer bounced sequences, more conversations with people who can actually sign a contract.
If your sales team is burning cycles hunting for verified work emails before they can even start a conversation, that's friction sitting directly upstream of every ACV and ARR number you report. Tomba's Email Finder pulls verified, professional email addresses by name, company, or domain search, so your reps spend time closing deals instead of guessing addresses — and your revenue metrics rest on a cleaner foundation. Start free with 25 searches a month, or scale into a paid plan from $49/mo; see full Tomba pricing to match a tier to your team size. Better data in, more honest ACV and ARR out.
Get the Tomba newsletter
Practical outbound tactics and product updates — once every two weeks.
About the author