Addressable Market in 2026: TAM, SAM & SOM Explained
Your addressable market is the difference between a forecast investors trust and a number you made up. Here's how to size TAM, SAM, and SOM with real data in 2026.
Most "addressable market" slides are fiction. Someone multiplied a giant industry number by a price and called it a strategy. Investors see through it, and so does your own sales team when the pipeline never materializes.
This guide fixes that. You will learn what addressable market actually means, how TAM, SAM, and SOM differ, the two ways to calculate each, and how to ground every number in real account data instead of a hopeful guess.
TL;DR#
- Addressable market is the total revenue opportunity available for a product or service — usually broken into TAM (total), SAM (serviceable), and SOM (obtainable).
- TAM is everyone who could theoretically buy; SAM is the slice you can actually serve; SOM is the slice you can realistically win in a set timeframe.
- Use top-down (industry reports) and bottom-up (count real accounts × price) together. Bottom-up is what investors and boards trust.
- A credible model starts with a clean list of target accounts and contacts — that is where a tool like a domain search and verified contact data turns a guess into a forecast.
- Recalculate at least annually. Markets, ICPs, and pricing shift, and a stale addressable market number quietly distorts every downstream plan.
What is an addressable market?#
Your addressable market is the total amount of revenue available if you sold to every customer who could realistically buy what you offer. Think of it like fishing: the ocean is enormous, but you only fish the waters where your boat can reach, your license allows, and your target species actually lives. The ocean is not your market. The reachable, stocked waters are.
In practice the term splits into three nested layers — TAM, SAM, and SOM — because "everyone on earth" and "who we'll close next year" are wildly different numbers, and conflating them is how pitch decks lose credibility.
Getting this right matters beyond fundraising. Your addressable market drives territory design, quota setting, hiring plans, and product roadmap priorities. Inflate it and you over-hire and miss targets. Underestimate it and you leave growth on the table or get out-invested by a competitor who sized the opportunity correctly.

What is the difference between TAM, SAM, and SOM?#
The three terms describe progressively narrower circles. Each one answers a different question.
- TAM (Total Addressable Market): If every possible buyer purchased your category, how big is the revenue pool? This ignores competition and your operational limits.
- SAM (Serviceable Addressable Market): Of that TAM, which segment can you actually serve given your product, geography, language, compliance, and pricing? This is your realistic target universe.
- SOM (Serviceable Obtainable Market): Of that SAM, how much can you capture in a defined period given your sales capacity, brand, and competition? This is your near-term revenue ceiling.
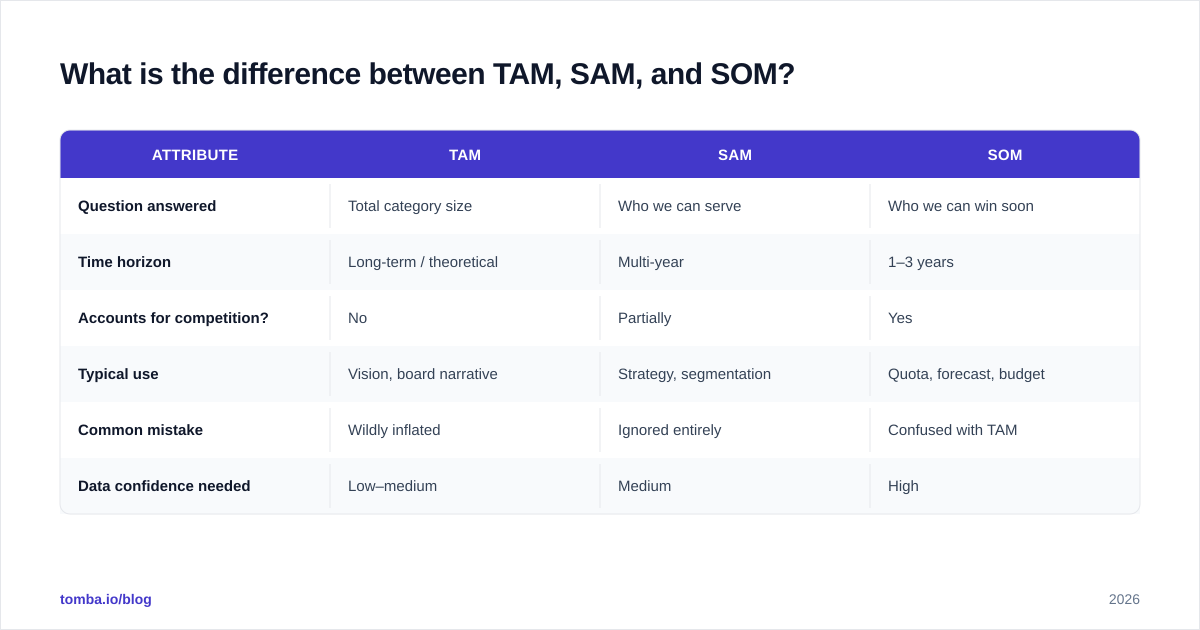
Here is how the three compare on the attributes that matter when you build the model.
| Attribute | TAM | SAM | SOM |
|---|---|---|---|
| Question answered | Total category size | Who we can serve | Who we can win soon |
| Time horizon | Long-term / theoretical | Multi-year | 1–3 years |
| Accounts for competition? | No | Partially | Yes |
| Typical use | Vision, board narrative | Strategy, segmentation | Quota, forecast, budget |
| Common mistake | Wildly inflated | Ignored entirely | Confused with TAM |
| Data confidence needed | Low–medium | Medium | High |
A simple rule: TAM inspires, SAM focuses, and SOM is the number you are actually accountable for. When a VC asks for your addressable market, they want all three — but they scrutinize SOM.

How do you calculate addressable market?#
There are two methods, and serious operators use both as a cross-check.
Top-down method#
You start with a large published figure and narrow it with percentages.
- Find total industry or category revenue from a research source like Gartner or an analyst report.
- Apply filters: the percentage in your geography, your segment, your price tier.
- The remaining number approximates your SAM, and a market-share assumption gives SOM.
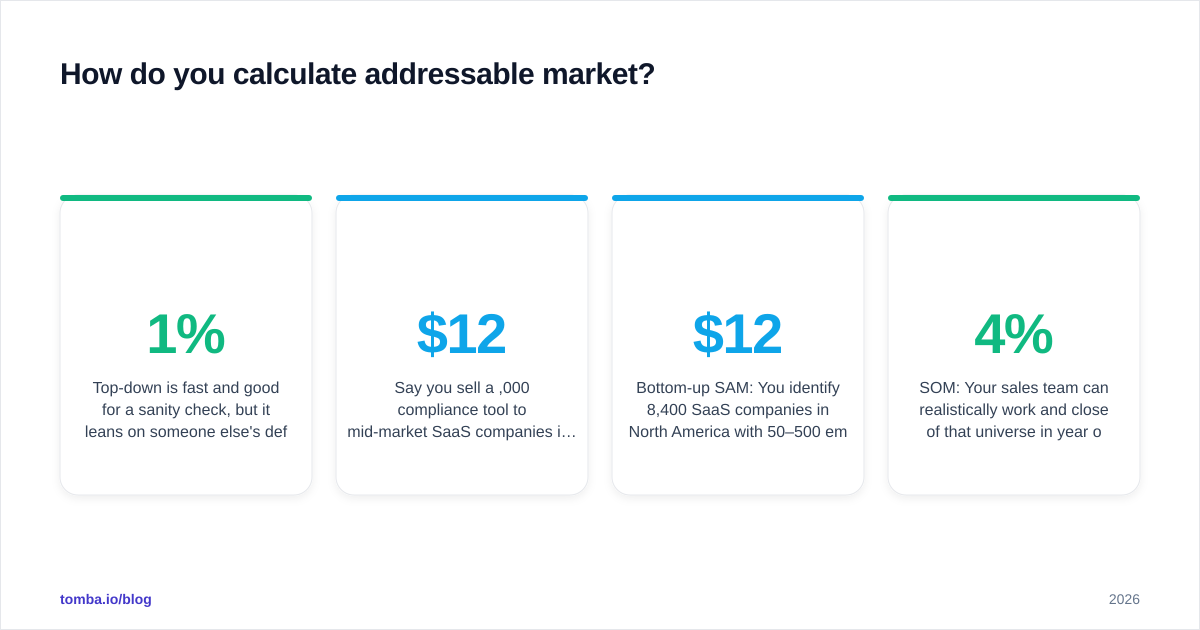
Top-down is fast and good for a sanity check, but it leans on someone else's definitions. The classic failure is "1% of a $50B market = $500M, easy." Boards have seen that slide a thousand times and discount it on sight.
Bottom-up method#
You build the number from real units.
- Count the actual accounts that fit your ideal customer profile (ICP).
- Multiply by your average contract value (ACV) or expected annual revenue per account.
- That product is your SAM; apply a realistic win/penetration rate for SOM.
The formula looks like this:
SAM = (number of ICP-fit accounts) × (average annual revenue per account)
SOM = SAM × (realistic penetration rate over the period)
Bottom-up is more work but far more defensible, because every input traces back to something you can show: a list of named companies, a price, and a conversion assumption you can defend with historical data. This is the method that turns an addressable market claim into a forecast people trust.
Worked B2B example#
Say you sell a $12,000/year compliance tool to mid-market SaaS companies in North America.
- Bottom-up SAM: You identify 8,400 SaaS companies in North America with 50–500 employees that match your ICP. 8,400 × $12,000 = $100.8M SAM.
- SOM: Your sales team can realistically work and close 4% of that universe in year one given capacity and competition. $100.8M × 4% = ~$4M SOM.
- TAM: Globally, including segments you cannot serve yet, the category is roughly $2.3B (top-down from an analyst report).
Notice the SOM — the number you will defend in a board meeting — came entirely from counting real accounts, not from multiplying a fantasy.
Where do you get the data to size your market?#
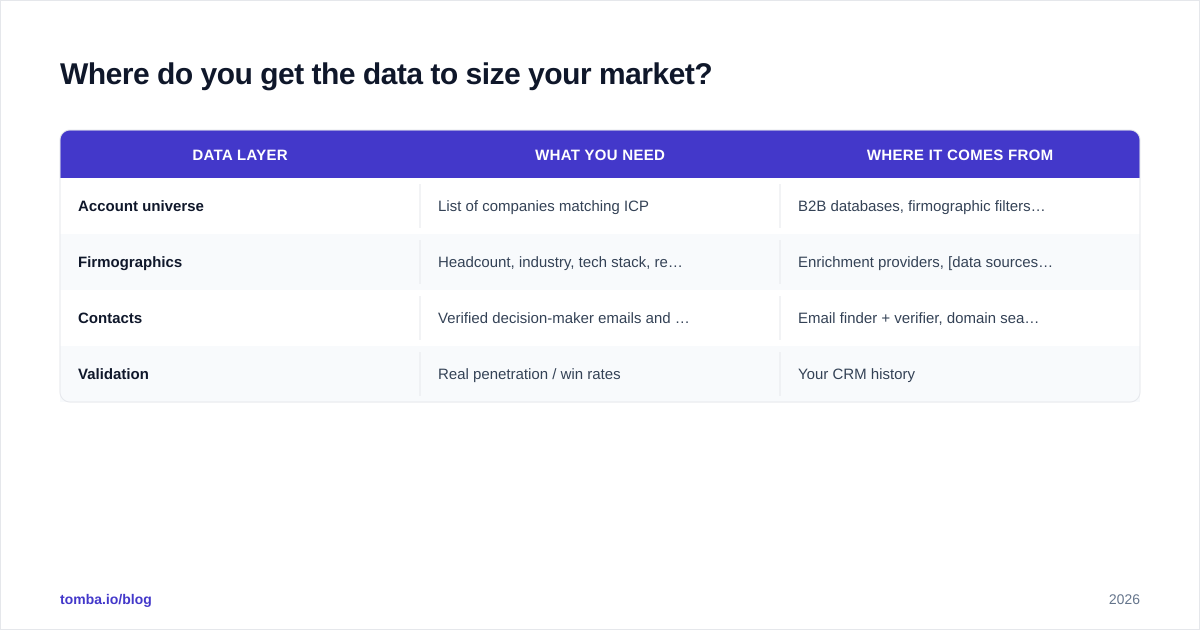
This is where most models break. The math is trivial; the inputs are the hard part. You need three things: an account universe, accurate firmographics, and reachable contacts.
| Data layer | What you need | Where it comes from |
|---|---|---|
| Account universe | List of companies matching ICP | B2B databases, firmographic filters, lists |
| Firmographics | Headcount, industry, tech stack, revenue band | Enrichment providers, data sources |
| Contacts | Verified decision-maker emails and roles | Email finder + verifier, domain search |
| Validation | Real penetration / win rates | Your CRM history |
For the bottom-up count, you are effectively building a target account list and then enriching it until you can confidently say "this company fits, and here is who we'd sell to." A B2B database with firmographic filters lets you size the universe, and an email finder plus email verifier confirms those accounts are reachable — which is the difference between a theoretical SAM and a workable one.
A practical tip: validate your penetration assumptions against your own win rate data. If you historically close 6% of qualified mid-market accounts, do not model SOM at 20% because the slide looks better.

Why do addressable market estimates go wrong?#
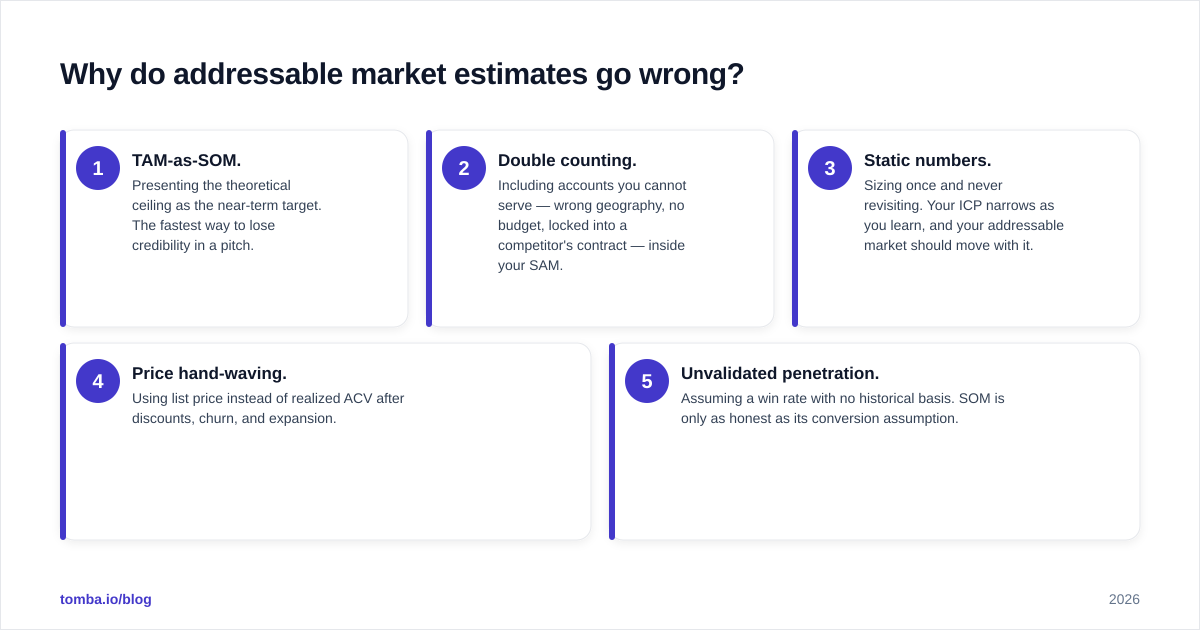
Five mistakes account for nearly every bad model.
- TAM-as-SOM. Presenting the theoretical ceiling as the near-term target. The fastest way to lose credibility in a pitch.
- Double counting. Including accounts you cannot serve — wrong geography, no budget, locked into a competitor's contract — inside your SAM.
- Static numbers. Sizing once and never revisiting. Your ICP narrows as you learn, and your addressable market should move with it.
- Price hand-waving. Using list price instead of realized ACV after discounts, churn, and expansion.
- Unvalidated penetration. Assuming a win rate with no historical basis. SOM is only as honest as its conversion assumption.
HubSpot's research team and most go-to-market frameworks stress the same point: a market size is a hypothesis, not a fact. Treat it like one and pressure-test the inputs.
How does addressable market connect to your GTM motion?#
Sizing is not an academic exercise — it directly shapes execution. This is where revenue operations earns its keep.
- Territory design: SAM divided by rep capacity tells you how many territories and reps you need.
- Quota setting: SOM divided across the team is the foundation for fair, achievable quotas.
- Segmentation: A well-sized SAM reveals which sub-segments are dense enough to warrant a dedicated play.
- Forecasting: SOM is the upper bound on what your pipeline can produce this year. If your forecast exceeds SOM, one of them is wrong.

The teams that win are the ones that treat the addressable market model as a living operational tool, not a one-time deck slide. They refresh the account list quarterly, re-verify contact reachability, and adjust SOM as real win rates come in.
How often should you recalculate your addressable market?#
At minimum once a year, and more often when something material shifts. Trigger a recalculation when you:
- Launch a new product or move up/down market
- Enter a new geography or vertical
- Change pricing or packaging
- See your ICP sharpen after a year of closed-won/closed-lost data
- Watch a competitor reshape the category
Markets are not static, and a stale number is worse than no number because it carries false confidence. The cost of recalculating is a day of analyst time; the cost of operating on a wrong addressable market is a year of misallocated budget.
Frequently asked questions#
Is addressable market the same as market size? Not quite. Market size usually refers to TAM — the whole category. Addressable market is the broader concept that includes the narrower, more useful SAM and SOM layers you can actually act on.
Which number do investors care about most? They want to see all three, but they scrutinize SOM and the logic connecting it to SAM. A huge TAM with a hand-waved SOM is a red flag, not a selling point.
Can a startup do bottom-up sizing with no sales history? Yes. Use comparable companies' published conversion benchmarks for your penetration assumption, count your ICP accounts directly, and label the assumptions clearly. Honesty about uncertainty beats false precision.
How granular should the account list be? Granular enough to name companies and identify the buying roles. If you can export a list of target accounts with verified decision-maker contacts, your SAM is real. If you only have a percentage of an industry figure, it is still a guess.
Build your addressable market on real accounts, not guesses#
A credible addressable market lives or dies on the quality of the account list and contact data underneath it. You can have perfect formulas, but if you cannot point to named, reachable accounts, your SOM is just an opinion.
That is exactly where Tomba's Email Finder fits. Pair it with domain search and verification to turn an ICP definition into a counted, reachable universe of accounts and decision-makers — the bottom-up foundation that makes your TAM, SAM, and SOM defensible. Start free with 25 searches a month, and when you are sizing at scale, the Starter plan at $49/mo and bulk tools take it from there. Size the market you can actually win, then go win it.
Get the Tomba newsletter
Practical outbound tactics and product updates — once every two weeks.
About the author