Addressable Markets: How to Size TAM, SAM & SOM in 2026
Stop pulling market size numbers from thin air. Learn how to size your addressable markets with TAM, SAM, and SOM math that survives a board meeting in 2026.
TL;DR
- Your addressable market is three nested numbers, not one: TAM (everyone who could ever buy), SAM (the slice you actually serve), and SOM (the slice you can realistically win).
- Top-down sizing from analyst reports is fast but easy to inflate. Bottom-up sizing from real account counts is slower, defensible, and the only version a serious investor or board trusts.
- The hardest part is not the multiplication — it's getting an accurate count of qualifying accounts and contacts. That's a data problem, not a math problem.
- A credible SOM for a new B2B product is usually 1–5% of SAM in years one to three, not the 10%+ founders love to pitch.
- Re-size annually. Markets move, your ICP tightens, and stale numbers quietly mislead every GTM decision downstream.
What are addressable markets?#
Addressable markets are the layered measure of how much revenue your product could capture — first in theory, then in practice. Think of it like fishing. The whole ocean is your total opportunity, the lakes you can legally fish are the part you can actually reach, and the fish you'll land this season given your boat and crew is what you'll really take home. Each layer is smaller and more honest than the one above it.
In B2B, these three layers have standard names:
- TAM (Total Addressable Market): total annual revenue available if every possible buyer bought from someone in your category.
- SAM (Serviceable Addressable Market): the portion of TAM your product, pricing, geography, and compliance posture can actually serve.
- SOM (Serviceable Obtainable Market): the portion of SAM you can realistically win given your team, budget, and competition.
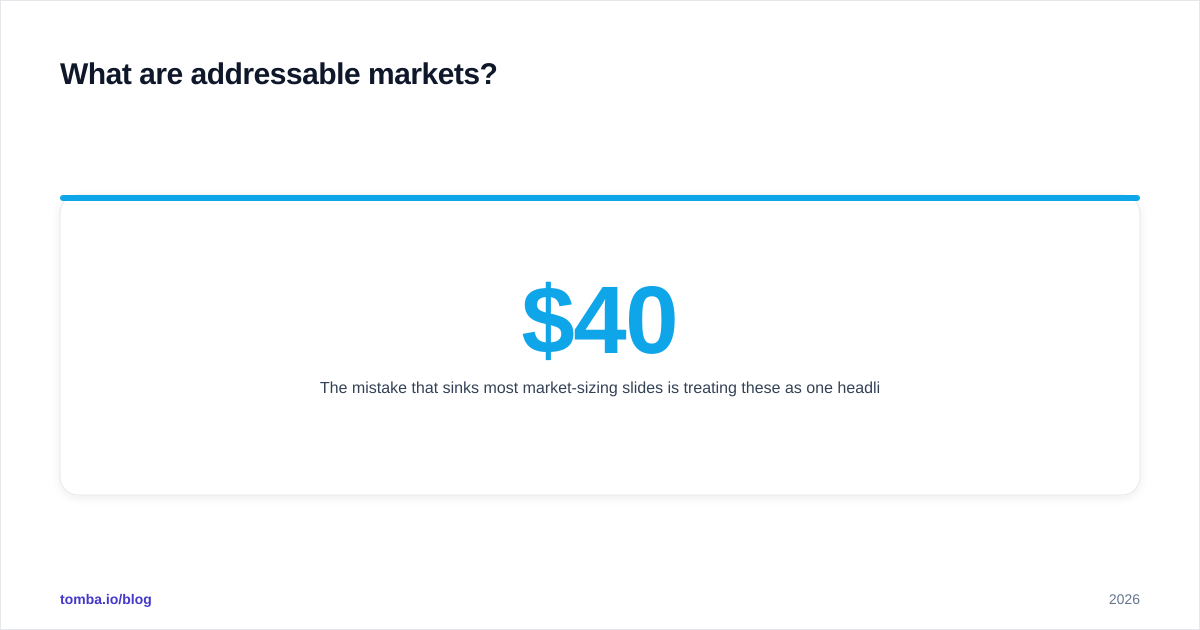
The mistake that sinks most market-sizing slides is treating these as one headline number. A $40B TAM means nothing if your SAM is $300M and your three-year SOM is $9M. Investors and boards read all three — and they read the gap between them as a proxy for how well you understand your own business.

Why do addressable markets matter for GTM?#
Because nearly every go-to-market decision is secretly a market-sizing decision. Your sales headcount plan assumes a certain number of winnable accounts. Your pipeline targets assume a certain conversion off a certain pool. Your pricing assumes a certain willingness-to-pay across a defined segment. Get the addressable market wrong and every one of those plans inherits the error.
A well-built model does three concrete things for a revenue team:
- Sets a ceiling for forecasts. If your SOM is $12M and sales is forecasting $20M, someone is dreaming.
- Prioritizes segments. When you size SAM by sub-segment, you can see which verticals are worth a dedicated play and which are noise.
- Justifies spend. A defensible TAM-to-SOM ladder is what unlocks the next funding round or the next headcount approval.
This is core revenue operations work. RevOps owns the single source of truth for how big the opportunity is and how fast it's being captured — and that truth has to be rebuilt on data, not vibes.

How do you calculate TAM, SAM, and SOM?#
There are two roads up the mountain: top-down and bottom-up. Strong models use both and reconcile them.
Top-down starts with a big published number and cuts it down with assumptions. Analyst firms such as Gartner and Forrester publish category revenue estimates you can use as an anchor.
Example: Category revenue is $30B globally. You only sell in North America (~35% of spend) and only to mid-market (~40% of that). Top-down SAM ≈ $30B × 0.35 × 0.40 = $4.2B.
Bottom-up starts from the unit and builds up. It's slower but far harder to argue with because every input is a thing you can verify.
Bottom-up formula:
TAM = (number of qualifying accounts) × (average annual contract value)
Example: 48,000 companies match your industry and size criteria. Your average contract is $14,000/year. Bottom-up TAM = 48,000 × $14,000 = $672M. Apply your serviceable filters (geography, tech stack, compliance) to get SAM, then apply a realistic capture rate to get SOM.
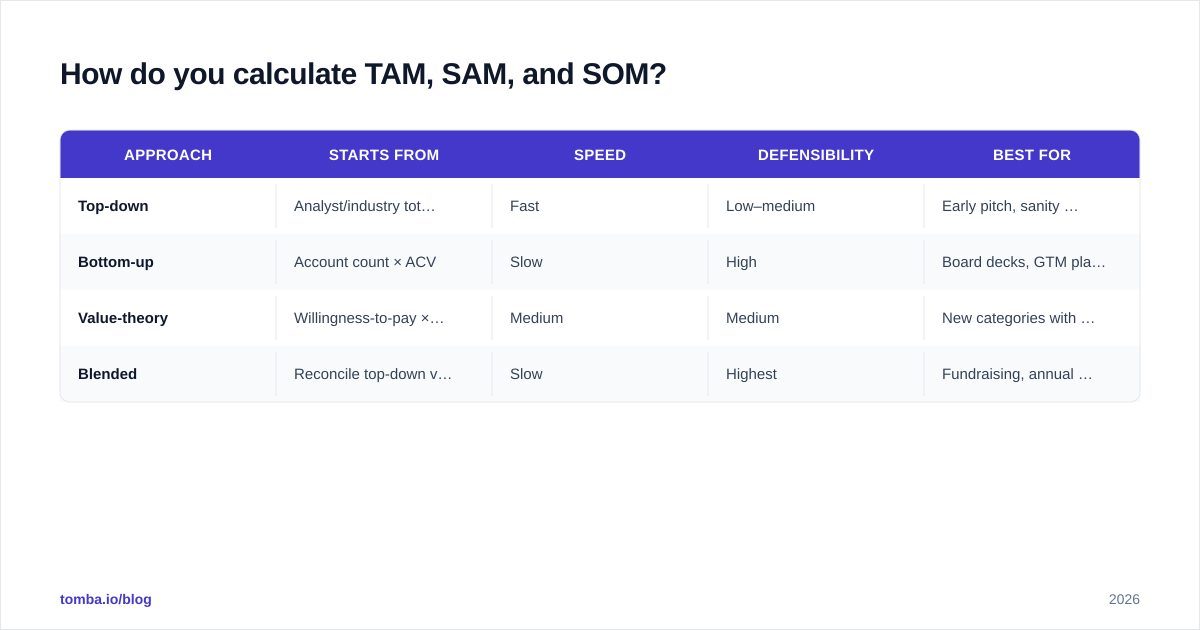
| Approach | Starts from | Speed | Defensibility | Best for |
|---|---|---|---|---|
| Top-down | Analyst/industry totals | Fast | Low–medium | Early pitch, sanity check |
| Bottom-up | Account count × ACV | Slow | High | Board decks, GTM planning |
| Value-theory | Willingness-to-pay × buyers | Medium | Medium | New categories with no comp |
| Blended | Reconcile top-down vs bottom-up | Slow | Highest | Fundraising, annual planning |
When your top-down and bottom-up numbers land within ~20% of each other, you have a model people will trust. When they're 5x apart, you've found a bad assumption — go fix it before you present.
What's a realistic SOM (and how do you avoid fantasy math)?#
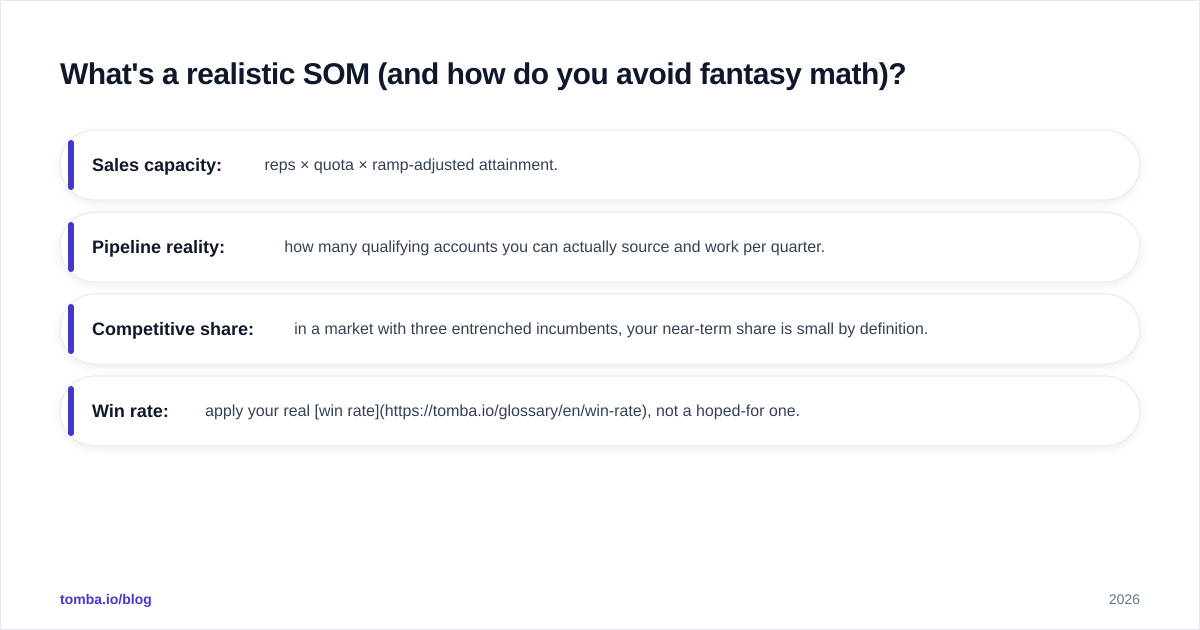
A realistic SOM is grounded in your actual capacity to sell, not your ambition. The fastest way to lose a room is a slide claiming you'll take 15% of a market in year two. For most new B2B products, a credible three-year SOM is 1–5% of SAM, climbing as brand, channel, and product mature.
Build SOM from constraints you control:
- Sales capacity: reps × quota × ramp-adjusted attainment.
- Pipeline reality: how many qualifying accounts you can actually source and work per quarter.
- Competitive share: in a market with three entrenched incumbents, your near-term share is small by definition.
- Win rate: apply your real win rate, not a hoped-for one.
If your bottom-up SOM and your capacity-based SOM disagree, the smaller number is usually the honest one. Boards reward conservative models that you then beat — not aggressive ones you miss.
Where does the data come from?#
This is where most addressable-market models quietly break. The arithmetic is trivial; the account and contact counts are the hard, expensive part. A TAM built on a guessed account count is a guess with a dollar sign in front of it.
To size bottom-up well, you need an accurate count of companies that match your ideal customer profile — by industry, employee band, geography, and tech stack — and a way to reach the buyers inside them. That's a B2B data exercise:
- Define your ICP filters precisely (NAICS/industry, headcount range, region, technologies used).
- Pull a real account count from a B2B database instead of estimating.
- Enrich each account with firmographics so you can segment SAM by sub-vertical. Tools that enrich leads turn a raw list into a model you can slice.
- Validate reachability — how many of those accounts can you actually contact? If you can find email addresses for only 40% of a segment, your effective SOM in that segment is lower than the raw count implies.
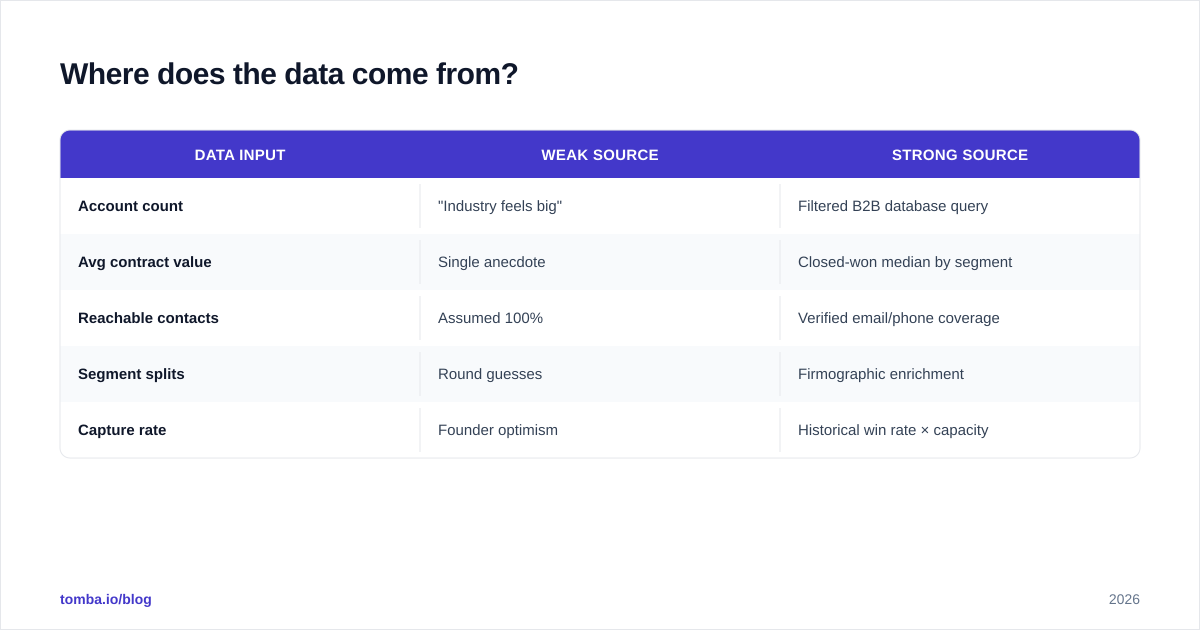
| Data input | Weak source | Strong source |
|---|---|---|
| Account count | "Industry feels big" | Filtered B2B database query |
| Avg contract value | Single anecdote | Closed-won median by segment |
| Reachable contacts | Assumed 100% | Verified email/phone coverage |
| Segment splits | Round guesses | Firmographic enrichment |
| Capture rate | Founder optimism | Historical win rate × capacity |
Public references like HubSpot's market research resources and the underlying definitions on Wikipedia's market sizing entry are fine for framing — but your competitive edge comes from proprietary, verified account data that competitors haven't bothered to assemble.

How often should you re-size your addressable markets?#
At least once a year, and immediately after any of these events: a pricing change, an ICP shift, a new product line, entry into a new geography, or a major competitor move. Addressable markets are not a one-time slide you build for a pitch and forget. They're a living model that should sit next to your annual plan.
A practical cadence:
- Quarterly: refresh account counts and reachable-contact coverage as your data improves.
- Annually: rebuild SAM and SOM from scratch alongside planning, reconciling top-down and bottom-up.
- Event-driven: re-size whenever a strategic input changes materially.
The teams that win don't have bigger TAMs — they have tighter, truer ones they actually act on. A focused $400M SAM you understand cold beats a hand-wavy $50B TAM every time, because the focused number tells your reps exactly which accounts to work.
Common mistakes to avoid#
- Headline-only sizing. Presenting TAM without SAM and SOM signals you haven't done the work.
- Double-counting buyers. If one parent company owns ten subsidiaries you'd sell to once, count it once.
- Stale ACV. Using last year's average contract value after a price change inflates everything.
- Ignoring reachability. A market you can't contact isn't addressable in any real sense.
- Static models. A number you set once and never revisit decays silently and misleads quietly.
Putting it to work#
Sizing your addressable markets well is mostly a data discipline: define the ICP, count the real accounts, enrich and segment them, and confirm you can actually reach the buyers inside. The math is the easy 10%; the verified inputs are the other 90%.
That last mile — turning a list of qualifying companies into reachable, contactable buyers — is exactly what the Tomba Email Finder is built for. Pair it with Tomba's domain search and data enrichment to convert your SAM from a spreadsheet abstraction into a working target account list, then validate coverage so your SOM reflects who you can truly reach. Start free with 25 searches a month, and check the Tomba pricing tiers when you're ready to size and work an entire segment. Build the model on real accounts, and every GTM decision downstream gets sharper.
Get the Tomba newsletter
Practical outbound tactics and product updates — once every two weeks.
About the author