Account Based Marketing Measurement: The 2026 Metrics Playbook
Most ABM dashboards measure activity, not revenue. Here's how to build account based marketing measurement that ties spend to closed-won pipeline in 2026.
TL;DR#
- Account based marketing measurement fails when teams track MQLs, opens, and clicks instead of account-level engagement, pipeline, and revenue.
- The four-tier ABM funnel (target → engaged → 6QA → opportunity) is the only structure that survives a CFO review.
- Match-rate, account engagement minutes, and pipeline velocity are the three metrics that actually predict ABM ROI.
- Attribution should be account-based and multi-touch, not lead-based. First-touch attribution will kill your ABM program.
- Without clean firmographic and contact data, every measurement layer above breaks. Fix data hygiene before you fix dashboards.
You spent six figures on an ABM platform, a content studio, and paid LinkedIn. Your CMO wants to know what it returned. You open the dashboard and see "engagement score 78." That number means nothing to a CFO.
This guide walks through the metrics, frameworks, and benchmarks that turn account based marketing measurement from a vanity report into a forecast input. We'll cover what to track at each funnel stage, how to attribute revenue without lying to yourself, and where most teams break.
What is account based marketing measurement?#
Account based marketing measurement is the discipline of evaluating ABM programs at the account level, not the lead level — measuring how target accounts move through awareness, engagement, opportunity, and closed-won revenue stages over time.
The shift sounds subtle. It is not. Traditional demand-gen measurement counts MQLs: one person fills a form, you get a lead, you score it. ABM measurement asks a different question: are the accounts on our target list showing buying signals across multiple stakeholders?
A single VP of Engineering downloading your whitepaper is noise. Six people at the same Series C fintech downloading your whitepaper, attending a webinar, and visiting your pricing page in a 14-day window is a buying committee. Lead-based dashboards bury that signal. Account-based dashboards surface it.
Why do most ABM measurement programs fail?#
Three reasons, in order of frequency.
The team measures what the old MarTech stack measured. Marketo, HubSpot, and Pardot were built around the lead. Bolt ABM on top and you get ABM-flavored lead metrics: lead-to-MQL rate by account list, MQL-to-SQL rate by segment. None of that is account-based; it is lead-based with a target-list filter.
Engagement is treated as outcome. "Account engagement score went up 40%" feels good. It is not revenue. A score that does not statistically correlate with pipeline creation is a participation trophy.
Attribution is single-touch. First-touch and last-touch attribution penalize ABM by definition. ABM is a long, multi-stakeholder, multi-channel motion. If you credit only the demo-request form fill, you will conclude that ABM does not work — and you will be wrong about your own program.
What metrics actually matter for account based marketing measurement?#
Forget the 47-metric dashboards your vendor sales engineer demoed. There are three categories that matter and roughly a dozen metrics inside them. Everything else is supporting evidence.
Coverage metrics (the inputs)#
These tell you whether your program has the raw material to succeed.
- Target account list (TAL) coverage — what percentage of your TAL has at least 3 verified, in-role contacts? Below 70% and the rest of the funnel will be malnourished.
- Match rate — what percentage of inbound traffic, paid clicks, and content downloads can you tie back to a known target account? Below 30% means your reverse-IP and identity stack are leaking.
- Contact data freshness — what percentage of your TAL contacts have been verified in the last 90 days? Email decay is roughly 22.5% per year, so this number degrades fast without active hygiene.
If TAL coverage is weak, the simplest unlock is pairing your firmographic source with an email finder and domain search to surface decision-makers at every account before any campaign launches.
Engagement metrics (the leading indicators)#
These predict whether accounts are warming.
- Engaged accounts — distinct accounts on the TAL with ≥1 meaningful interaction (content view ≥30s, ad click, event attendance, sales touch reply) in the rolling 30 days.
- Account engagement minutes (AEM) — total time spent across all known and anonymous contacts at an account. Tracked by Bombora, 6sense, and Demandbase. AEM ≥ 90 minutes in 30 days is a typical mid-market 6QA threshold.
- Buying group depth — number of distinct in-role personas engaged per account. Three or more is the threshold where deals start closing meaningfully faster (Gartner research).
- Intent surge — percentage of TAL accounts showing third-party intent spikes on your tracked keywords this week vs. the trailing four-week baseline.
Pipeline and revenue metrics (the outcomes)#
The numbers your CFO actually wants.
- 6QA → opportunity conversion — what percentage of accounts that hit your 6QA threshold convert to a sales opportunity within 30 days?
- ABM-sourced pipeline — dollar value of opportunities created where the account was on the TAL and had ≥1 ABM touch before opportunity creation.
- ABM-influenced pipeline — broader — any opportunity where ≥1 ABM touch occurred during the deal cycle. Always larger than sourced, always more debated.
- Average sales cycle (ABM vs. non-ABM) — should be 20–40% shorter for ABM-touched deals if the program is working.
- Average contract value (ABM vs. non-ABM) — should be 1.4–2.1x higher.
- ABM win rate — closed-won / total opportunities. ABM-touched deals typically win at 1.5–2x the rate of cold inbound.
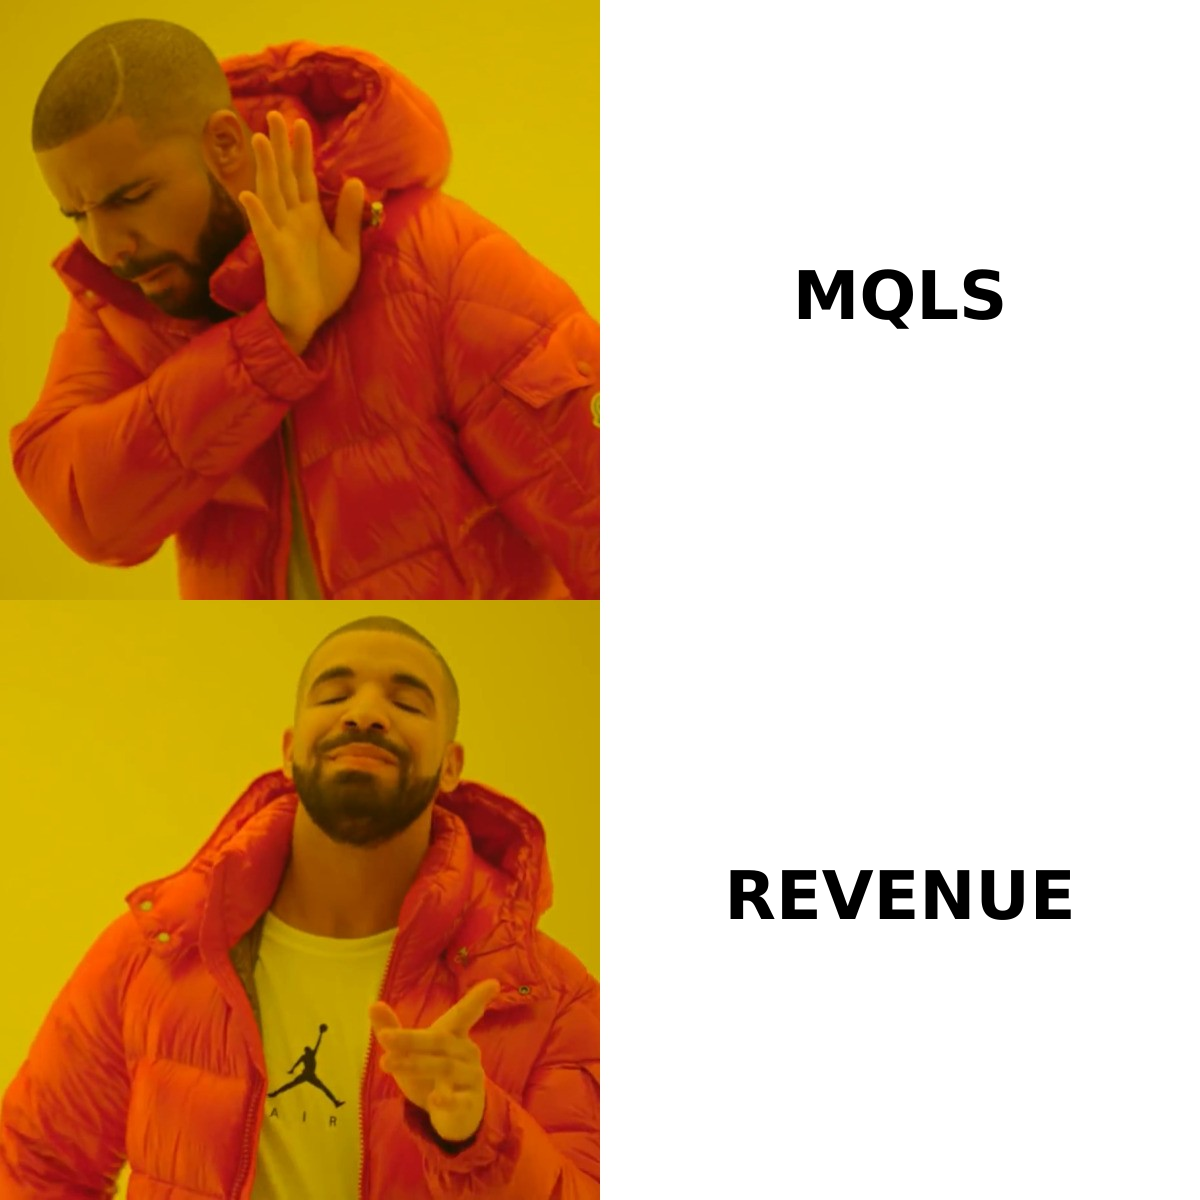
What does a 4-tier ABM funnel look like?#
Forget the awareness → consideration → decision funnel from your 2014 demand gen deck. ABM uses an account-based version of the same idea, and the stages are not interchangeable.
| Stage | Definition | Typical conversion to next stage | Owner |
|---|---|---|---|
| Target account | On the TAL, no engagement yet | 35–55% reach engaged in 90 days | Marketing |
| Engaged account | ≥1 meaningful interaction in last 30 days | 12–22% reach 6QA in 60 days | Marketing |
| 6QA (six-qualified account) | Hit engagement + intent threshold | 40–60% become opportunity in 30 days | Marketing → Sales |
| Opportunity | SDR/AE has confirmed pain + timeline | 22–35% close-won, varies by ACV | Sales |
The 6QA stage is where most programs break. Either the threshold is too lax (sales floods with garbage handoffs and stops trusting marketing) or too tight (marketing engages 800 accounts and only hands off 12). Calibrate it quarterly against actual close rates.
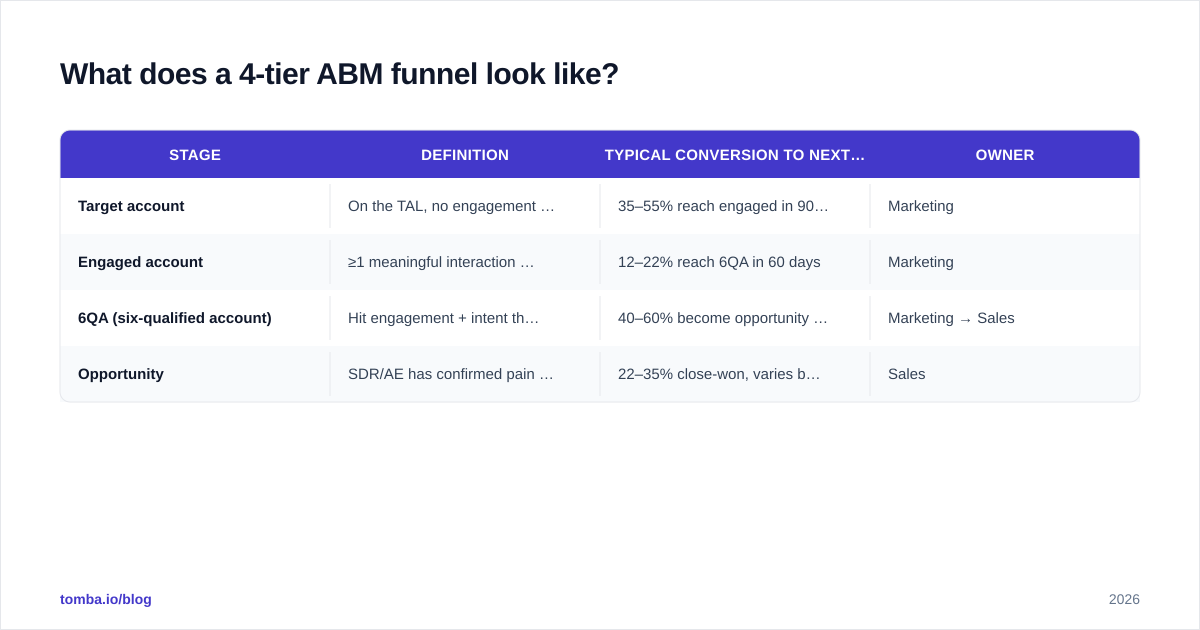
How should you attribute ABM revenue?#
Account-based, multi-touch, and weighted. Not first-touch. Not last-touch.
A defensible model assigns weighted credit to every touch in the deal cycle for the account, not just the lead. The W-shape works well: 30% to first touch, 30% to opportunity creation touch, 30% to closed-won touch, 10% distributed across all touches in between.
| Attribution model | Best for | Why it usually fails for ABM |
|---|---|---|
| First-touch | Top-of-funnel demand gen | Ignores 6+ months of nurture that ABM relies on |
| Last-touch | Transactional SaaS | Always credits the demo form, ignores the program that made the demo happen |
| Linear (equal split) | Simple multi-touch journeys | Treats a stray podcast click as equal to a CEO dinner |
| W-shape | ABM with clear opportunity stage | Honest weighting of journey peaks |
| Account-based markov | Sophisticated RevOps teams | Requires clean data and a data scientist; worth it if you have both |
The single biggest unlock is moving from lead-level attribution (credit assigned to whoever filled the form) to account-level attribution (credit assigned across every contact at that account). HubSpot, Salesforce, and Demandbase all support this if configured correctly. Most teams never configure it.
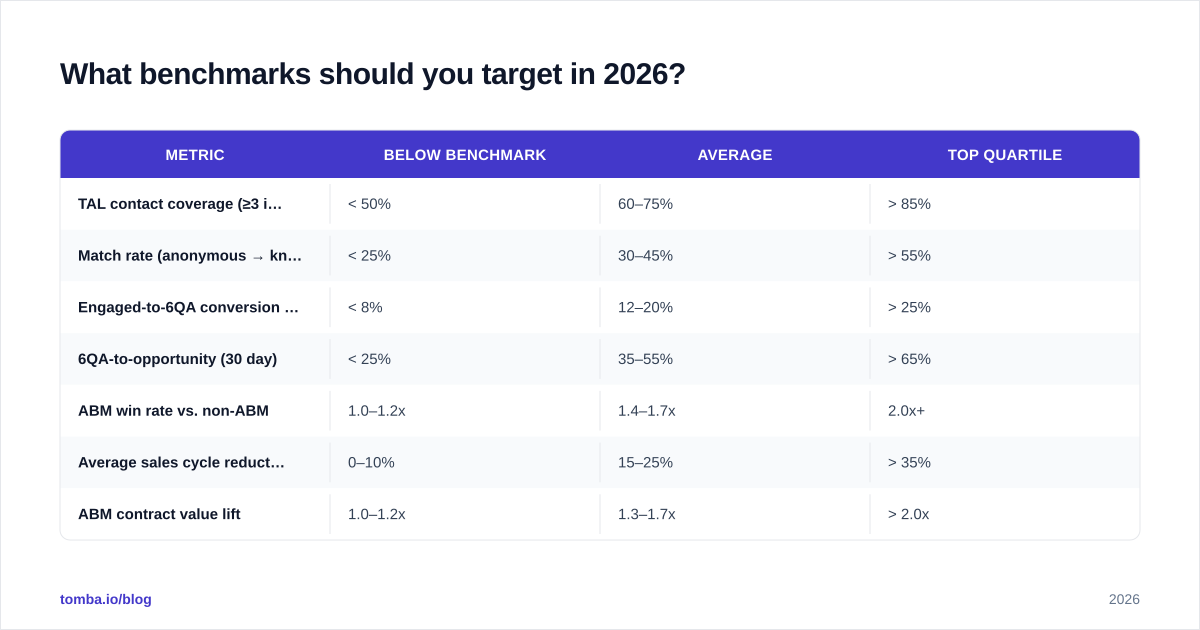
What benchmarks should you target in 2026?#
Anchor your dashboards to industry numbers, not aspirations. The 2025 ITSMA/Momentum ABM benchmark study and Forrester's ABM wave both converge on similar ranges.
| Metric | Below benchmark | Average | Top quartile |
|---|---|---|---|
| TAL contact coverage (≥3 in-role) | < 50% | 60–75% | > 85% |
| Match rate (anonymous → known) | < 25% | 30–45% | > 55% |
| Engaged-to-6QA conversion (90 day) | < 8% | 12–20% | > 25% |
| 6QA-to-opportunity (30 day) | < 25% | 35–55% | > 65% |
| ABM win rate vs. non-ABM | 1.0–1.2x | 1.4–1.7x | 2.0x+ |
| Average sales cycle reduction | 0–10% | 15–25% | > 35% |
| ABM contract value lift | 1.0–1.2x | 1.3–1.7x | > 2.0x |
If you sit in the "below benchmark" column on more than two rows, the problem is rarely the platform — it is the data, the TAL definition, or the sales handoff. Fix those before buying another tool. Industry analysts at Gartner and Forrester consistently rank data quality above platform features as the #1 driver of ABM performance.
How do you build the dashboard your CFO will actually trust?#
Three layers. Built in this order. Skip a layer and the next one lies.
Layer 1: data foundation#
This is unglamorous and non-negotiable.
- Single source of account truth. One row per account in your CRM. Deduped. Mapped to a single domain. If you cannot pass this check, stop here.
- Verified contact data. Each TAL account needs at least 3 verified, in-role contacts. Use an email verifier on every import. Catch-all domains need the catch-all verifier — they are 28% of B2B domains and silently destroy match rate.
- Identity resolution. Reverse-IP for known firms, fingerprinting for the rest. Document the match logic.
- Engagement ingestion. Ad clicks, web visits, content views, sales touches, intent — all written to an account-level table on a consistent schema.
Without this layer, the rest is theater.
Layer 2: account funnel and scoring#
- One scoring model, owned jointly by marketing and sales, recalibrated every quarter against closed-won data.
- Clear, documented 6QA threshold — a specific number, not "high engagement."
- SLA between marketing and sales for 6QA handoff (24-48 hours is standard).
- Weekly review of 6QA → opportunity conversion. If it drops below 25%, the threshold or the handoff process is broken.
Layer 3: revenue attribution#
- W-shape or equivalent multi-touch model implemented at the account level.
- ABM-sourced vs. ABM-influenced pipeline tracked separately.
- Cohort view: TAL accounts onboarded in Q1 reviewed at Q3 and Q4 for cumulative pipeline. ABM cycles are long. Snapshot dashboards hide that truth.
What tools and data sources do you need?#
ABM measurement is a stack problem. The platform layer (6sense, Demandbase, RollWorks) handles intent and orchestration. The CRM layer (Salesforce, HubSpot) handles opportunity and revenue. The data layer is where most teams under-invest — and where measurement breaks.
| Layer | Function | Examples |
|---|---|---|
| Firmographics + TAL | Build and refresh the target list | Apollo,ZoomInfo, Crunchbase, Tomba database |
| Contact data + verification | Find and verify decision-makers at every TAL account | Tomba, Apollo, G2's email finder category |
| Intent + engagement | Third-party intent, account-level web activity | 6sense, Bombora, Demandbase |
| Orchestration | Run plays across channels | Demandbase, RollWorks, Mutiny |
| CRM + attribution | Pipeline, opportunity, revenue | Salesforce, HubSpot Marketing Hub |
| BI + dashboard | The view your CFO sees | Looker, Hex, Tableau |
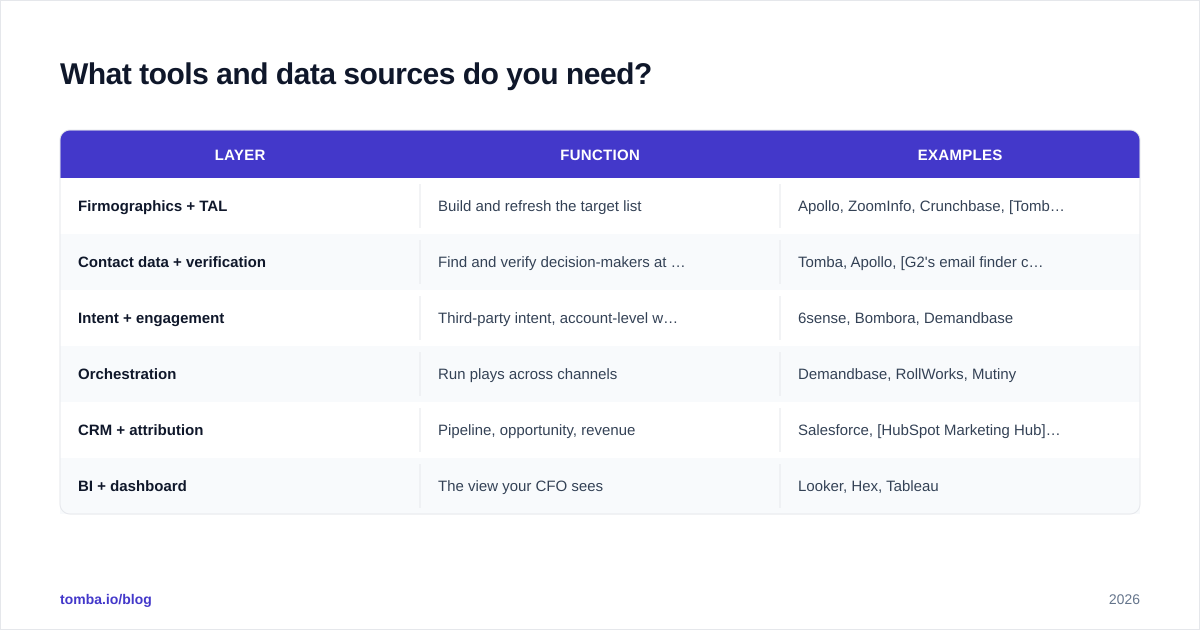
A surprising number of ABM teams skip the contact data + verification layer entirely. They assume the platform has it. The platform does not — or has it at the firmographic level only. That is why match rate stays at 22% and the buying-group-depth metric never crosses 1.4 personas per account. Fix that layer with a purpose-built bulk email finder plus ongoing verification, and the rest of the metrics quietly improve.
What about pipeline velocity and deal acceleration?#
These are the metrics that justify ABM spend to a skeptical CFO, and they are usually missing from ABM dashboards.
Pipeline velocity = (number of opportunities × average deal size × win rate) / sales cycle length.
ABM should move all four variables in your favor — more opps at higher ACV, higher win rate, shorter cycle. Track velocity for ABM-touched deals vs. non-ABM deals as a single composite number. If ABM velocity is not at least 1.6x non-ABM velocity within 12 months, the program needs surgery, not more budget.
Deal acceleration = days from opportunity creation to closed-won, ABM cohort vs. control. A 20–35% acceleration is realistic and defensible.
These two numbers, side by side, turn ABM from a marketing line item into a revenue lever the board understands.
How do you avoid measuring the wrong thing?#
A quick gut check. If any of these are true, the program is measuring activity, not outcome:
- The headline ABM metric in your QBR is "engagement score" with no dollar value attached.
- You report MQLs by account list and call it ABM measurement.
- First-touch attribution is still credited to the form fill.
- TAL contacts have not been re-verified in the last six months.
- Sales cannot articulate the 6QA threshold without looking it up.
- "ABM-influenced pipeline" is reported, "ABM-sourced pipeline" is not.
Fix each one in order. The fixes are not glamorous — they are mostly data hygiene, joint marketing/sales ritual, and refusing to ship a dashboard until the numbers reconcile to the CRM.
Closing thought#
Account based marketing measurement is a data problem dressed as a dashboard problem. Teams buy ABM platforms expecting them to produce the answer. The platforms produce a chart; the answer comes from the data feeding the chart. Get the foundation right — verified contacts at every TAL account, a single source of account truth, account-level attribution — and the metrics start telling the story you actually want to tell.
If your TAL has gaps or your buying-group-depth metric is stuck at 1.x personas per account, start with the contact layer. Tomba's email finder and data enrichment are built to fill exactly this gap — verified, in-role contacts at every target account, so the rest of your ABM measurement stack has something honest to measure. Try it free at tomba.io/email-finder.
Get the Tomba newsletter
Practical outbound tactics and product updates — once every two weeks.
About the author