Account Executive KPIs: The 2026 Metrics That Matter
The account executive KPIs that actually predict revenue in 2026 — which to track, which to ignore, and the benchmarks that separate top reps from the pack.
TL;DR
- The account executive KPIs that matter in 2026 fall into three buckets: activity, pipeline health, and outcomes — and most teams over-index on the first while ignoring the third.
- Win rate, quota attainment, sales cycle length, and average deal size are the four outcome metrics that actually predict revenue.
- Vanity metrics (raw call volume, emails sent) tell you almost nothing without conversion context.
- A good AE scorecard has 6–10 KPIs, not 25. More metrics dilute focus and hide the two or three that move the number.
- Clean contact data feeds every one of these metrics — bad data inflates activity and silently kills conversion.
What are account executive KPIs?#
Account executive KPIs are the quantified signals that tell you whether a closing rep is on track to hit quota — and, more importantly, why they are or aren't. Think of them like the gauges on a car dashboard. Speed (revenue closed) is the one everyone watches, but fuel level (pipeline coverage), engine temperature (sales cycle), and RPM (activity) are what tell you whether you'll actually finish the trip.
An account executive (AE) sits at the closing end of the funnel. Unlike an SDR who books meetings, the AE owns deals from qualified opportunity through signed contract. So their KPIs measure conversion and revenue efficiency, not just top-of-funnel motion. The distinction matters because copying SDR metrics onto an AE scorecard is one of the most common mistakes sales managers make.
The right set of metrics does three jobs at once: it forecasts the number, it diagnoses where deals leak, and it coaches the rep. If a KPI does none of those, drop it.

Which account executive KPIs actually matter in 2026?#
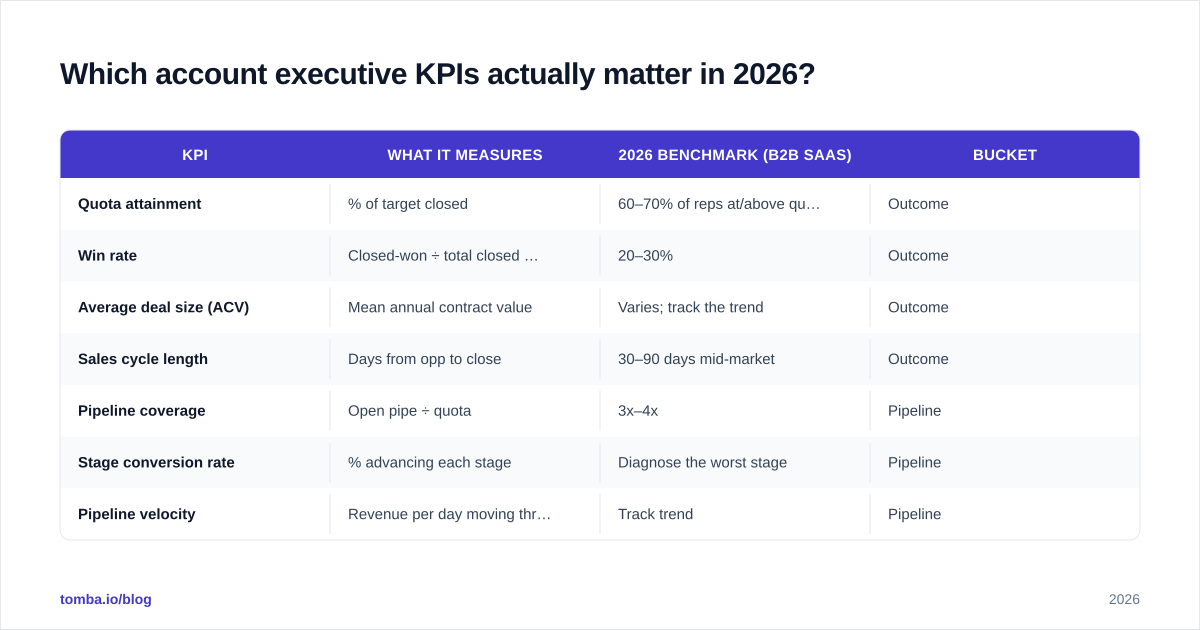
Here's the short answer: track a handful of outcome KPIs religiously, a few pipeline KPIs to forecast, and just enough activity KPIs to coach. Below is the working set, with what each one tells you and a rough 2026 B2B SaaS benchmark. Treat benchmarks as a starting line, not gospel — your segment, ACV, and motion shift every number.
| KPI | What it measures | 2026 benchmark (B2B SaaS) | Bucket |
|---|---|---|---|
| Quota attainment | % of target closed | 60–70% of reps at/above quota is a healthy team | Outcome |
| Win rate | Closed-won ÷ total closed deals | 20–30% | Outcome |
| Average deal size (ACV) | Mean annual contract value | Varies; track the trend | Outcome |
| Sales cycle length | Days from opp to close | 30–90 days mid-market | Outcome |
| Pipeline coverage | Open pipe ÷ quota | 3x–4x | Pipeline |
| Stage conversion rate | % advancing each stage | Diagnose the worst stage | Pipeline |
| Pipeline velocity | Revenue per day moving through pipe | Track trend | Pipeline |
| Meetings → opp rate | Qualified meetings becoming opps | 40–60% | Activity |
| Follow-up speed | Time to first touch on new lead | < 1 hour ideal | Activity |
| Forecast accuracy | Predicted vs. actual close | Within 10% | Outcome |
Notice the balance. Four outcome metrics, three pipeline metrics, two or three activity metrics. That ratio keeps the rep focused on results while still giving a manager the leading indicators needed to intervene before the quarter is lost.
Quota attainment#
The headline number. What percentage of their target did the rep close? It's lagging — by the time it's red, the quarter is often gone — which is exactly why you pair it with pipeline coverage and velocity as early-warning gauges. One nuance for 2026: measure attainment against a ramped quota for new reps. Holding a rep in month two to a tenured target produces noise, not insight.
Win rate#
Win rate is the single most coachable outcome KPI. A rep with strong activity but a 12% win rate has a qualification or discovery problem, not an effort problem. Segment win rate by lead source, deal size, and competitor present — that's where the diagnosis lives. A blended win rate hides the fact that a rep crushes inbound but loses every competitive deal.

Sales cycle length and deal size#
These two move together and define your revenue math. A shorter cycle means more shots on goal per quarter; a larger deal size means each shot is worth more. Watch for the trap: pushing reps to close faster can shrink deal size if they stop pursuing multi-stakeholder expansions. Track both side by side so you catch the trade-off.
What's the difference between activity, pipeline, and outcome KPIs?#
Think of the three buckets as cause and effect across time.
Activity KPIs are the most leading and the most gameable. Calls made, emails sent, meetings booked. They answer "is the rep doing the work?" but they say nothing about whether the work is any good. A rep can send 200 emails to bad addresses and look busy while generating zero pipeline. This is why activity metrics are worthless without a conversion denominator — "200 emails" means nothing; "200 emails → 18 replies → 6 meetings" is a story.
Pipeline KPIs sit in the middle. Pipeline coverage, stage conversion, and pipeline velocity tell you whether the activity is turning into qualified, moving opportunities. This is the forecaster's bucket. If coverage drops below 3x quota, you already know next quarter is at risk regardless of how this one closes.
Outcome KPIs are lagging and the only ones the business actually pays for. Revenue, win rate, attainment. They're the truth, but they arrive too late to change. So you manage forward from activity and pipeline, and you grade backward from outcomes.
The mistake almost every struggling team makes: they live entirely in the activity bucket because it's the easiest to measure and the most flattering. Dashboards full of dials and call counts feel like control. They aren't.

How do you build an account executive scorecard?#
Start with the number you're accountable for, then work backward to the three or four metrics that most directly predict it. A scorecard is a model of your revenue, not a list of everything you can count.
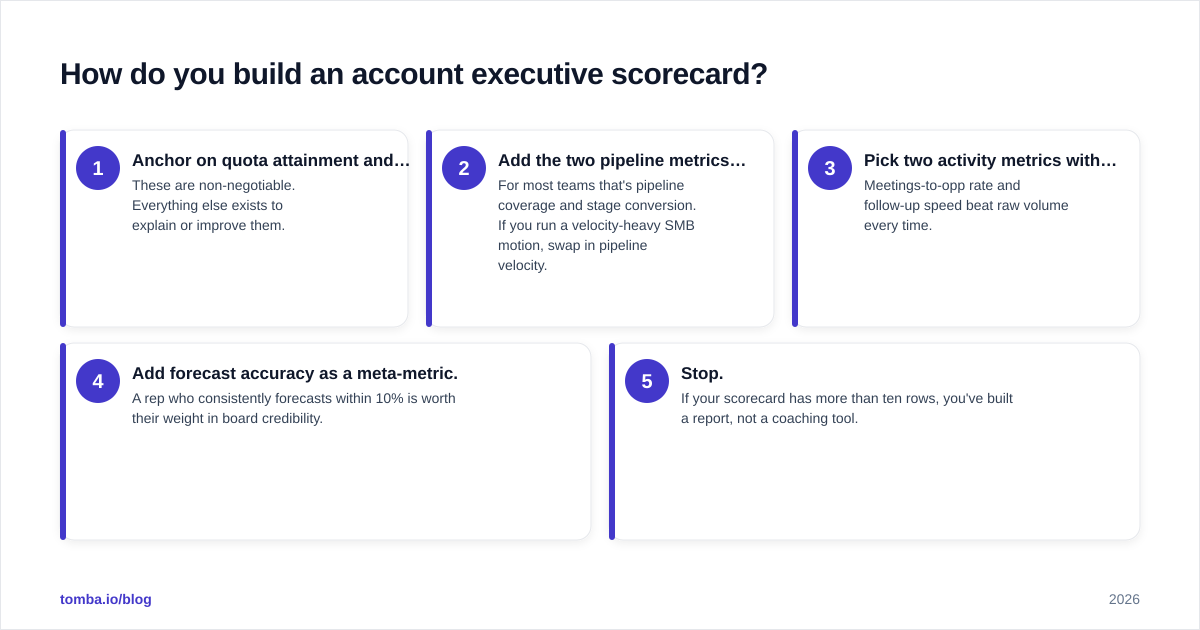
Here's a build sequence that works:
- Anchor on quota attainment and win rate. These are non-negotiable. Everything else exists to explain or improve them.
- Add the two pipeline metrics that forecast your motion. For most teams that's pipeline coverage and stage conversion. If you run a velocity-heavy SMB motion, swap in pipeline velocity.
- Pick two activity metrics with conversion denominators. Meetings-to-opp rate and follow-up speed beat raw volume every time.
- Add forecast accuracy as a meta-metric. A rep who consistently forecasts within 10% is worth their weight in board credibility.
- Stop. If your scorecard has more than ten rows, you've built a report, not a coaching tool.
Review cadence matters as much as metric choice. Activity metrics get a weekly look. Pipeline metrics get a weekly-to-biweekly look in deal reviews. Outcome metrics get a monthly and quarterly retro. Don't stare at win rate daily — it doesn't move that fast and the noise will make you over-correct.

For a deeper definition of how the closing number relates to wins and losses, the win rate and response rate glossary entries are useful anchors when you're standardizing definitions across the team. Standardized definitions are underrated — half of all KPI arguments are really just two people measuring the same word differently.
Which account executive KPIs should you ignore?#
Some metrics feel productive but actively mislead. Cut these or demote them to context-only:
- Raw email or call volume without conversion. Effort theater. A rep blasting 300 unverified emails looks busier than one sending 80 targeted, deliverable ones — and produces less.
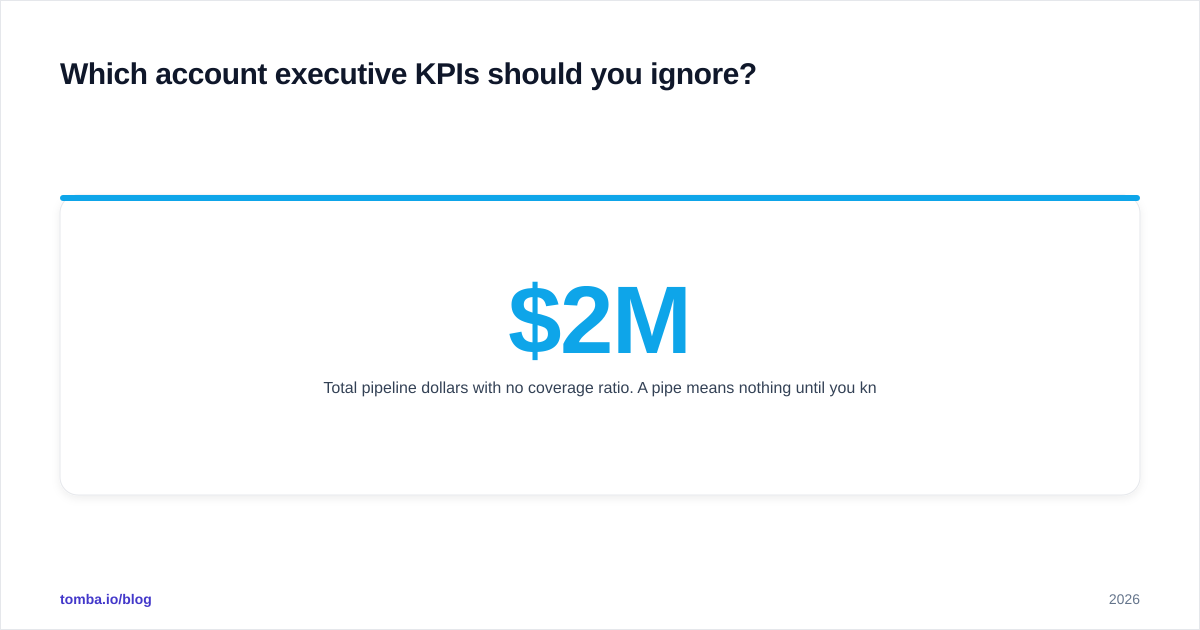
- Total pipeline dollars with no coverage ratio. A $2M pipe means nothing until you know it's 3x a $700K quota versus 1.2x a $1.6M quota.
- Activity-only leaderboards. They reward motion over results and quietly teach your team that looking busy beats closing.
- Lifetime stats for ramping reps. Judge new AEs on ramp-adjusted targets, not blended tenure numbers.
There's a data-quality thread running through all of these. Activity inflation usually traces back to bad contact data — reps "dialing" disconnected numbers or emailing addresses that bounce. When the underlying data is clean, activity metrics actually correlate with outcomes again. This is where front-loading good data pays compounding returns: verified contacts mean every logged activity is a real shot, so your activity-to-outcome ratios stay honest.
How does data quality affect AE KPIs?#
Every KPI on the scorecard inherits the quality of the data underneath it. Garbage in, garbage dashboard.
Consider follow-up speed, one of the highest-leverage activity KPIs — research consistently shows contacting a lead within the first hour dramatically raises connect rates. But "speed" is meaningless if the contact record has the wrong email or a dead phone number. The rep is fast to a dead end. Similarly, win rate gets distorted when unqualified, badly-sourced leads clog the pipeline and lose at the bottom, dragging the ratio down through no fault of the rep's selling.
This is the quiet case for investing in contact accuracy before you obsess over the dashboard. When your reps work from verified emails and validated phone numbers, three things happen: bounce rates fall and protect sender reputation, activity metrics start reflecting real engagement, and conversion ratios become trustworthy enough to forecast on. Tools like a dedicated email verifier and a phone validator keep the inputs clean so the outputs mean something. And when reps need net-new contacts to keep coverage above 3x, an email finder that returns verified addresses prevents the activity-inflation problem at the source.
For benchmarking your own numbers against the wider market, neutral third-party sources like G2's sales software category and HubSpot's annual sales research are worth bookmarking. Cross-check any vendor benchmark — including the ones in this post — against at least one independent source before you set targets on them.
How often should you review account executive KPIs?#
Match the review cadence to how fast each metric can actually change, and you'll avoid the two classic failure modes: micromanaging metrics that move slowly, and ignoring metrics that move fast.
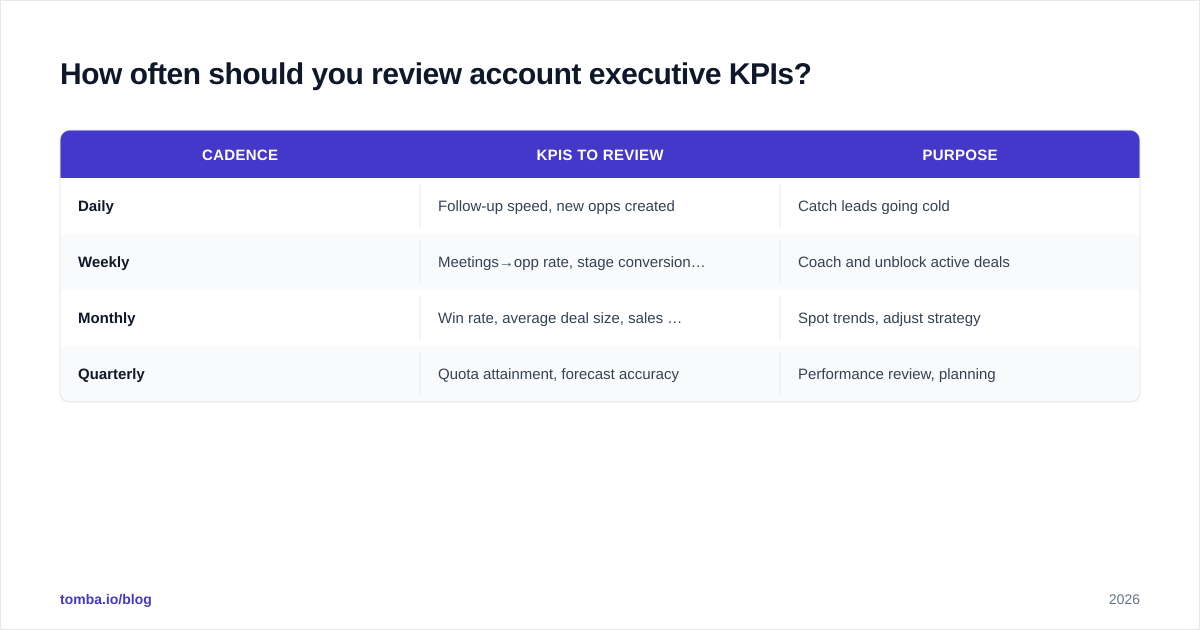
| Cadence | KPIs to review | Purpose |
|---|---|---|
| Daily | Follow-up speed, new opps created | Catch leads going cold |
| Weekly | Meetings→opp rate, stage conversion, pipeline coverage | Coach and unblock active deals |
| Monthly | Win rate, average deal size, sales cycle | Spot trends, adjust strategy |
| Quarterly | Quota attainment, forecast accuracy | Performance review, planning |
The principle: leading indicators get frequent reviews because you can still act on them; lagging indicators get infrequent reviews because acting on daily noise just creates whiplash. A manager who reviews win rate every morning will chase ghosts. A manager who checks follow-up speed only quarterly will miss a month of cold leads.
One more thing — make the review two-directional. KPIs should flow up for forecasting and down for coaching. If a rep only ever hears their numbers in a quarterly review tied to compensation, the metrics become a threat instead of a tool, and people start gaming them. The healthiest teams treat the scorecard as a shared diagnostic the rep and manager read together.
Putting it together#
The account executive KPIs that matter in 2026 aren't new or exotic — they're the same fundamentals, measured honestly and reviewed at the right cadence. Anchor on quota attainment and win rate. Forecast with pipeline coverage and stage conversion. Coach with meetings-to-opp rate and follow-up speed. Ignore the vanity volume metrics. And protect the whole system by keeping your contact data clean, because every KPI is only as truthful as the data feeding it.
Build the scorecard small, review it on the right rhythm, and let the metrics start a conversation instead of ending one.
If the data underneath your scorecard is the weak link — bounced emails inflating activity, dead numbers killing follow-up speed — start there. Tomba's Email Finder returns verified, deliverable contact emails so every logged activity is a real shot and your conversion ratios stay honest enough to forecast on. The free tier covers 25 searches a month to test it against your own list; paid plans start at $49/mo. See full Tomba pricing to match a plan to your team's volume, and pair it with the email verifier to keep your CRM clean as you scale.
Get the Tomba newsletter
Practical outbound tactics and product updates — once every two weeks.
About the author