Account Management KPIs: 14 Metrics to Track in 2026
The 14 account management KPIs that actually predict retention and expansion in 2026 — with benchmarks, formulas, and a scorecard framework you can copy.
TL;DR
- The account management KPIs that matter aren't activity counts — they're leading indicators of retention and expansion: Net Revenue Retention, health score, and time-to-value sit at the top.
- Track a small set well. Fourteen metrics across four buckets (retention, expansion, engagement, efficiency) beats a 40-metric dashboard nobody reads.
- Net Revenue Retention above 110% is the single number that best separates healthy SaaS books from leaky ones.
- Lagging KPIs (churn, renewal rate) tell you what already happened; pair each one with a leading signal you can act on this quarter.
- Build an account scorecard, not a metrics graveyard — weight each KPI, review it in every QBR, and tie it to a named owner.
What are account management KPIs?#
Account management KPIs are the quantified measures of how well you retain, grow, and serve your existing customers. They answer one question your CRO actually cares about: is the revenue you already won going to stay and grow, or quietly leak out the back door?
Think of your customer base like a leaky bucket. New sales pour water in the top. Churn drains it from the bottom. Expansion is a second tap that refills it faster. Account management KPIs are the gauges on that bucket — water level (current revenue), drain rate (churn), and refill rate (upsell). Without the gauges, you only notice the leak when the bucket is half empty.
Technically, these KPIs split into two families. Lagging indicators report outcomes that already happened — gross churn, renewal rate, revenue retention. Leading indicators predict outcomes before they land — product usage trends, support ticket sentiment, executive-sponsor engagement. The mistake most teams make is drowning in lagging metrics and ignoring the leading ones, which is the only place you can still change the result.
Why do most account management dashboards fail?#
Because they measure activity instead of outcomes. A dashboard showing "243 check-in calls logged this month" feels productive and tells you nothing about whether those accounts will renew. Activity is an input. Retention is the output. Confusing the two is how teams stay busy while win rate on renewals slides.
The second failure mode is volume. When everything is a KPI, nothing is. Gartner research on sales analytics consistently finds that teams tracking too many metrics make slower decisions, not better ones. Pick the vital few, instrument them properly, and ignore the rest until one of the vital few breaks.

The third failure: no owner and no cadence. A KPI without a named account manager accountable for it, reviewed on a fixed rhythm, is decoration. Every metric below should map to one person and show up in your quarterly business reviews.
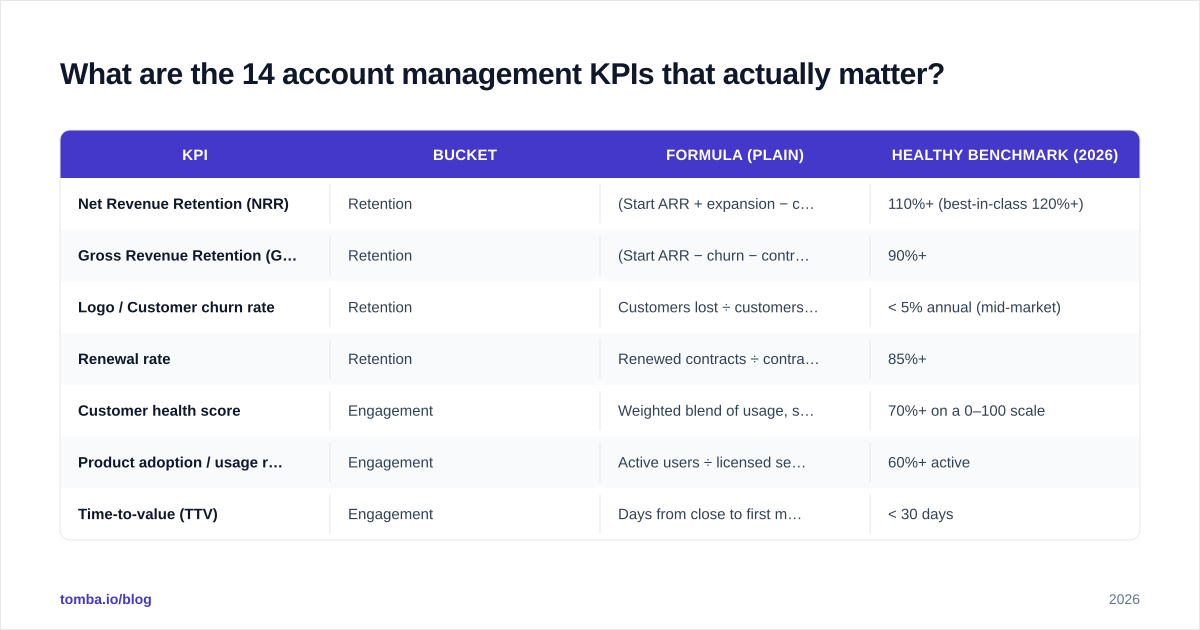
What are the 14 account management KPIs that actually matter?#
Here are the metrics worth instrumenting, grouped by what they protect. You will not need all fourteen on day one — start with the retention bucket, then layer in expansion and engagement as your data matures.
| KPI | Bucket | Formula (plain) | Healthy benchmark (2026) |
|---|---|---|---|
| Net Revenue Retention (NRR) | Retention | (Start ARR + expansion − churn − contraction) ÷ Start ARR | 110%+ (best-in-class 120%+) |
| Gross Revenue Retention (GRR) | Retention | (Start ARR − churn − contraction) ÷ Start ARR | 90%+ |
| Logo / Customer churn rate | Retention | Customers lost ÷ customers at period start | < 5% annual (mid-market) |
| Renewal rate | Retention | Renewed contracts ÷ contracts up for renewal | 85%+ |
| Customer health score | Engagement | Weighted blend of usage, support, sentiment | 70%+ on a 0–100 scale |
| Product adoption / usage rate | Engagement | Active users ÷ licensed seats | 60%+ active |
| Time-to-value (TTV) | Engagement | Days from close to first measurable outcome | < 30 days |
| Expansion revenue | Expansion | Upsell + cross-sell ARR in period | 20–30% of new ARR |
| Upsell / cross-sell rate | Expansion | Accounts expanded ÷ total accounts | 15%+ annually |
| Account / customer lifetime value (LTV) | Expansion | Avg revenue per account × avg lifespan | 3×+ CAC |
| Net Promoter Score (NPS) | Engagement | % promoters − % detractors | 30+ (40+ strong) |
| QBR completion rate | Efficiency | QBRs held ÷ QBRs scheduled | 90%+ |
| Response / resolution time | Efficiency | Avg time to first reply + to resolve | < 4h first reply |
| Revenue per account manager | Efficiency | Book of business ARR ÷ headcount | Varies by segment |
Retention KPIs#
Net Revenue Retention (NRR) is the headline number. It captures expansion, contraction, and churn in a single figure. Above 100% means your existing base grows even if you sign zero new logos — the holy grail of efficient growth. Below 100% means you're filling a leaky bucket. Salesforce and most SaaS analysts treat NRR as the truest measure of product-market fit in a mature book.
Gross Revenue Retention strips out expansion so you see the raw leak. If NRR is 115% but GRR is 78%, you're papering over heavy churn with a few big upsells — fragile, and one lost whale from disaster.
Expansion KPIs#
Expansion revenue is where account management earns its budget. A renewal keeps you flat; an upsell grows the account. Track expansion as a percentage of new ARR — when it climbs past 30%, your account team is functionally a second sales engine. This is also where contact data quality bites: expanding into a new department means finding the right new buyer, which is why mature AM teams lean on data enrichment to keep account maps current.
Engagement KPIs#
Health score is your composite early-warning system — a weighted blend of product usage, support volume, sentiment, and relationship depth. Done well, a declining health score gives you 60–90 days of lead time before a renewal goes sideways. Done badly (equal weights, no validation against actual churn), it's a number that makes everyone feel informed and predicts nothing. Back-test your health score against last year's churned accounts before you trust it.
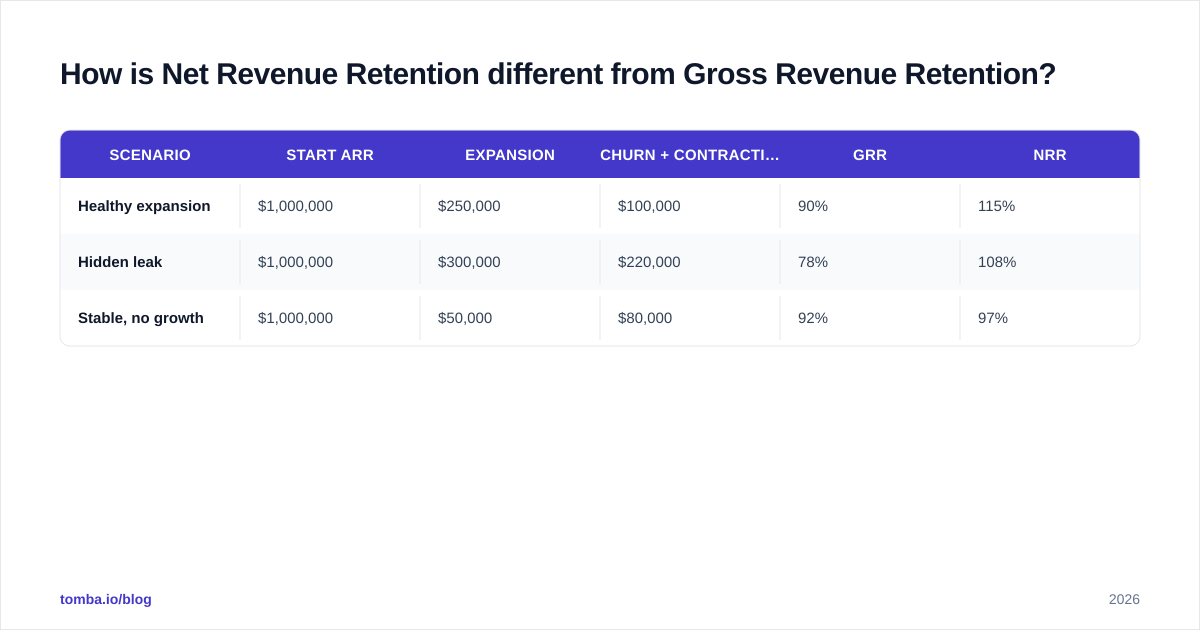
How is Net Revenue Retention different from Gross Revenue Retention?#
NRR includes expansion revenue; GRR does not. That's the whole distinction, and it matters enormously.
| Scenario | Start ARR | Expansion | Churn + contraction | GRR | NRR |
|---|---|---|---|---|---|
| Healthy expansion | $1,000,000 | $250,000 | $100,000 | 90% | 115% |
| Hidden leak | $1,000,000 | $300,000 | $220,000 | 78% | 108% |
| Stable, no growth | $1,000,000 | $50,000 | $80,000 | 92% | 97% |
In the "hidden leak" row, NRR of 108% looks fine on a board slide. But GRR of 78% reveals that nearly a quarter of the base is bleeding out, masked by a couple of large upsells. Always report both. NRR tells you the net direction; GRR tells you how solid the foundation is.
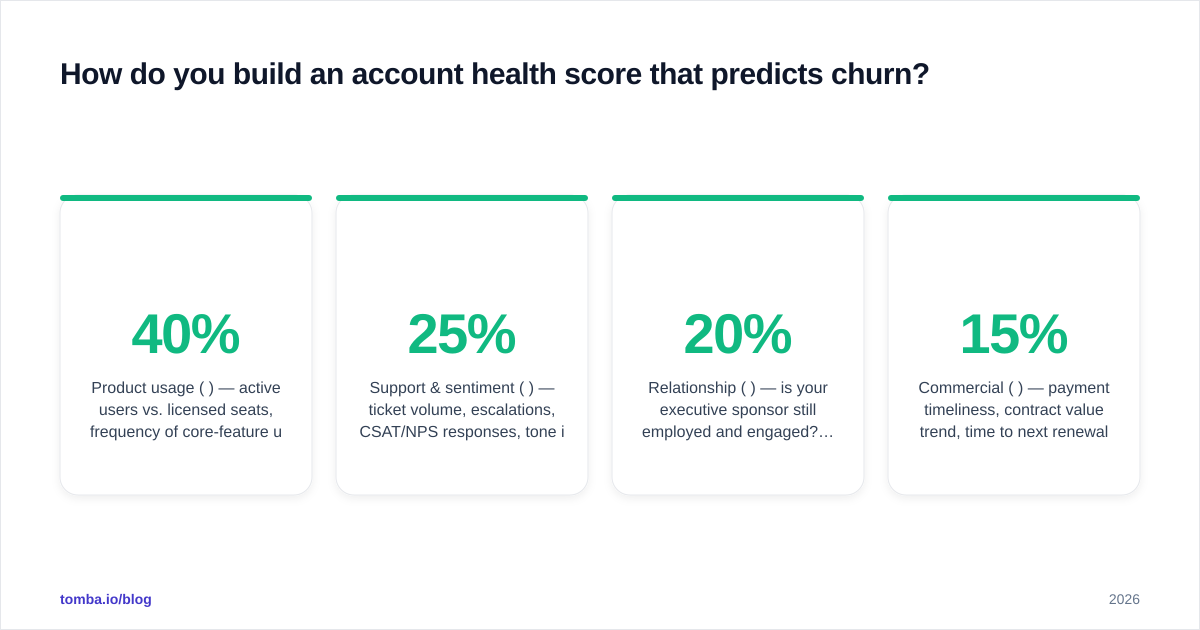
How do you build an account health score that predicts churn?#
Start with the signals that correlated with churn in your historical data, weight them, and validate. Don't copy a generic template.
A practical starting formula:
- Product usage (40%) — active users vs. licensed seats, frequency of core-feature use, usage trend over the last 30/60/90 days. Declining usage is the loudest churn signal there is.
- Support & sentiment (25%) — ticket volume, escalations, CSAT/NPS responses, tone in recent emails.
- Relationship (20%) — is your executive sponsor still employed and engaged? Single-threaded accounts are fragile. Multi-threaded accounts survive a champion leaving.
- Commercial (15%) — payment timeliness, contract value trend, time to next renewal.
Score each 0–100, apply the weights, and bucket accounts into green / yellow / red. Then do the step most teams skip: pull last year's churned accounts and check what their health score was 90 days before they left. If churned accounts were mostly "green," your model is broken — reweight until red actually means red.
Relationship depth deserves special attention. When your only contact at a key account changes jobs, the clock starts ticking. Keeping a live map of decision-makers — and being able to reach a replacement champion fast — is an account-management discipline, not just a sales one. A current B2B contact database and reliable contact lookups turn "our champion left, now what?" from a crisis into a Tuesday task.

How often should you review account management KPIs?#
On three nested cadences, each with a different metric set.
Weekly (operational): leading indicators only — health-score changes, usage drops, open escalations, accounts entering the renewal window. This is the "what needs my attention now" view for individual account managers.
Monthly (managerial): the full KPI set rolled up by segment and by AM. Trend lines matter more than point values. Is NRR drifting? Is one segment churning faster? This is where you spot patterns and reallocate effort.
Quarterly (strategic): QBRs with customers plus an internal board-level roll-up — NRR, GRR, LTV:CAC, expansion as a share of new ARR. This connects account management to revenue operations and the company's growth model. If you're running structured QBRs, your QBR completion rate is itself a KPI — skipped QBRs correlate strongly with surprise churn.
Tie everything back to your CRM so the numbers update themselves. A KPI that requires a manual spreadsheet refresh every Friday will be abandoned by March.
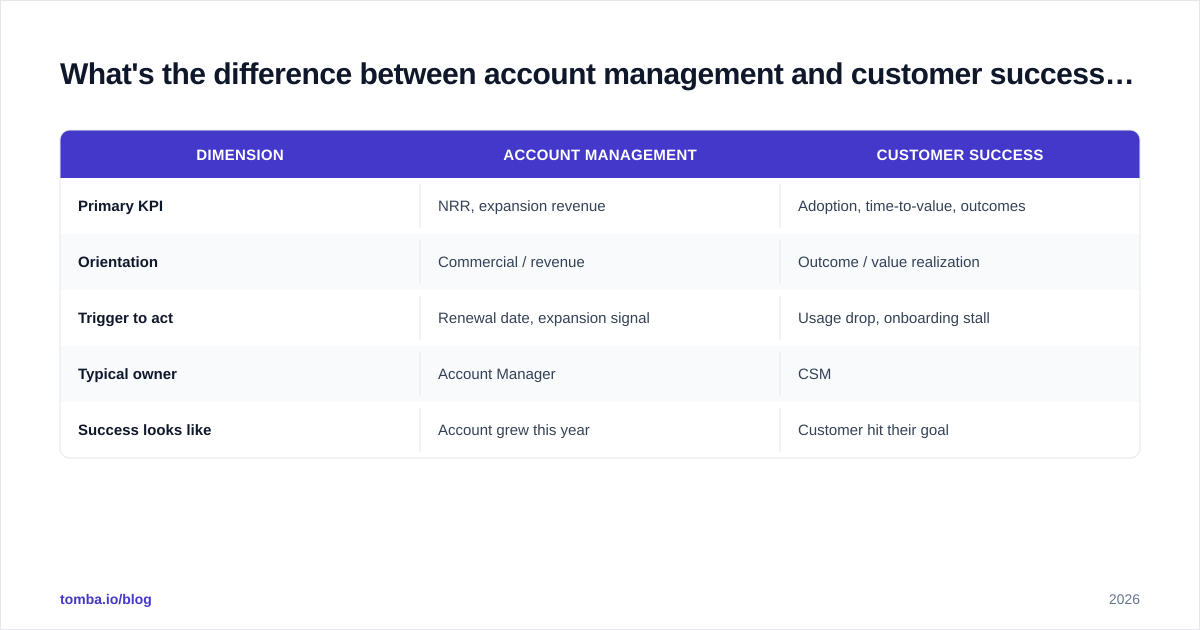
What's the difference between account management and customer success KPIs?#
They overlap heavily but optimize for different things. Account management leans commercial — its north star is revenue retention and expansion. Customer success leans outcome — its north star is the customer achieving their goal, on the theory that successful customers renew and grow.
| Dimension | Account Management | Customer Success |
|---|---|---|
| Primary KPI | NRR, expansion revenue | Adoption, time-to-value, outcomes |
| Orientation | Commercial / revenue | Outcome / value realization |
| Trigger to act | Renewal date, expansion signal | Usage drop, onboarding stall |
| Typical owner | Account Manager | CSM |
| Success looks like | Account grew this year | Customer hit their goal |
In smaller orgs one person wears both hats. In larger ones, the cleanest setup pairs a CSM (drives adoption and outcomes) with an AM (owns the commercial relationship and the number). The KPIs should be shared at the seams — both should see the health score; only AM owns NRR.
How do you turn KPIs into action?#
A metric you don't act on is trivia. Build a simple intervention map so each KPI threshold triggers a play:
- Health score drops below 60 → automated alert to the AM, schedule a value-review call within 5 business days.
- Usage falls 20% month-over-month → trigger a re-onboarding sequence for inactive seats.
- Renewal window opens (120 days out) → kick off the renewal motion, confirm budget and sponsor.
- Expansion signal fires (new department, hiring spike, feature-limit hit) → route to AM with an upsell brief, including fresh contacts for the new buying unit.
That last play is where data freshness pays off. Expansion usually means selling to someone you've never met inside an account you already own — a new VP, a sister business unit, a newly funded team. You can't expand into a contact you can't reach. Keeping verified emails and direct lines for the broader buying committee is the unglamorous fuel behind every expansion KPI.
Put your account KPIs to work#
Account management KPIs only move the business when every red flag has a name attached and a contact to reach. When a health score dips or an expansion signal fires, your team's next move is almost always talk to the right person at that account — including people who weren't in the original deal.
That's where Tomba's Email Finder fits into the account-management stack: when your champion leaves, a new decision-maker appears, or you're expanding into a sister team, you can find and verify the contact in seconds instead of stalling the play. Pair it with your CRM and health-score alerts, and your KPIs stop being a report you read and start being a system that acts. Check Tomba pricing — the free tier gives you 25 searches a month to test it against your top at-risk accounts before you commit.
Measure the few KPIs that predict retention. Wire each one to a play. Make sure every play has a person to call. That's the whole game.
Get the Tomba newsletter
Practical outbound tactics and product updates — once every two weeks.
About the author