B2B Average Email Open Rate in 2026: Benchmarks & Fixes
Most B2B teams chase a single "good" open rate that doesn't exist. Here are the real 2026 benchmarks by industry, what Apple MPP did to the metric, and the levers that actually move opens.
TL;DR
- The b2b average email open rate in 2026 lands roughly between 18% and 24%, depending on industry, with a blended benchmark near 21%.
- That number is inflated and noisy because of Apple Mail Privacy Protection, which auto-opens emails — treat open rate as a directional signal, not gospel.
- Industry matters more than any single benchmark: nonprofit, education, and government routinely beat 25%, while retail and tech often sit below 18%.
- The biggest lever on opens is not your subject line — it's list hygiene and sender reputation. Bad data tanks both.
- Pair clean, verified contact data with sender warmup and segmentation to move from "average" to top-quartile.
What counts as a good B2B email open rate in 2026?#
A good B2B email open rate in 2026 is anything above 24%; the average is around 21%. If you only remember one number, remember that opens are a range, not a finish line.
Open rate is the percentage of delivered emails that get opened. The math is simple — opens ÷ delivered × 100 — but the inputs are messy. A campaign sent to 10,000 contacts where 9,500 are delivered and 2,000 are opened gives you a 21% open rate. The trap is assuming that 21% means 2,000 humans read your email. It doesn't, and that gap is the whole story of email metrics in 2026.
Most teams fixate on a single magic figure. The smarter move is to benchmark against your own industry and your own historical baseline, then chase incremental lift. A SaaS company comparing itself to a nonprofit's 28% open rate is measuring the wrong race.
What is the average email open rate by industry?#
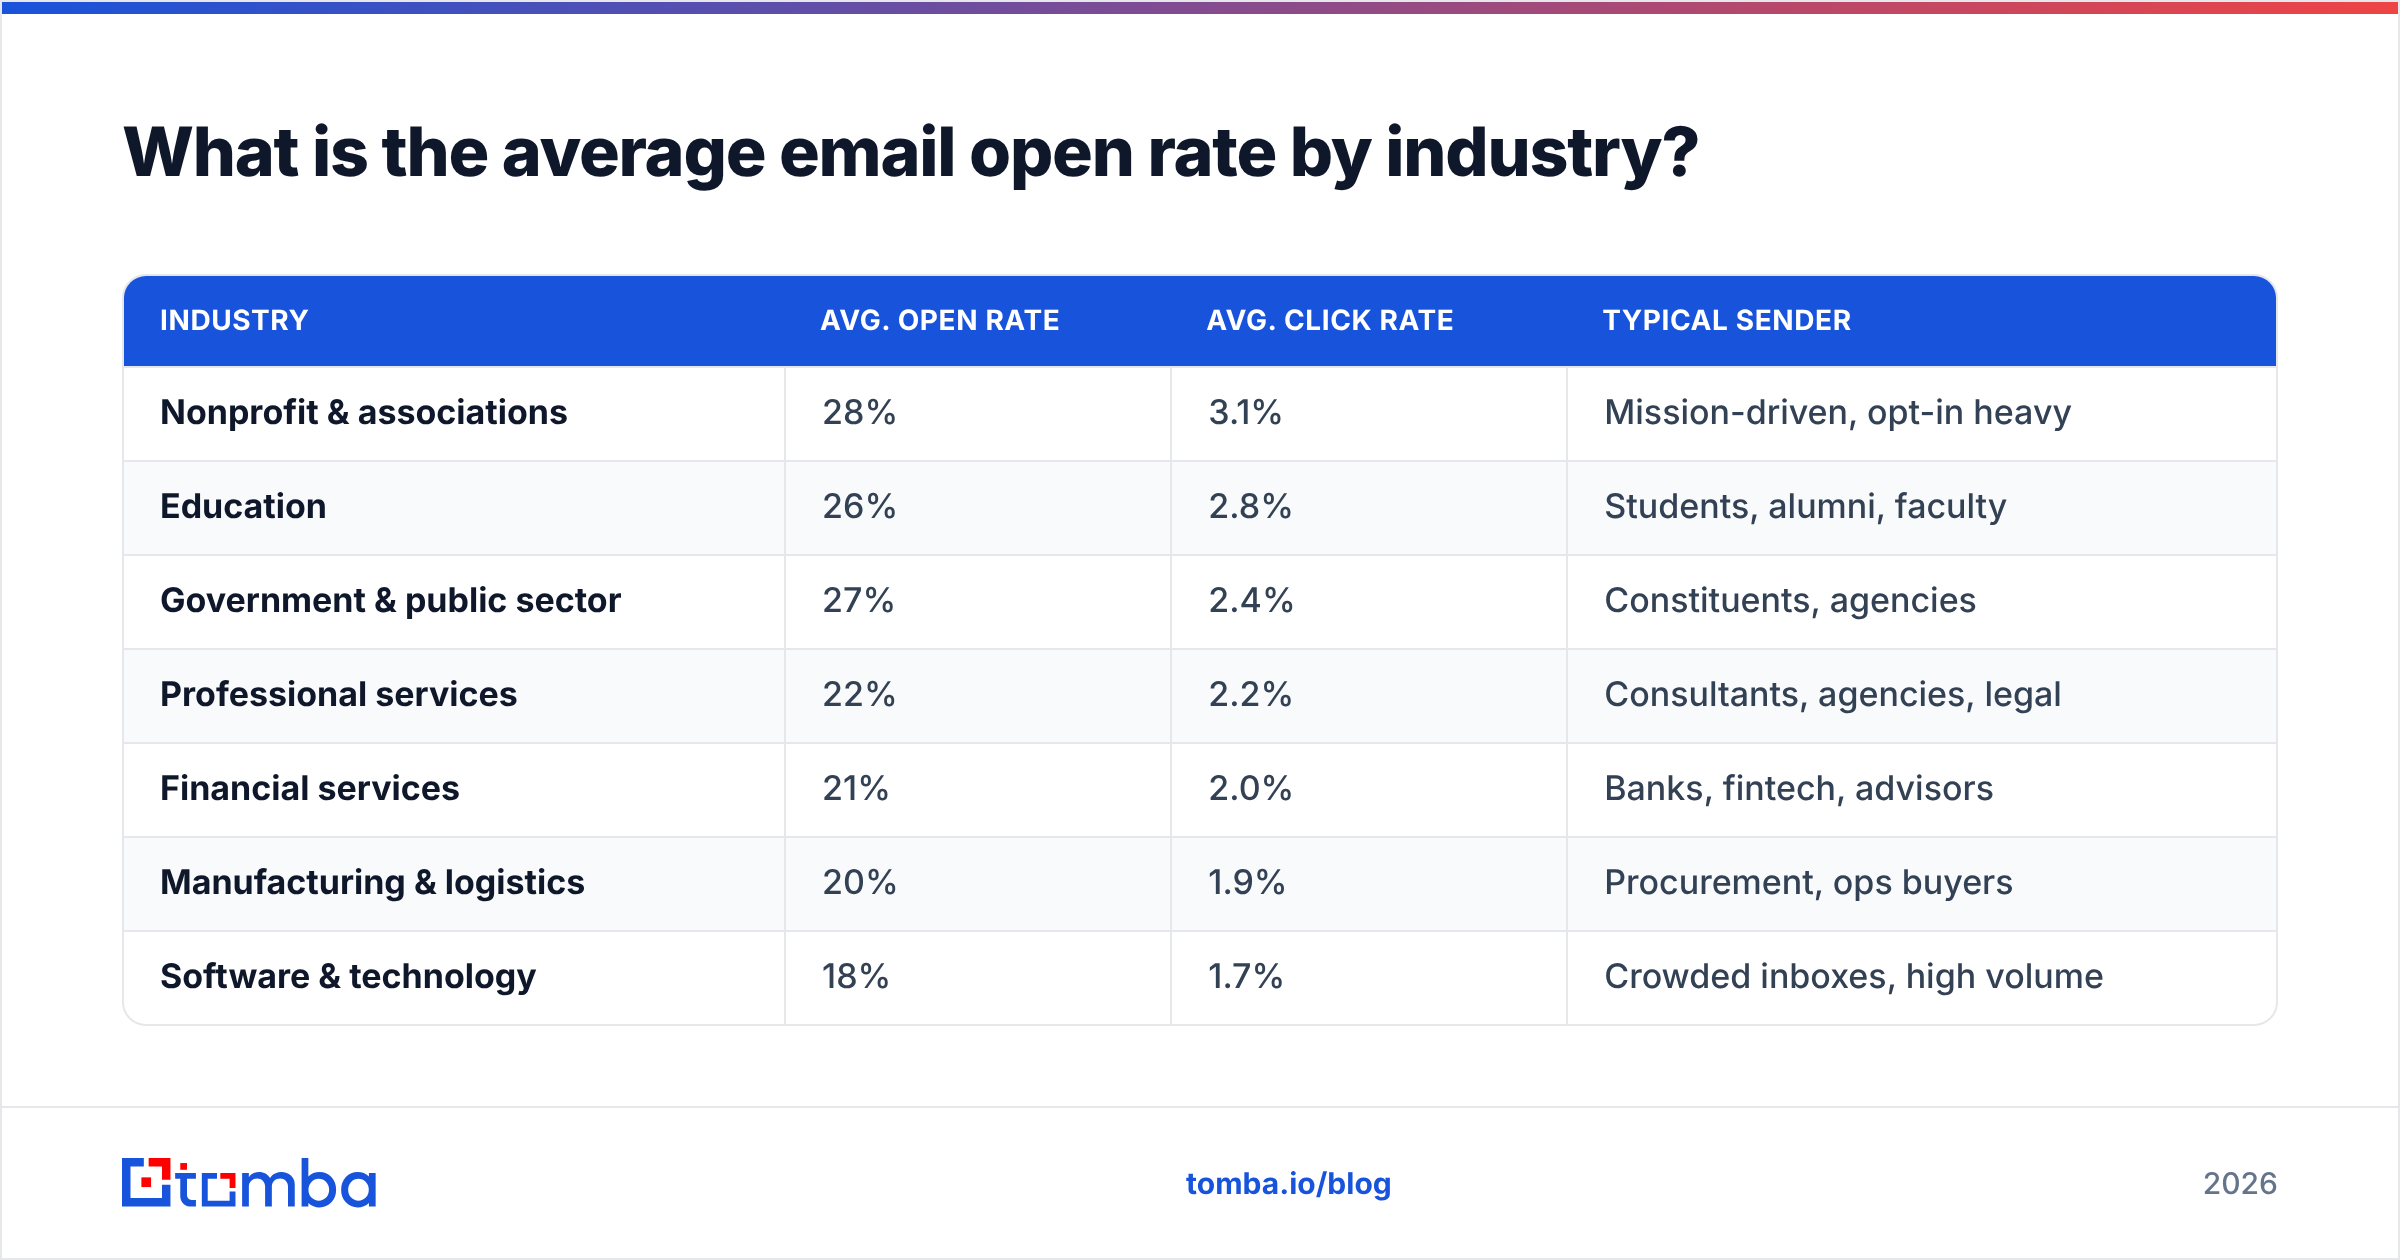
Averages hide enormous variance. Here's how B2B open rates cluster by sector in 2026, blended from public benchmark reports and aggregated sending data. Treat these as reference points, not targets carved in stone.
| Industry | Avg. open rate | Avg. click rate | Typical sender |
|---|---|---|---|
| Nonprofit & associations | 28% | 3.1% | Mission-driven, opt-in heavy |
| Education | 26% | 2.8% | Students, alumni, faculty |
| Government & public sector | 27% | 2.4% | Constituents, agencies |
| Professional services | 22% | 2.2% | Consultants, agencies, legal |
| Financial services | 21% | 2.0% | Banks, fintech, advisors |
| Manufacturing & logistics | 20% | 1.9% | Procurement, ops buyers |
| Software & technology | 18% | 1.7% | Crowded inboxes, high volume |
| Retail & e-commerce (B2B) | 16% | 1.4% | Wholesale, distributors |
The pattern is consistent: the more saturated and competitive the inbox, the lower the open rate. Software and tech audiences get hammered with outreach, so they're harder to reach even when your list is clean. Sectors with stronger permission relationships — donors, alumni, constituents — open more because the relationship predates the email.
If your numbers fall below these ranges, the cause is almost always upstream: invalid addresses, weak sender reputation, or a list that wasn't permission-based to begin with.
Why did B2B open rates get harder to measure?#
Open rates got unreliable in late 2021 and never recovered, mainly because of Apple Mail Privacy Protection (MPP). When a recipient uses Apple Mail with MPP enabled, Apple pre-fetches the tracking pixel — registering an "open" whether or not a human ever looked at the message.
Since Apple Mail accounts for a large share of email opens, that means a meaningful chunk of your reported opens are machine opens, not human reads. You can read the mechanics on the Apple Mail Privacy Protection overview, but the practical takeaway is blunt: your open rate in 2026 is inflated, and the inflation is uneven across audiences.
Three forces shape the modern open-rate number:
- Pixel pre-fetching — Apple MPP and some corporate security scanners trigger opens automatically, padding the metric.
- Image blocking — recipients with images disabled never fire the pixel, so real human opens go uncounted, pulling the metric down.
- Spam filtering — anything routed to spam never gets the chance to be opened, which is a deliverability problem masquerading as an engagement problem.
Net effect: open rate is now a directional signal. Rising trend good, falling trend bad — but the absolute value is fuzzy. This is exactly why forward-looking teams have shifted weight toward reply rate and response rate, which are far harder to fake.
How is open rate actually calculated, and what breaks it?#
Open rate is opens divided by delivered emails — and the word "delivered" is doing heavy lifting. Delivered is not the same as inboxed. An email can be "delivered" by the receiving server and still land in spam, where it will never be opened.
Here's the chain that determines whether your open rate even has a chance:
- Valid address — if the mailbox doesn't exist, you get a hard bounce and zero opens. This is where an email verifier earns its keep.
- Inbox placement — passing SPF, DKIM, and DMARC, plus a clean IP and domain reputation, decides inbox vs. spam.
- Sender reputation — mailbox providers score you on past engagement; a history of bounces and spam complaints quietly throttles you.
- Recipient behavior — only after all of the above does the human decide to open based on sender name and subject line.
Notice that the subject line — the thing most people obsess over — is the last link in the chain. If your data is dirty, you never reach the stage where copy matters. According to deliverability guidance from providers like HubSpot, engagement-based list pruning is one of the most reliable ways to protect inbox placement over time.
Which factors move the B2B average email open rate most?#
Ranked by impact, here are the levers that actually shift your open rate — in order:
- List quality and verification. A list with 15% invalid addresses doesn't just lose those sends; the resulting bounces damage your sender reputation and suppress opens for the valid contacts too. Verifying before you send is the single highest-ROI fix.
- Sender reputation and authentication. Proper SPF, DKIM, and DMARC plus a warmed sending domain decide whether you reach the inbox at all. No inbox, no open.
- Segmentation. Sending the right message to the right slice of your list beats blasting everyone. Segmented B2B campaigns consistently out-open generic broadcasts by several points.
- Send timing and cadence. B2B opens skew toward mid-week mornings in the recipient's timezone. Over-mailing fatigues a list and drives unsubscribes and spam complaints.
- Sender name and recognition. A recognizable from-name beats a clever subject line. People open emails from senders they trust.
- Subject line and preview text. Real, but last on the list. Optimize it after the five factors above are handled — not before.
The order matters because teams routinely invert it. They A/B test subject lines for weeks while sending to a list that's quietly 20% invalid. That's polishing the doorknob on a house with no foundation. Start with email deliverability fundamentals and clean data, then optimize copy.
How do you improve your B2B open rate?#
Improve your open rate by fixing data and deliverability first, then layering in segmentation and copy. Here's a concrete sequence you can run this quarter.
Step 1 — Clean and verify your list. Run every address through verification before sending. Remove hard bounces, role accounts you don't need, and stale contacts that haven't engaged in 6+ months. A bulk pass with the email verifier catches invalids before they cost you reputation.
Step 2 — Fix authentication. Confirm SPF, DKIM, and DMARC are configured for your sending domain. This is a one-time setup that pays off on every send.
Step 3 — Warm up new sending domains. If you're on a fresh domain or ramping volume, increase send volume gradually so mailbox providers learn to trust you. Cold-starting at high volume is a fast track to the spam folder.
Step 4 — Segment by intent and role. Group contacts by industry, seniority, or stage. A message tuned to a VP of Engineering will out-open the same message blasted to "everyone in the database."
Step 5 — Source better data at the top. Garbage in, garbage out. If you build lists from accurate, verified sources, you start with a structurally higher ceiling. Using a precise email finder and a clean B2B database means fewer bounces and a better baseline before you optimize anything.
Step 6 — Measure the right metric. Track reply rate and conversions alongside opens. In a post-MPP world, replies tell you what opens no longer can.
Open rate vs. reply rate vs. click rate: which should you trust?#
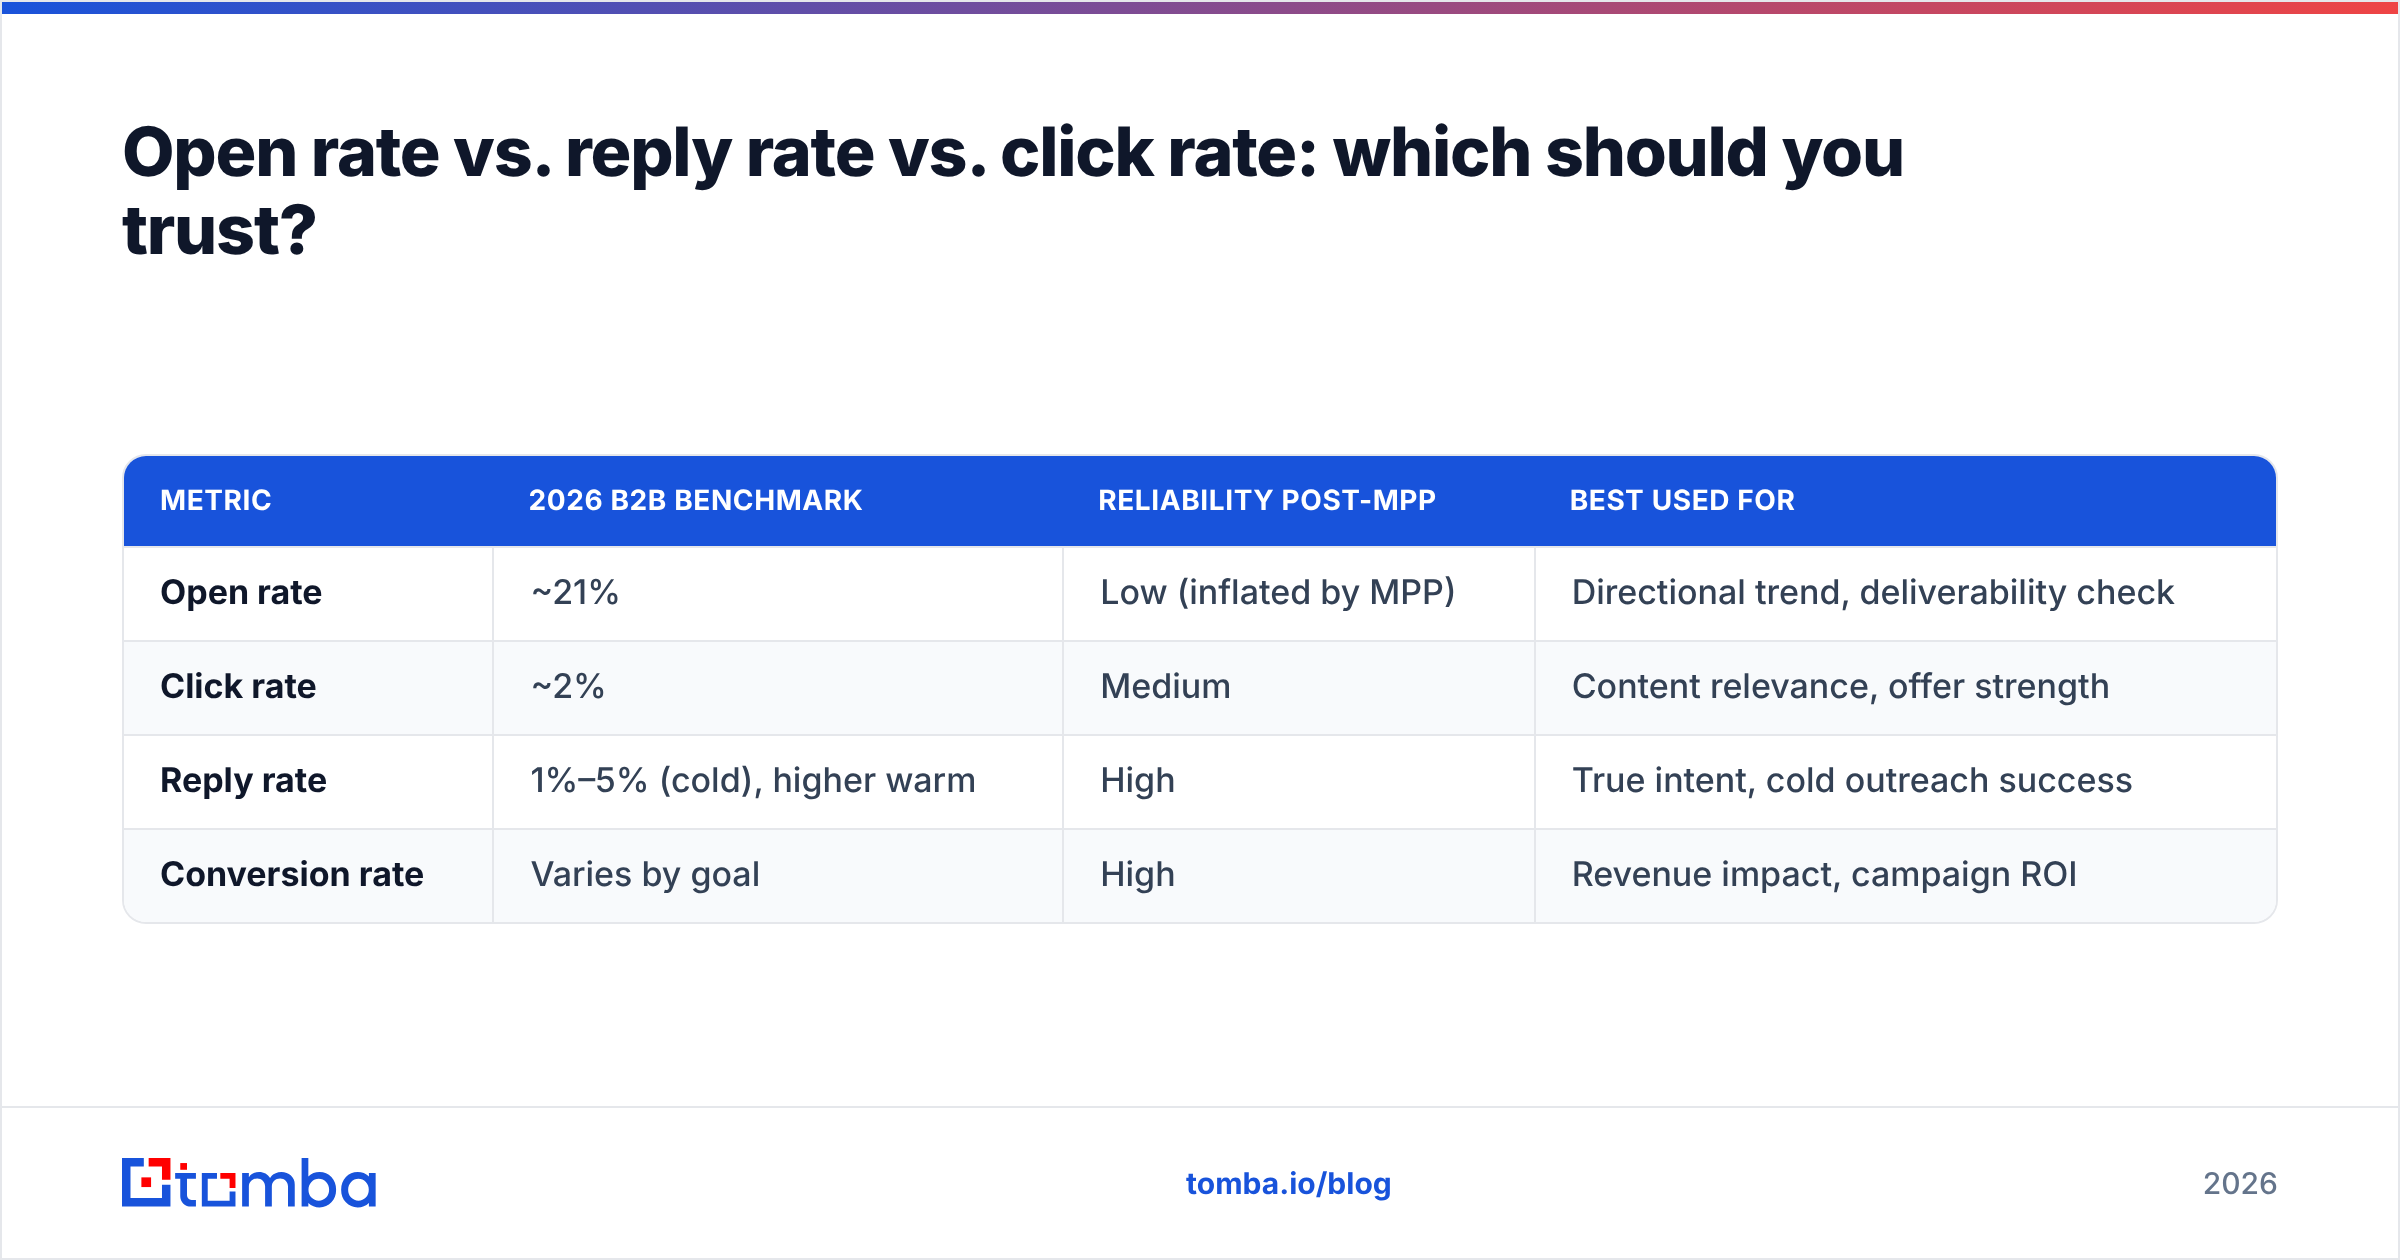
Trust the metric closest to revenue. Here's how the three core engagement metrics compare for B2B in 2026.
| Metric | 2026 B2B benchmark | Reliability post-MPP | Best used for |
|---|---|---|---|
| Open rate | ~21% | Low (inflated by MPP) | Directional trend, deliverability check |
| Click rate | ~2% | Medium | Content relevance, offer strength |
| Reply rate | 1%–5% (cold), higher warm | High | True intent, cold outreach success |
| Conversion rate | Varies by goal | High | Revenue impact, campaign ROI |
For newsletters and marketing sends, open rate still has value as a trend line — if it suddenly drops 8 points week over week, that's a deliverability alarm worth investigating. For cold outreach, reply rate is the metric that pays the bills. A 40% open rate with a 0.2% reply rate is a vanity number; a 22% open rate with a 4% reply rate is a working pipeline.
The honest framing: use open rate to diagnose deliverability, use reply and conversion rates to judge whether the campaign actually worked.
What's a realistic open-rate target for cold vs. warm B2B email?#
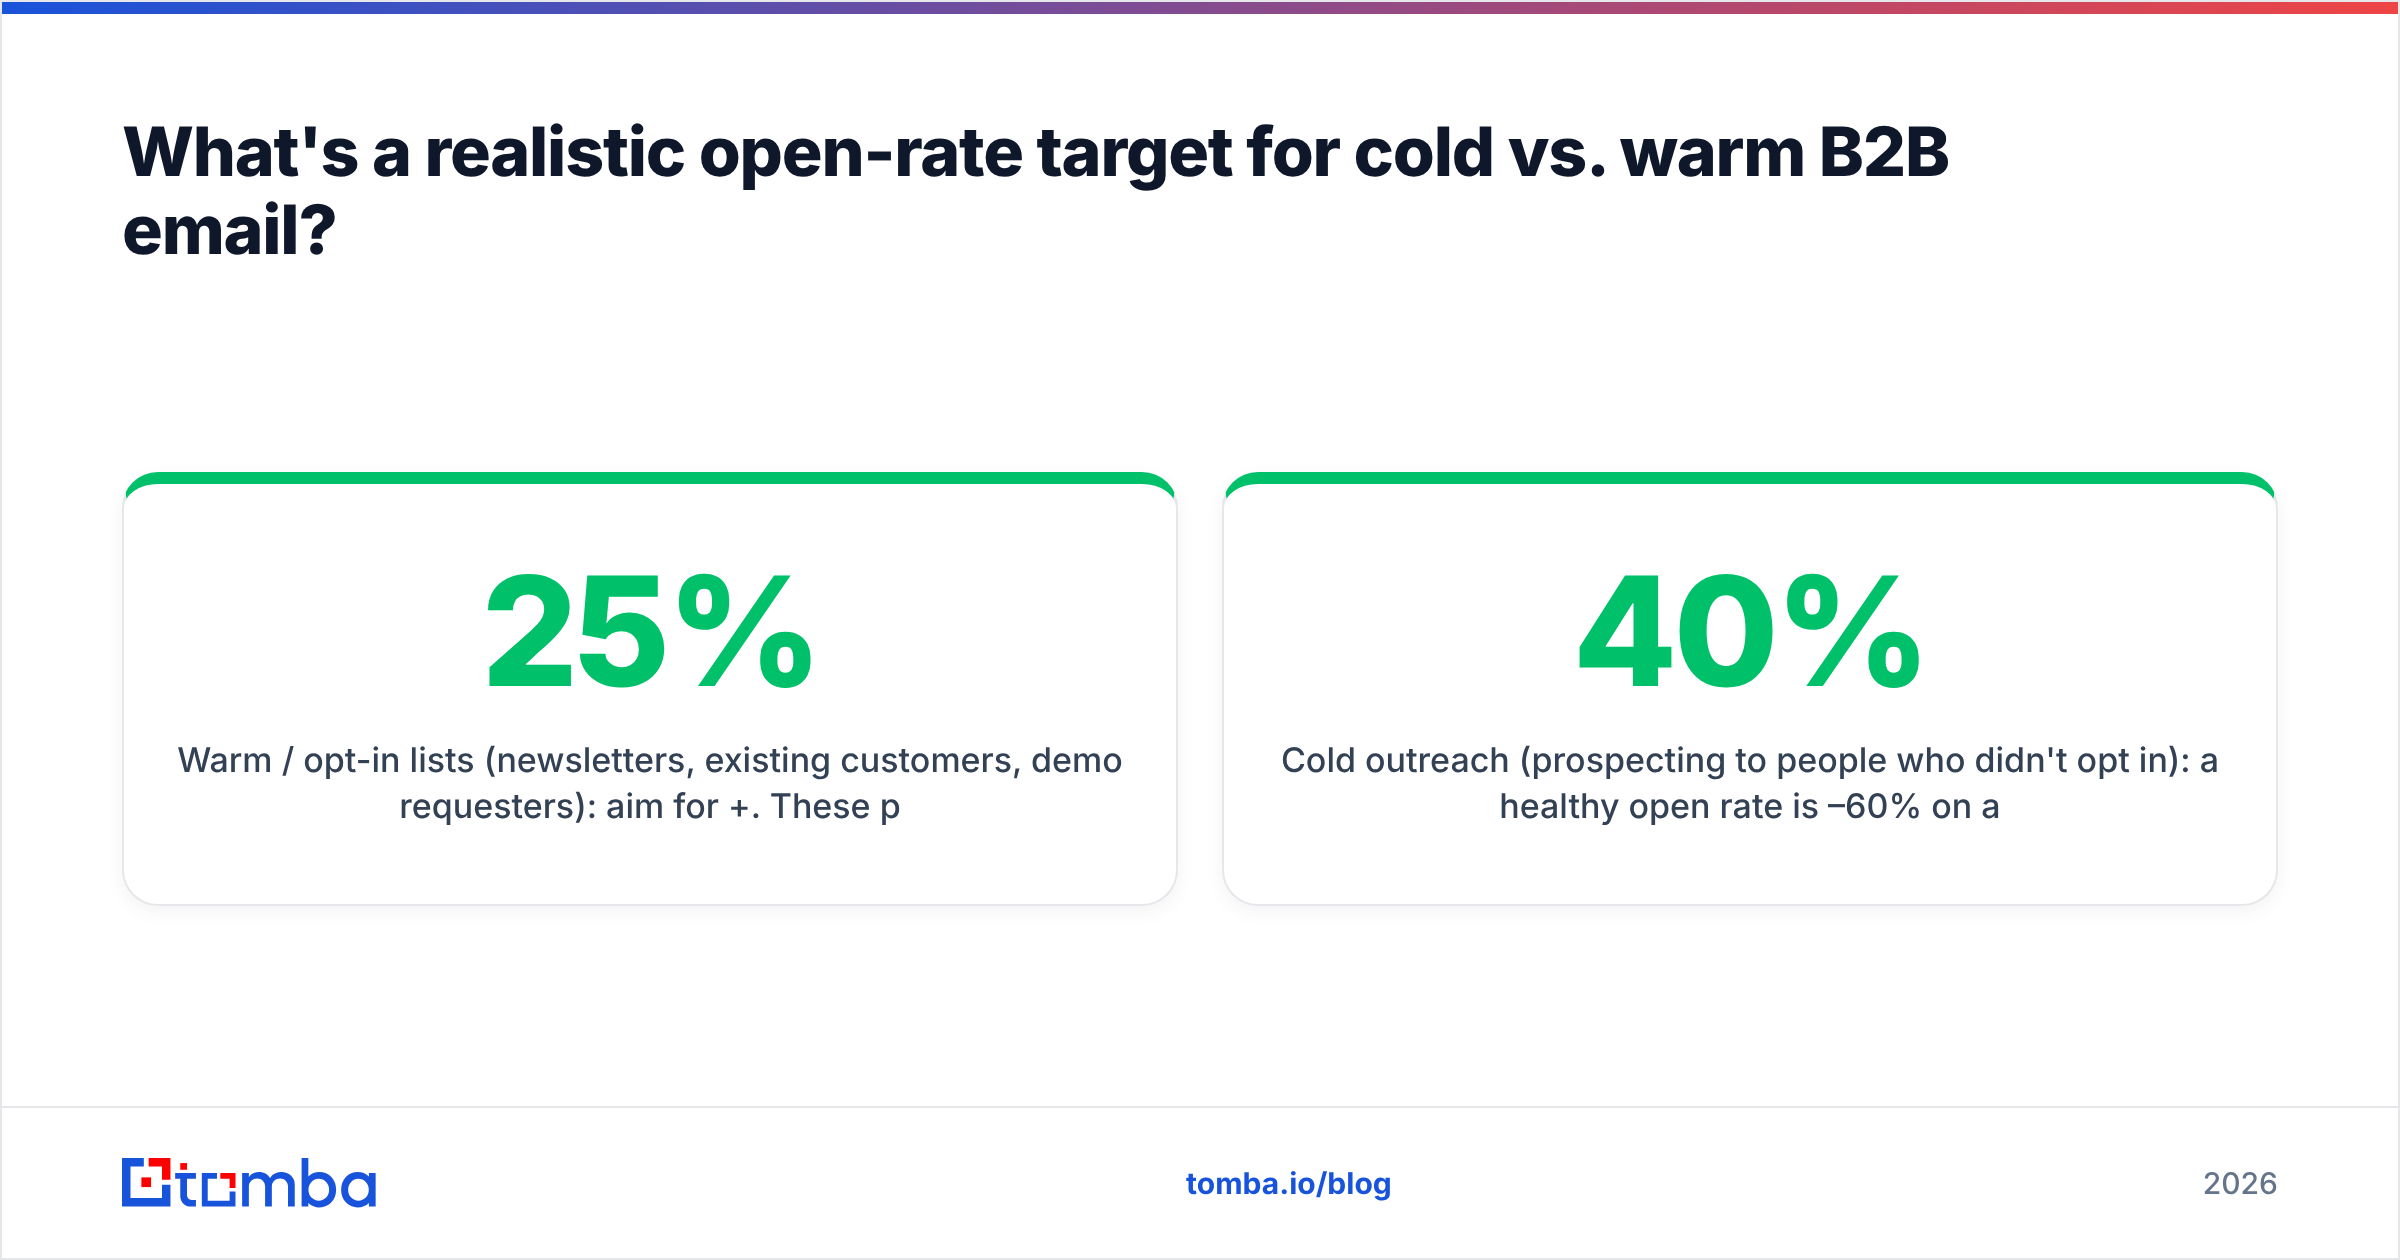
Set different targets for cold and warm email, because they're different games.
- Warm / opt-in lists (newsletters, existing customers, demo requesters): aim for 25%+. These people know you. If you're below 20% here, suspect deliverability or list decay.
- Cold outreach (prospecting to people who didn't opt in): a healthy open rate is 40%–60% on a well-verified, well-warmed setup — but cold open rates are even more MPP-distorted, so weight reply rate heavily. A realistic cold reply benchmark is 1%–5%, with top performers above that on tightly targeted, personalized sequences.
The reason cold "opens" can look higher than warm is small-batch, hyper-targeted sending with strong personalization and pristine data — the opposite of mass marketing. The moment cold volume scales without data discipline, opens and deliverability both collapse. That collapse is almost always a data problem, not a copy problem, which is why verified sourcing is non-negotiable for cold programs.
Frequently asked questions#
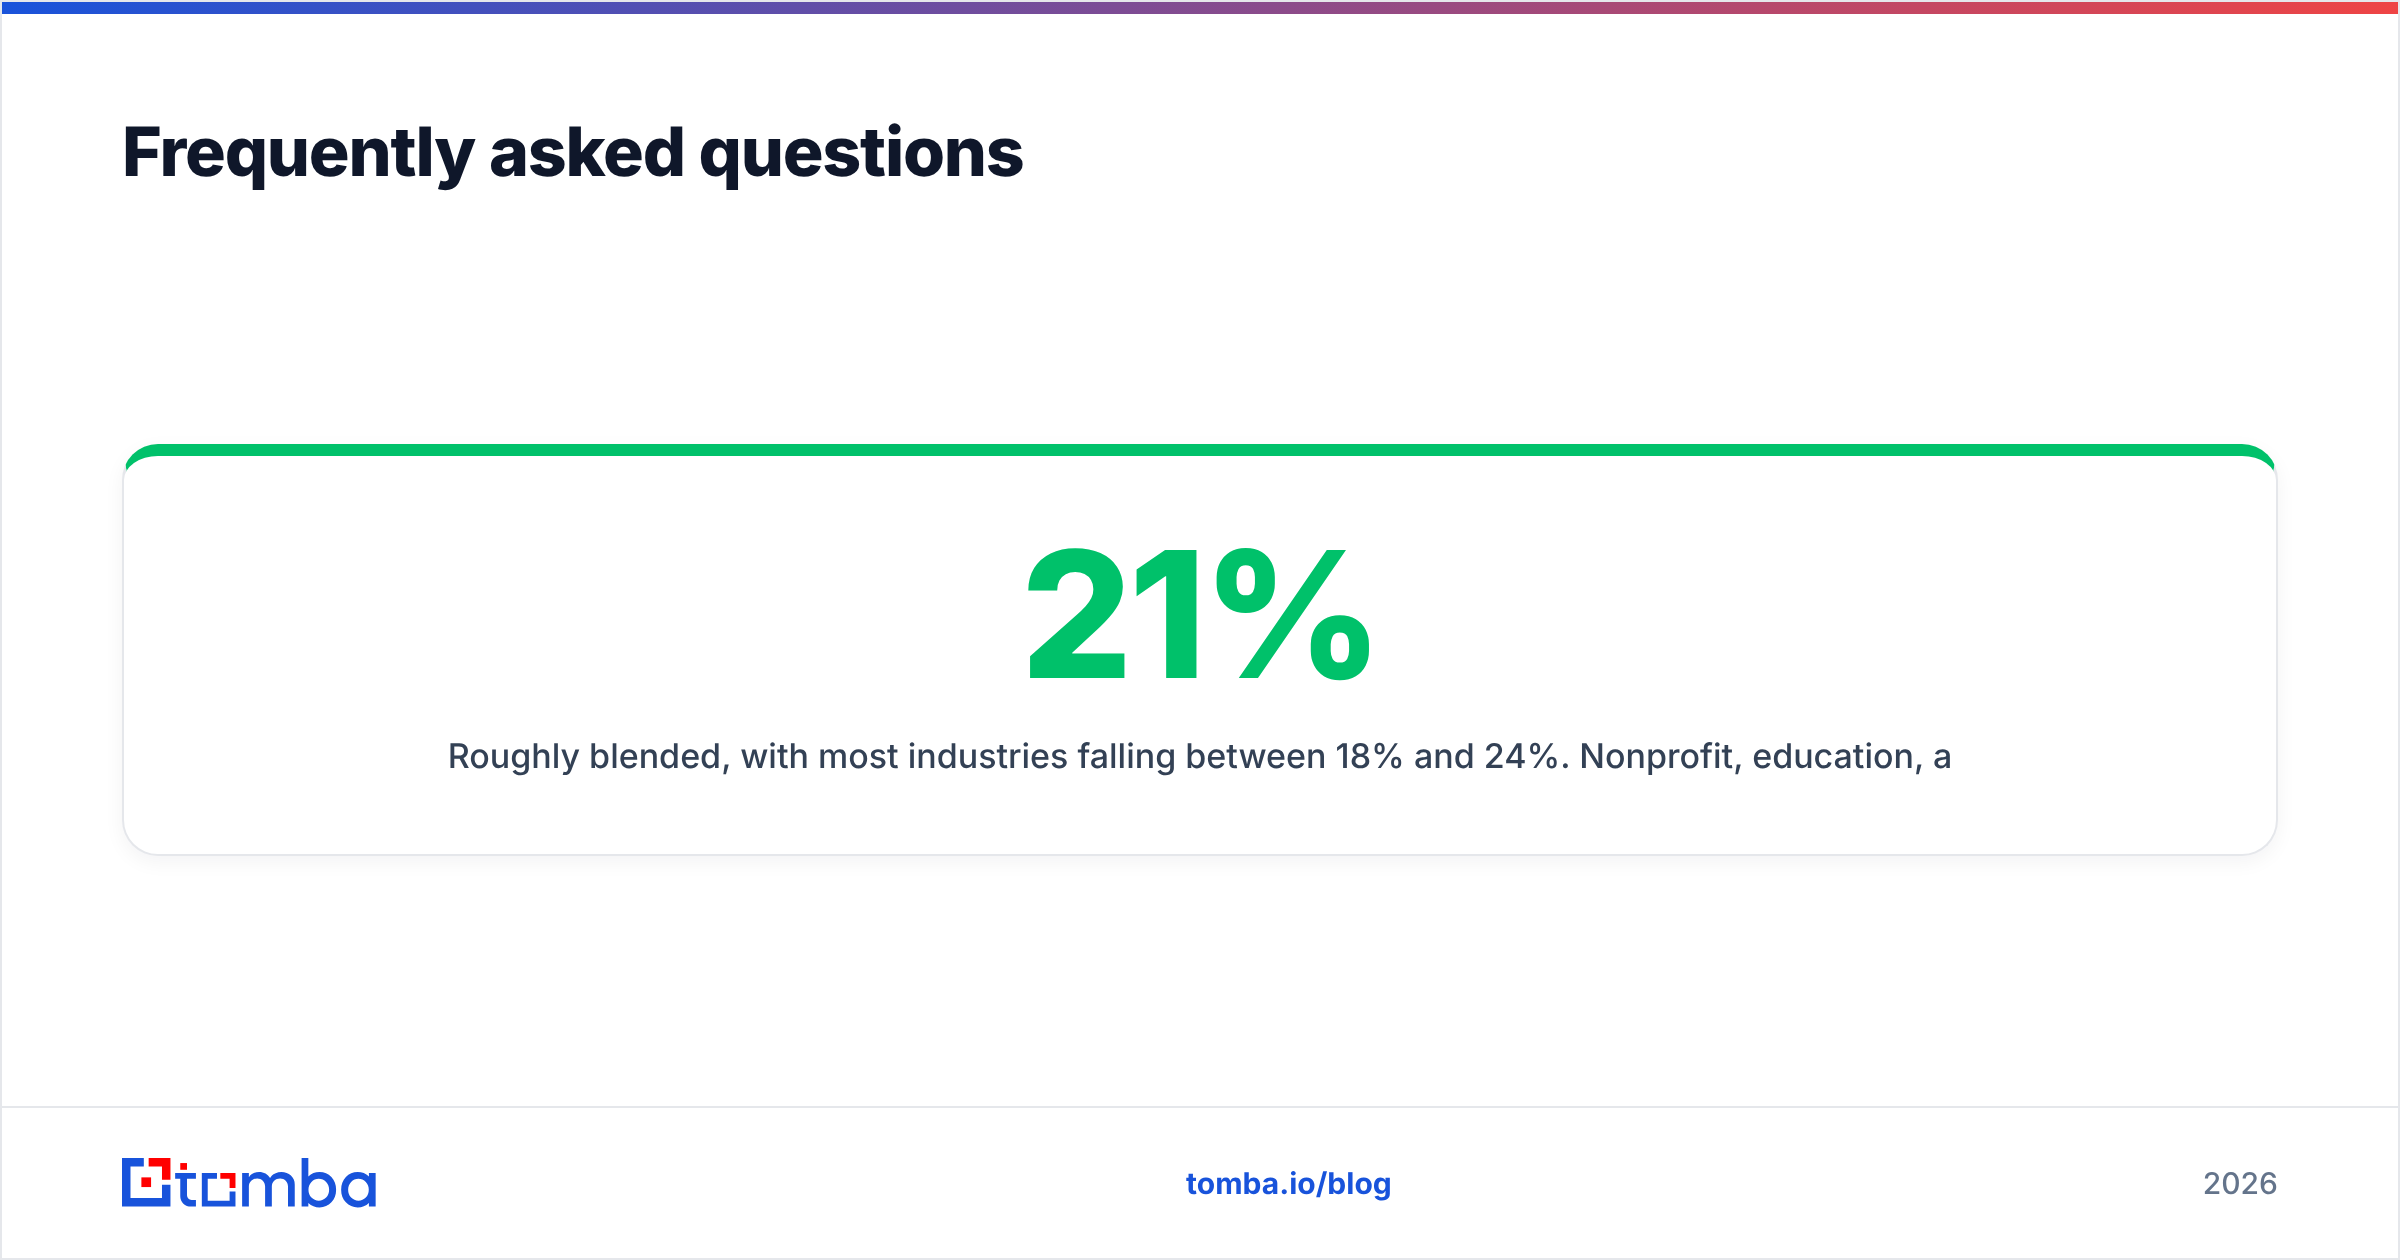
What is the average B2B email open rate in 2026? Roughly 21% blended, with most industries falling between 18% and 24%. Nonprofit, education, and government tend to exceed 25%, while software, tech, and B2B retail often sit below 18%.
Why is my open rate so low? The usual suspects, in order: an unverified list with too many invalid addresses, weak sender reputation or missing SPF/DKIM/DMARC, landing in spam, or sending to a disengaged audience. Fix data and deliverability before touching subject lines.
Are open rates still reliable? Only as a trend. Apple Mail Privacy Protection inflates opens by pre-loading tracking pixels, so the absolute number is fuzzy. Watch the trajectory and lean on reply and conversion rates for real signal.
Does subject line affect open rate? Yes, but it's the last link in the chain. If your email never reaches the inbox, the best subject line in the world earns zero opens. Prioritize deliverability and data quality first.
How fast can I improve my open rate? List cleaning and authentication fixes can lift inbox placement within one or two send cycles. Domain warmup and reputation repair take several weeks of consistent, engaged sending.
The bottom line: data quality is the open-rate lever#
The b2b average email open rate is a useful benchmark, but it's a downstream symptom. The teams that beat the average aren't writing cleverer subject lines — they're sending to verified, accurate, well-segmented lists from a warm domain. Everything else is optimization at the margins.
If you want to stop guessing and start with data that actually reaches inboxes, build your lists with the Tomba Email Finder. It finds verified professional email addresses by domain, name, or company, so you start every campaign with a clean foundation instead of a reputation-killing bounce pile. Check the Tomba pricing tiers — there's a free plan with 25 searches a month to test it, then Starter at $49/mo when you're ready to scale. Pair it with verification, and your "average" open rate stops being average.
// get started
Find, verify and enrich your first contacts today
Start on the free plan with 25 searches a month, then scale when your team is ready.
Free plan · No credit card required · GDPR & CCPA
// about the author