Churn Prediction in 2026: Models, Signals, and Playbooks
Churn prediction turns scattered account signals into a ranked save list. Here's how the models work, which signals matter in 2026, and how to act on the score.
TL;DR
- Churn prediction scores every account on its probability of canceling in a fixed window (usually 30–90 days) so retention teams can act before the renewal, not after the cancellation.
- The signals that actually move the model are behavioral and relational — product usage trends, support sentiment, billing friction, and stakeholder changes — not static firmographics.
- Most teams start with logistic regression or gradient-boosted trees; the model matters less than clean inputs, a sane label definition, and a workflow that turns scores into outreach.
- A prediction is worthless without an action. Tie each risk tier to a specific play (executive check-in, usage nudge, discount, re-onboarding).
- Garbage contact and account data sinks the whole effort. Enriched, deduplicated records are the unglamorous foundation that makes every downstream score trustworthy.
What is churn prediction?#
Churn prediction is the practice of estimating, for each customer, the probability that they will stop paying you within a defined future window. Think of it like a weather forecast for your revenue: you can't stop the storm by ignoring the radar, but you can move the picnic indoors if you read it three days out.
In B2B SaaS, "churn" usually means a logo cancels (logo churn) or downgrades enough to shrink revenue (revenue churn). A churn prediction system assigns every active account a score — say 0 to 100 — and ranks them so your customer success and revenue operations teams spend their limited hours on the accounts most likely to leave and most worth saving.
The distinction that trips people up: churn prediction is not the same as churn reporting. Reporting tells you that 6% of accounts left last quarter. Prediction tells you which accounts will leave next quarter while there's still time to intervene. One is an autopsy; the other is a diagnosis.
According to Gartner, retaining existing revenue is consistently cheaper than acquiring new logos, which is exactly why predictive retention has moved from a "nice to have" dashboard to a core GTM function.
)
Why does churn prediction matter more in 2026?#
Three forces have made this discipline non-optional this year.
- Acquisition costs keep climbing. When it costs more to win a customer, keeping the ones you have produces a higher return on every hour your team spends. A 5-point reduction in churn can outweigh a quarter of new-logo effort.
- Usage data is finally accessible. Product analytics, billing platforms, and CRMs now expose event-level data through APIs, so the inputs a model needs are no longer locked in a warehouse only data engineering can touch.
- Models are commoditized. You no longer need a research team to fit a gradient-boosted tree. The hard part shifted from modeling to data quality and operationalization — getting trustworthy signals in and getting humans to act on the output.
The teams winning at retention treat churn prediction as a closed loop: predict, act, measure the save, feed the result back into the model. The teams losing at it buy a dashboard, admire the scores, and change nothing about how reps spend their day.
What signals actually predict churn?#
Not all data is predictive. A logo's industry or employee count barely moves the needle once an account is live — those firmographics matter for acquisition, not retention. The signals that carry weight are about behavior over time.
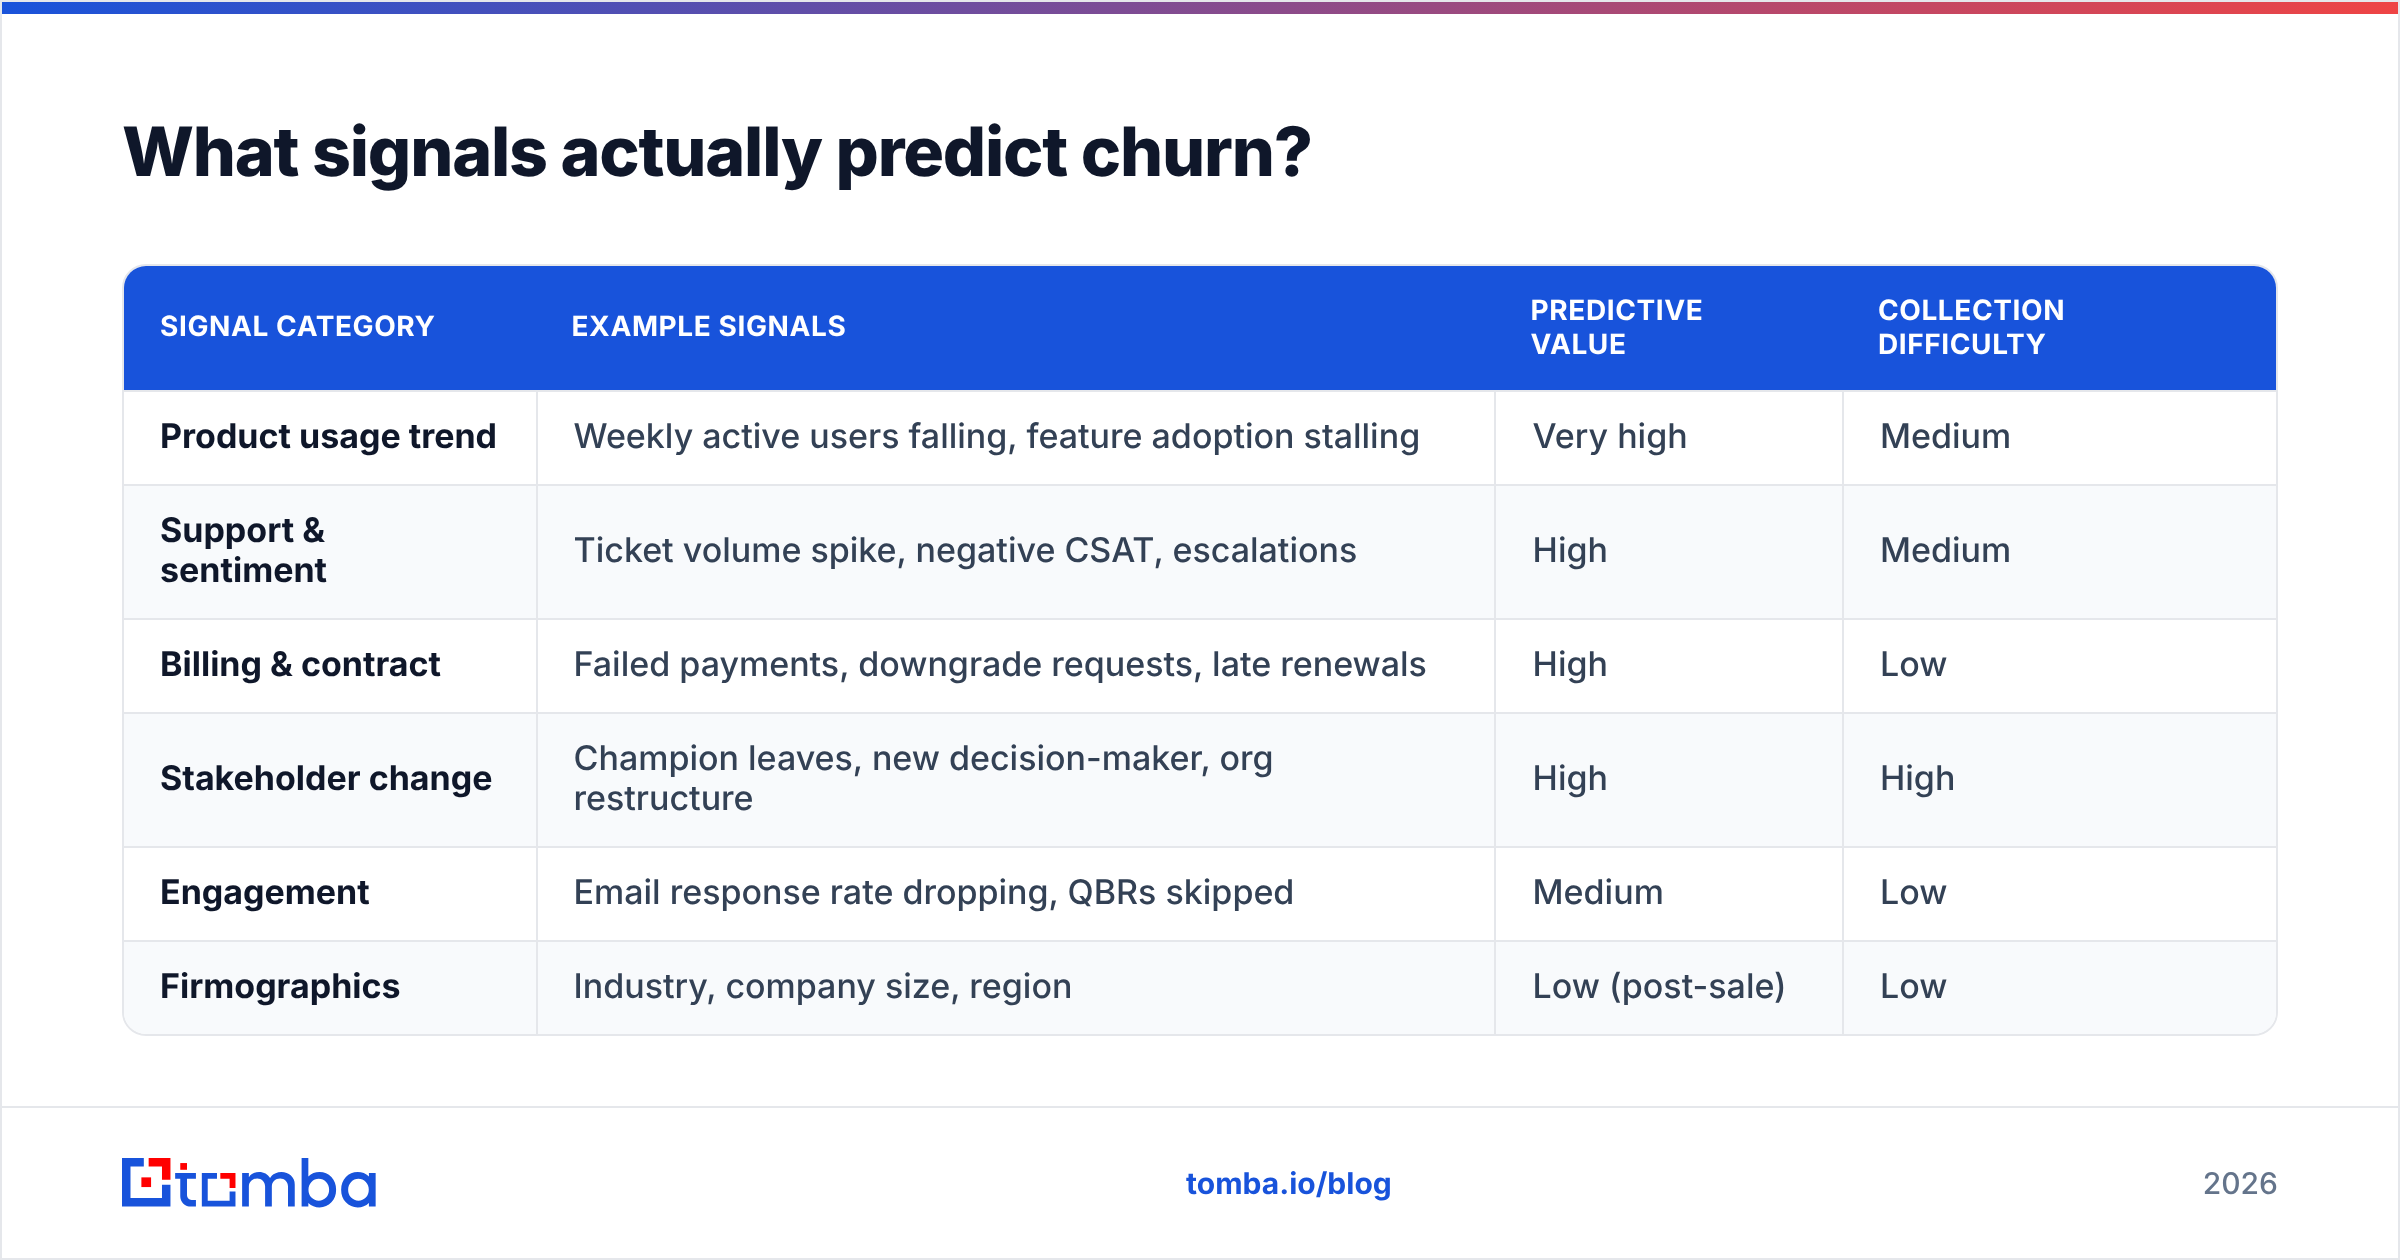
Here's how the major signal categories compare on predictive value and how hard they are to collect:
| Signal category | Example signals | Predictive value | Collection difficulty |
|---|---|---|---|
| Product usage trend | Weekly active users falling, feature adoption stalling | Very high | Medium |
| Support & sentiment | Ticket volume spike, negative CSAT, escalations | High | Medium |
| Billing & contract | Failed payments, downgrade requests, late renewals | High | Low |
| Stakeholder change | Champion leaves, new decision-maker, org restructure | High | High |
| Engagement | Email response rate dropping, QBRs skipped | Medium | Low |
| Firmographics | Industry, company size, region | Low (post-sale) | Low |
The single strongest predictor in most B2B models is a declining usage trend, especially among the power users who originally drove adoption. When the three people who logged in daily drop to once a week, the renewal is already in trouble — the cancellation is just a lagging confirmation.
Stakeholder change is the sleeper signal. When your champion changes jobs, the account loses its internal advocate, and renewal risk jumps regardless of how healthy usage looks. Catching this requires fresh contact data — knowing when a key contact's role or company changed. That's where keeping records current through ongoing data enrichment pays off: a model that doesn't know your champion left is blind to one of the loudest warning signs there is.
Which churn prediction model should you use?#
Start simpler than your instincts suggest. The model is rarely the bottleneck.
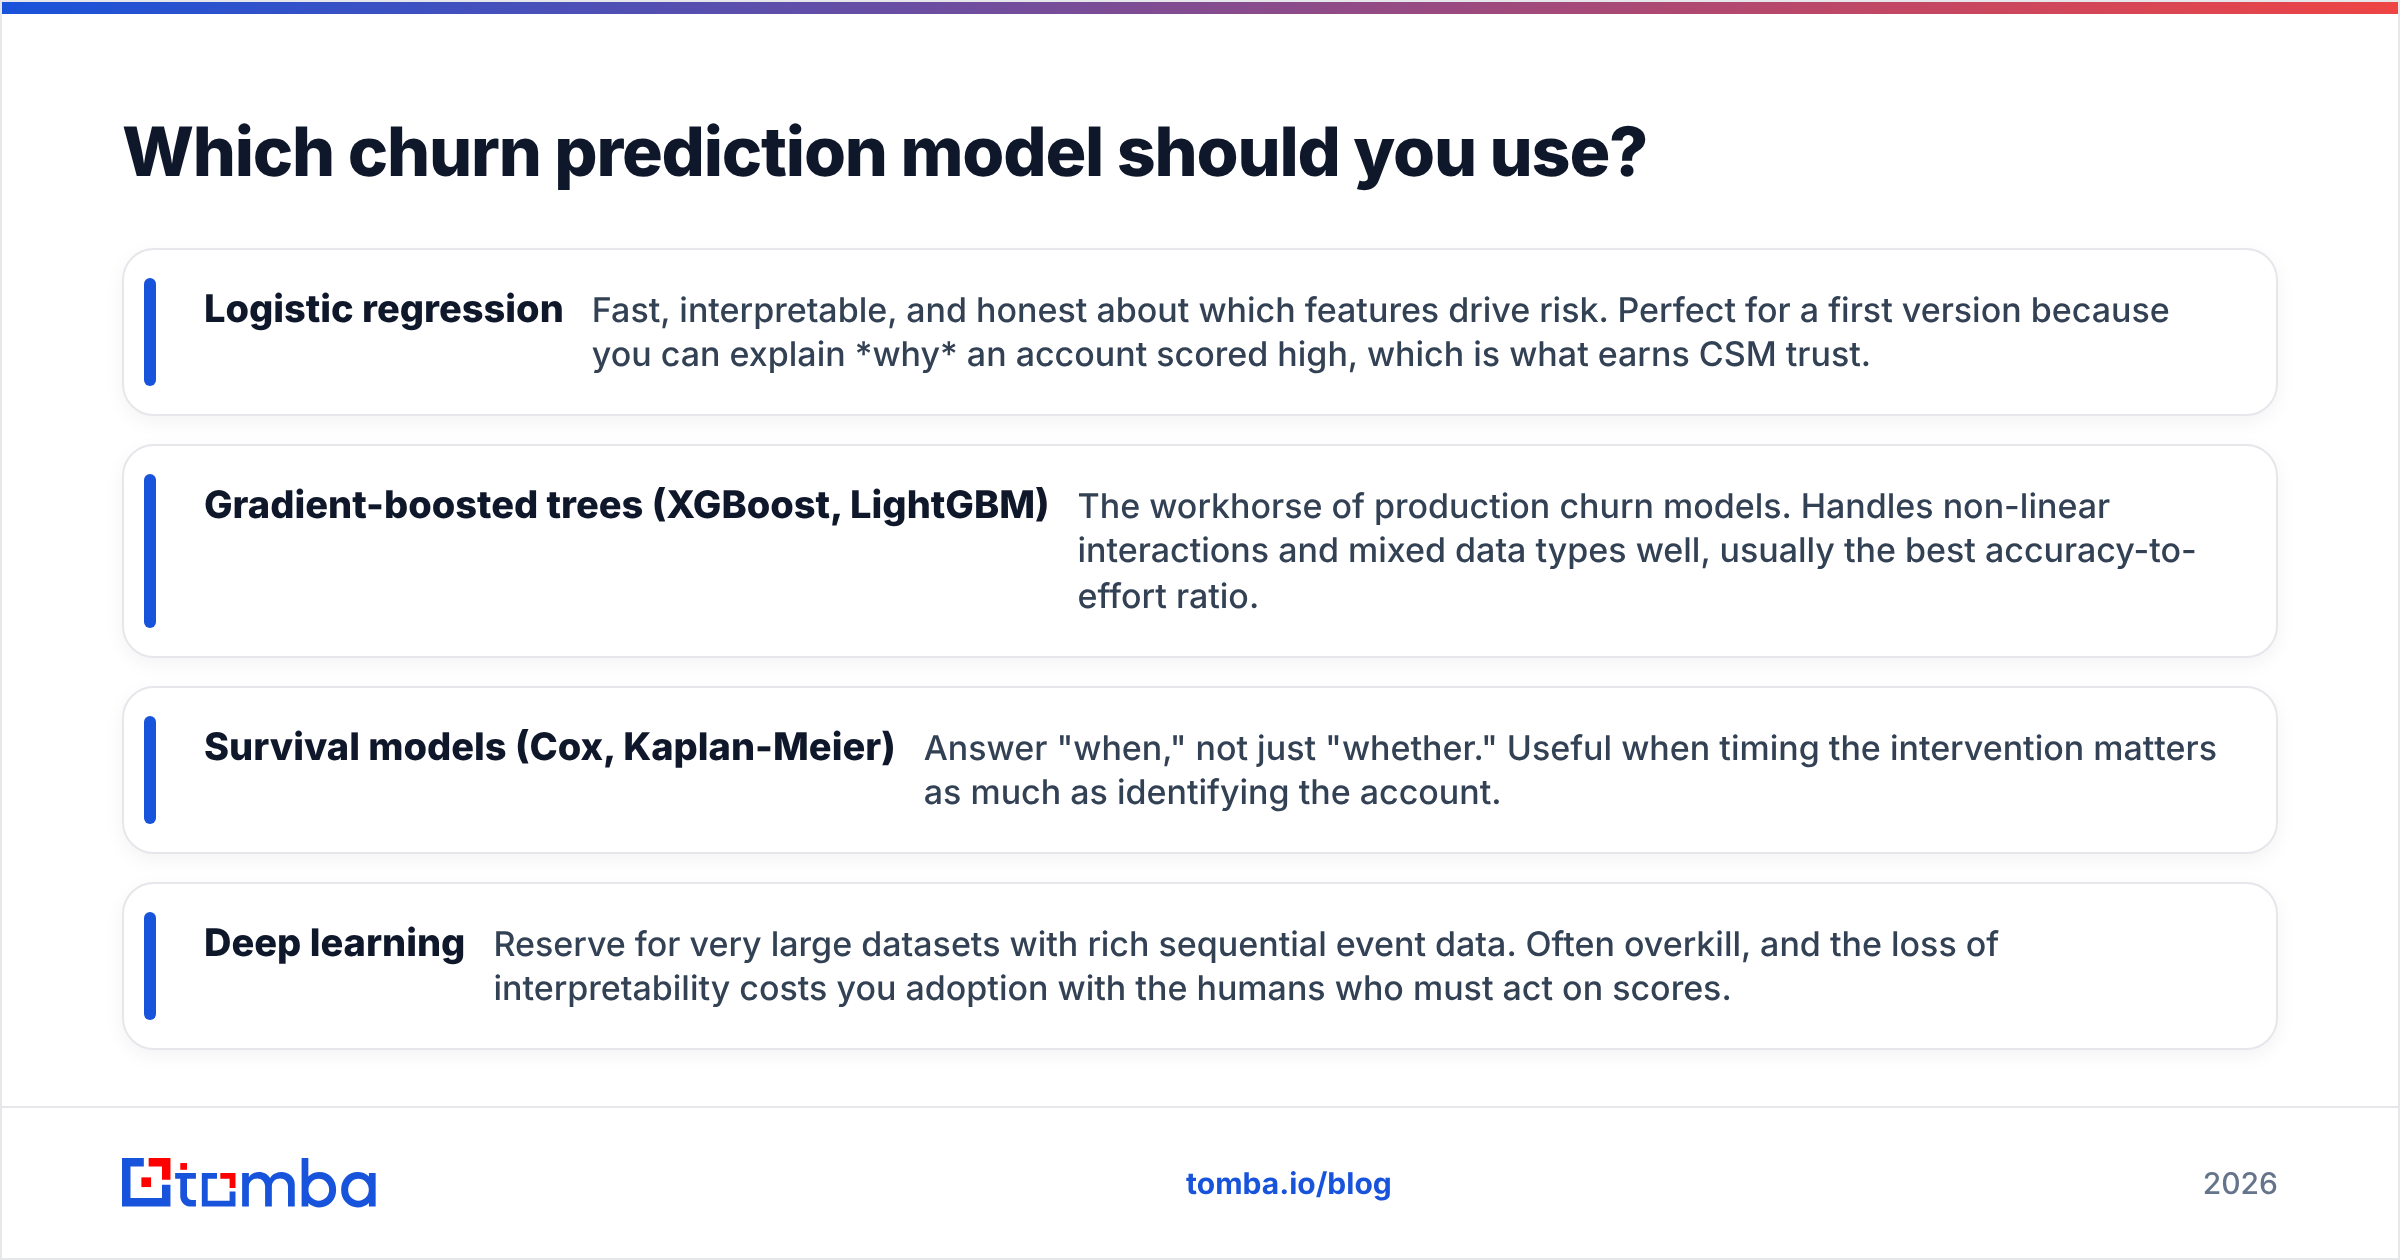
- Logistic regression — Fast, interpretable, and honest about which features drive risk. Perfect for a first version because you can explain why an account scored high, which is what earns CSM trust.
- Gradient-boosted trees (XGBoost, LightGBM) — The workhorse of production churn models. Handles non-linear interactions and mixed data types well, usually the best accuracy-to-effort ratio.
- Survival models (Cox, Kaplan-Meier) — Answer "when," not just "whether." Useful when timing the intervention matters as much as identifying the account.
- Deep learning — Reserve for very large datasets with rich sequential event data. Often overkill, and the loss of interpretability costs you adoption with the humans who must act on scores.
A practical rule: ship logistic regression first, prove the loop works end to end, then upgrade to boosted trees once you've earned organizational buy-in. A 78%-accurate model that reps actually use beats a 91%-accurate model that sits in a notebook.
How accurate can churn prediction be?#
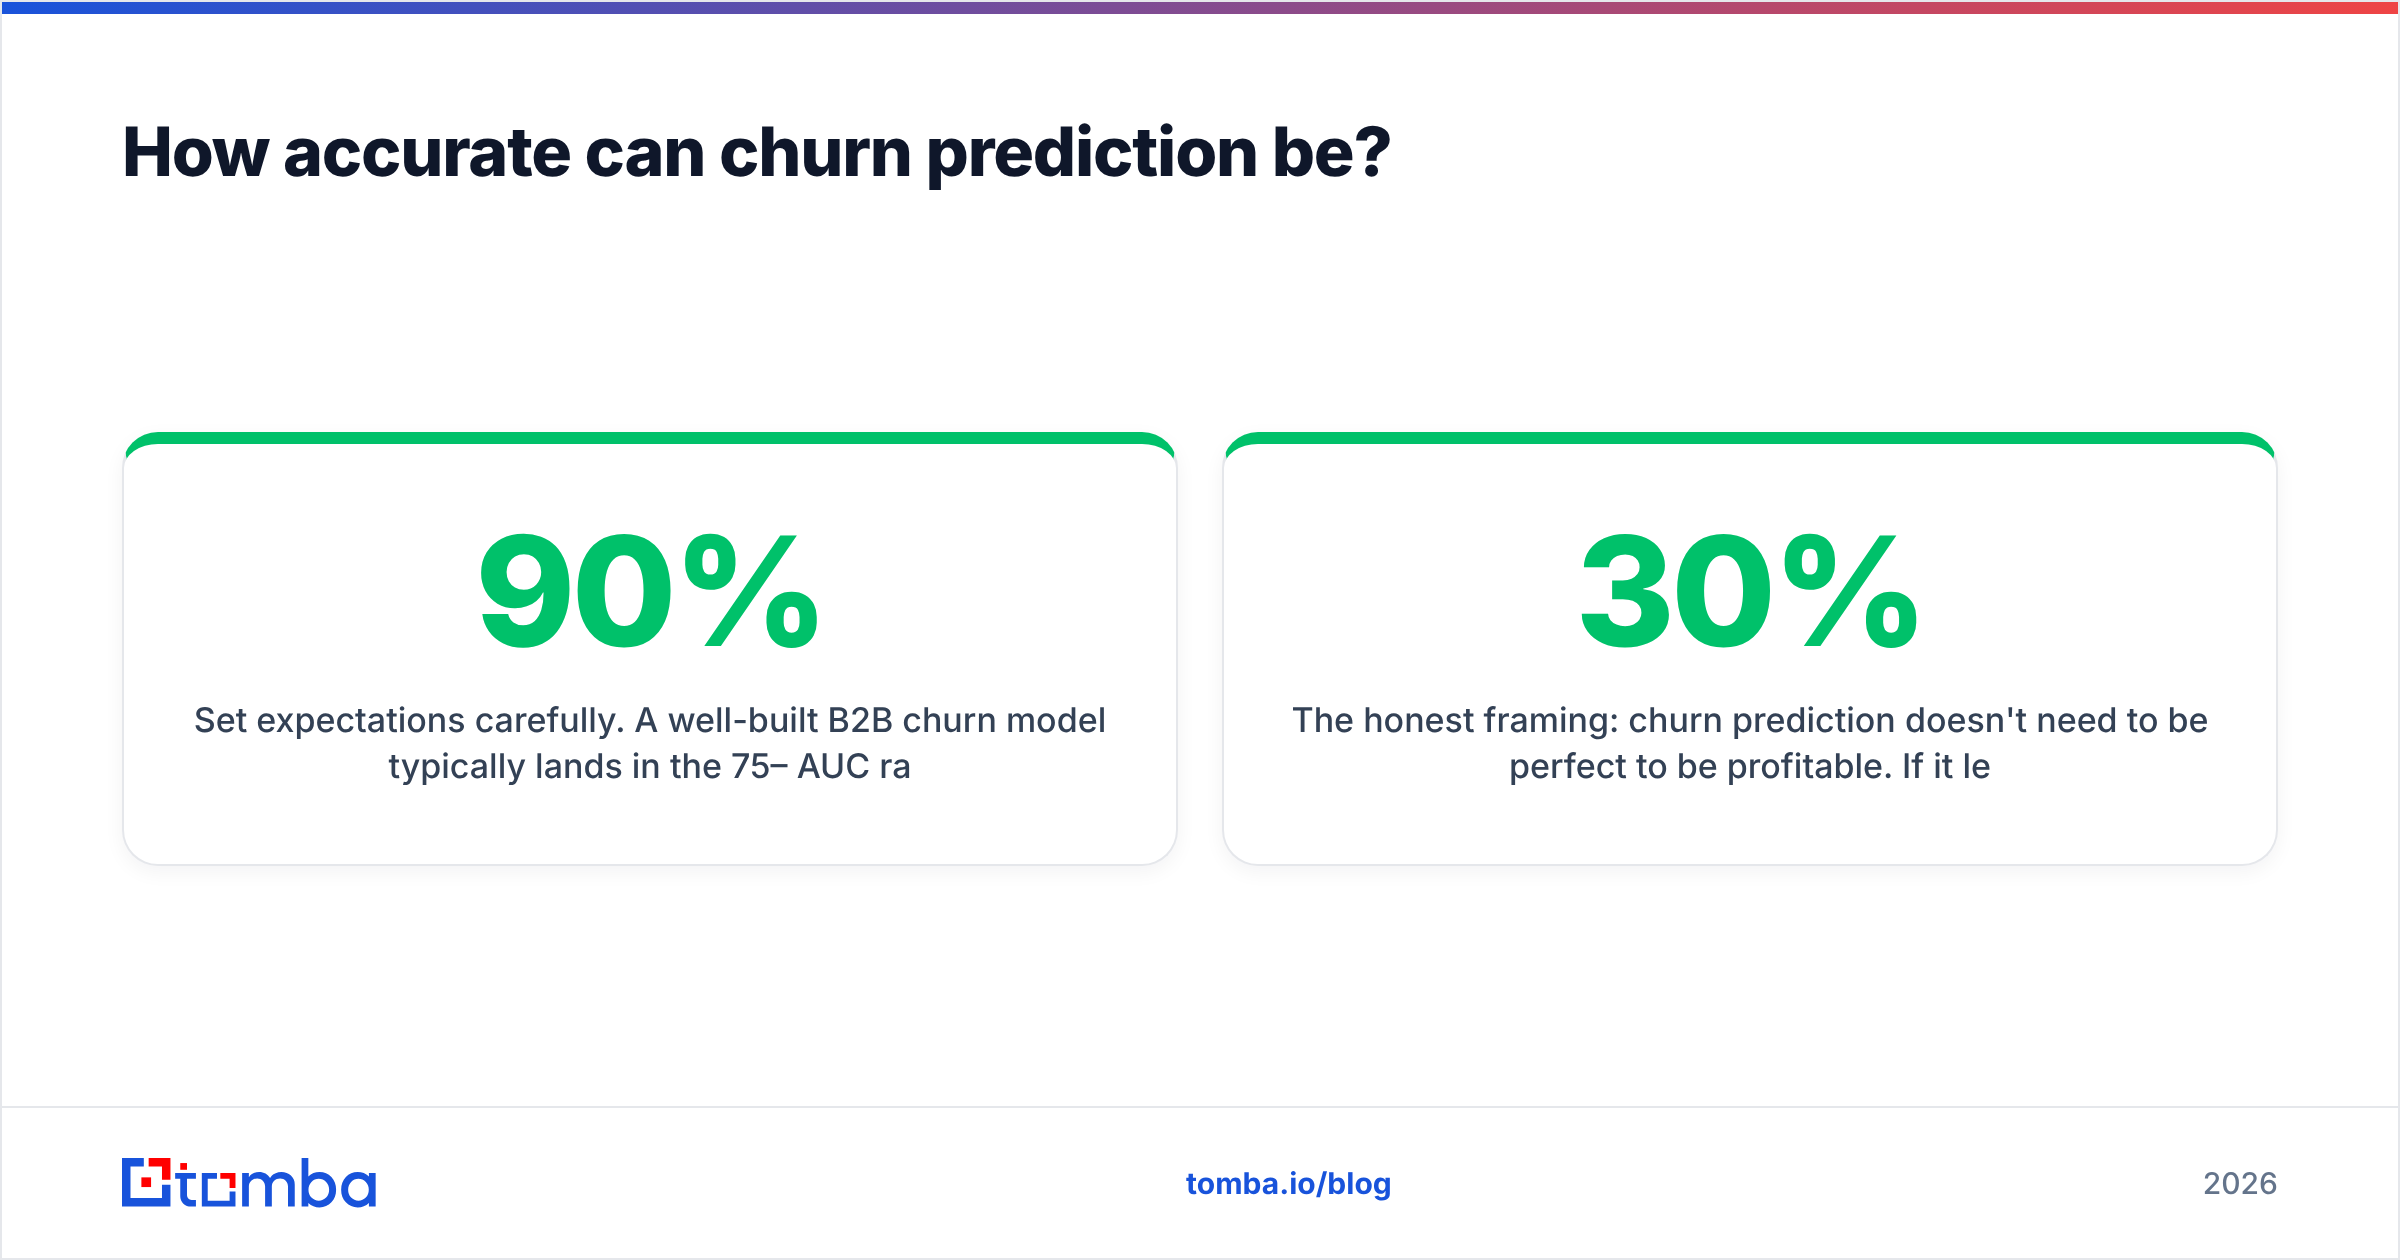
Set expectations carefully. A well-built B2B churn model typically lands in the 75–90% AUC range, but raw accuracy is the wrong headline metric — your classes are imbalanced (most customers don't churn), so a model that predicts "nobody leaves" can be 94% "accurate" and completely useless.
Watch these instead:
- Precision — Of the accounts you flagged as high-risk, how many actually churned? Low precision means you're burning CSM time on false alarms.
- Recall — Of the accounts that churned, how many did you flag in time? Low recall means saves are slipping past you.
- Lead time — How early does the model flag risk? A correct prediction that arrives the day before cancellation is too late to act on.
The honest framing: churn prediction doesn't need to be perfect to be profitable. If it lets your team reach 30% of at-risk revenue a month earlier than gut feel did, it has paid for itself many times over.
How do you turn a churn score into action?#
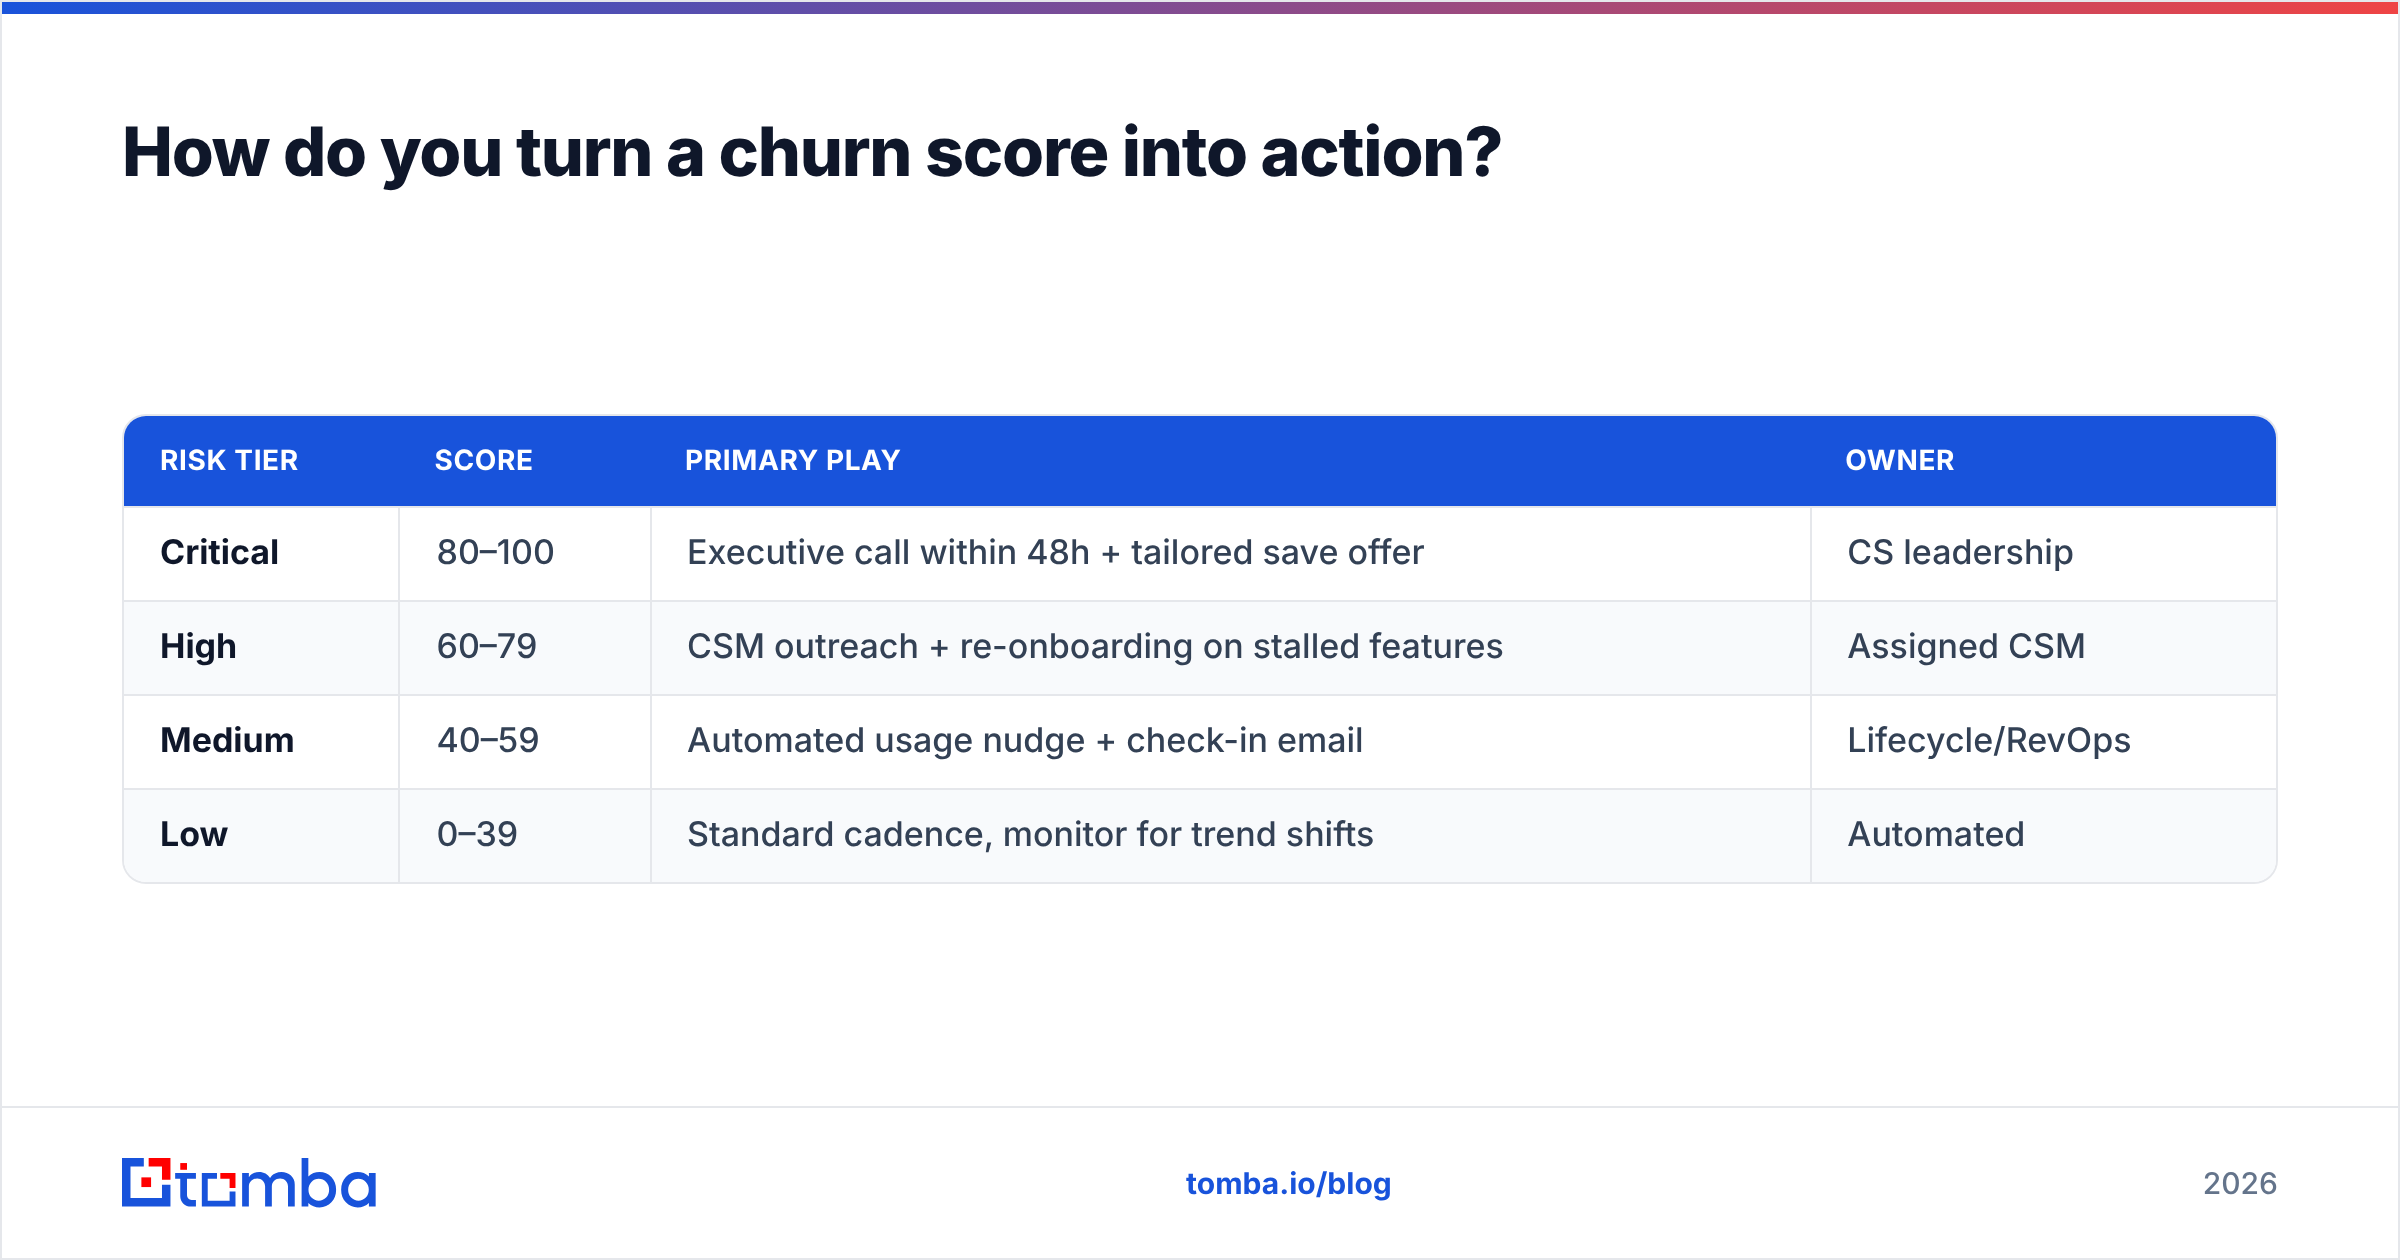
This is where most programs die. The score is not the product — the save is. Tie every risk tier to a default play so a high score automatically triggers a human or automated response.
| Risk tier | Score | Primary play | Owner |
|---|---|---|---|
| Critical | 80–100 | Executive call within 48h + tailored save offer | CS leadership |
| High | 60–79 | CSM outreach + re-onboarding on stalled features | Assigned CSM |
| Medium | 40–59 | Automated usage nudge + check-in email | Lifecycle/RevOps |
| Low | 0–39 | Standard cadence, monitor for trend shifts | Automated |
The mechanics matter. Your churn scores need to live where the team already works — inside the CRM, not a separate BI tool nobody opens. A tight Salesforce integration or HubSpot sync that writes the score and the top risk reasons onto the account record is what converts a model into changed behavior. Vendors like HubSpot and Salesforce have made this kind of write-back trivial compared to a few years ago.
)
One more discipline: always surface the reason alongside the score. "Account at 84 because power-user logins dropped 60% and the champion's email now bounces" gives a CSM a place to start. A naked "84" gives them nothing but anxiety.
What data foundation does churn prediction require?#
A churn model is only as good as the records it reads. Three foundational requirements come before any modeling work:
- Clean, deduplicated accounts. Duplicate or merged records split a customer's signal across two rows, so neither looks risky until both are gone. Run deduplication before you train anything.
- Current contact data. Stale contacts hide the stakeholder-change signal entirely. If your champion left six months ago and your CRM still lists them as active, your model can't see the risk. Verified, enriched contacts close this gap.
- Unified usage + CRM + billing. The predictive signals live in three systems. They have to be joined on a reliable account key, which again depends on clean, consistent records.
This is the unglamorous part, and it's where teams that "tried churn prediction and it didn't work" usually failed. They modeled on dirty data and got dirty predictions. Investing in a reliable B2B database and a repeatable enrichment process does more for model quality than swapping algorithms ever will.
What are the most common churn prediction mistakes?#
- Predicting without acting. A beautiful model with no intervention workflow changes nothing. Build the play before you build the model.
- Leaky labels. If a feature in your training data is a consequence of churn (like a cancellation-survey response), your model will look brilliant in testing and fail in production. Audit every feature for leakage.
- Static scoring. Churn risk is a moving trend. Score weekly, not once a quarter, so you catch the slope before the cliff.
- One global threshold. A $200K enterprise account and a $99/mo self-serve account deserve different intervention thresholds and different plays. Segment your tiers.
- Ignoring the false positives. Every account you flag that wasn't going to churn costs CSM time. Track precision and tune for it, or your team will stop trusting the score.
How does churn prediction fit the wider GTM motion?#
Retention isn't a silo. The same account intelligence that powers churn prediction feeds expansion scoring (who's healthy enough to upsell), advocacy programs (who'll give you a reference), and even acquisition (which won-back signals predict a good re-engagement). A mature RevOps function treats churn, expansion, and acquisition as one data layer with three lenses.
That's also why the contact layer matters beyond retention. The same enriched, verified data that tells you a champion left an account tells your new-business team that the champion just landed somewhere new — a warm opening at a fresh logo. Good data compounds across the whole funnel.
Conclusion: predict early, act fast, keep the data clean#
Churn prediction earns its keep when three things are true: the inputs are clean, the model is simple enough to trust, and every score maps to an action someone actually takes. Skip any one of those and you've built a dashboard, not a retention engine.
The foundation under all of it is data you can rely on — accounts without duplicates, contacts that are current, and stakeholder changes you catch the week they happen instead of the quarter after. That's exactly what Tomba's data tooling is built for. Use the Tomba Email Finder and ongoing contact enrichment to keep every account record fresh, verify your key contacts before a champion's silent departure becomes a surprise cancellation, and feed your churn model the clean inputs it needs to be right. Start free with 25 searches a month, or scale up on the Starter plan at $49/mo — see full Tomba pricing to match a plan to your retention motion. Predict early, act fast, and let clean data do the quiet work.
// get started
Find, verify and enrich your first contacts today
Start on the free plan with 25 searches a month, then scale when your team is ready.
Free plan · No credit card required · GDPR & CCPA
// about the author