Click to Open Rate Industry Average: 2026 Benchmark Guide
What counts as a good click-to-open rate in 2026? See industry-average CTOR benchmarks by sector, how to calculate it, and the levers that actually move the number.
Click to Open Rate Industry Average: 2026 Benchmark Guide
TL;DR
- The click to open rate industry average lands between 10% and 15% across most sectors in 2026, with high-intent niches like software and finance pushing toward 18-20%.
- CTOR (clicks ÷ unique opens) measures whether your content lands — it isolates message quality from subject-line performance.
- Apple Mail Privacy Protection has inflated open rates since 2021, which makes CTOR a more honest engagement metric than open rate alone.
- The biggest hidden drag on CTOR is a dirty list: bounces and spam-trap hits depress deliverability long before anyone clicks.
- You lift CTOR with relevance, one clear CTA, mobile-first design, and a verified, well-segmented audience — not by blasting more volume.
What is click to open rate (CTOR)?#
Click-to-open rate is the percentage of people who clicked a link after opening your email. Think of it like a store: open rate counts how many people walked through the door, but CTOR counts how many actually picked something off the shelf. It tells you whether the inside of the email — the offer, the copy, the layout — did its job.
The formula is simple:
CTOR = (Unique clicks ÷ Unique opens) × 100
So if 1,000 people opened your email and 130 clicked, your CTOR is 13%. That's different from click-through rate (CTR), which divides clicks by total emails delivered. CTR blends two separate problems — getting opened and getting clicked — into one number. CTOR strips out the subject-line variable so you can judge the body of the message on its own merits.
Here's why that distinction matters in 2026: since Apple rolled out Mail Privacy Protection, a large share of "opens" are machine pre-fetches, not humans. Inflated opens make open rate noisy. CTOR, anchored to a real click, is harder to fake and gives you a cleaner read on engagement.

What is the click to open rate industry average in 2026?#
Short answer: most teams should expect a CTOR between 10% and 15%. Anything above 15% is strong, and below 8% signals a content or targeting problem. Averages shift by industry because buyer intent, send frequency, and list hygiene differ wildly between, say, a SaaS newsletter and a retail flash-sale blast.
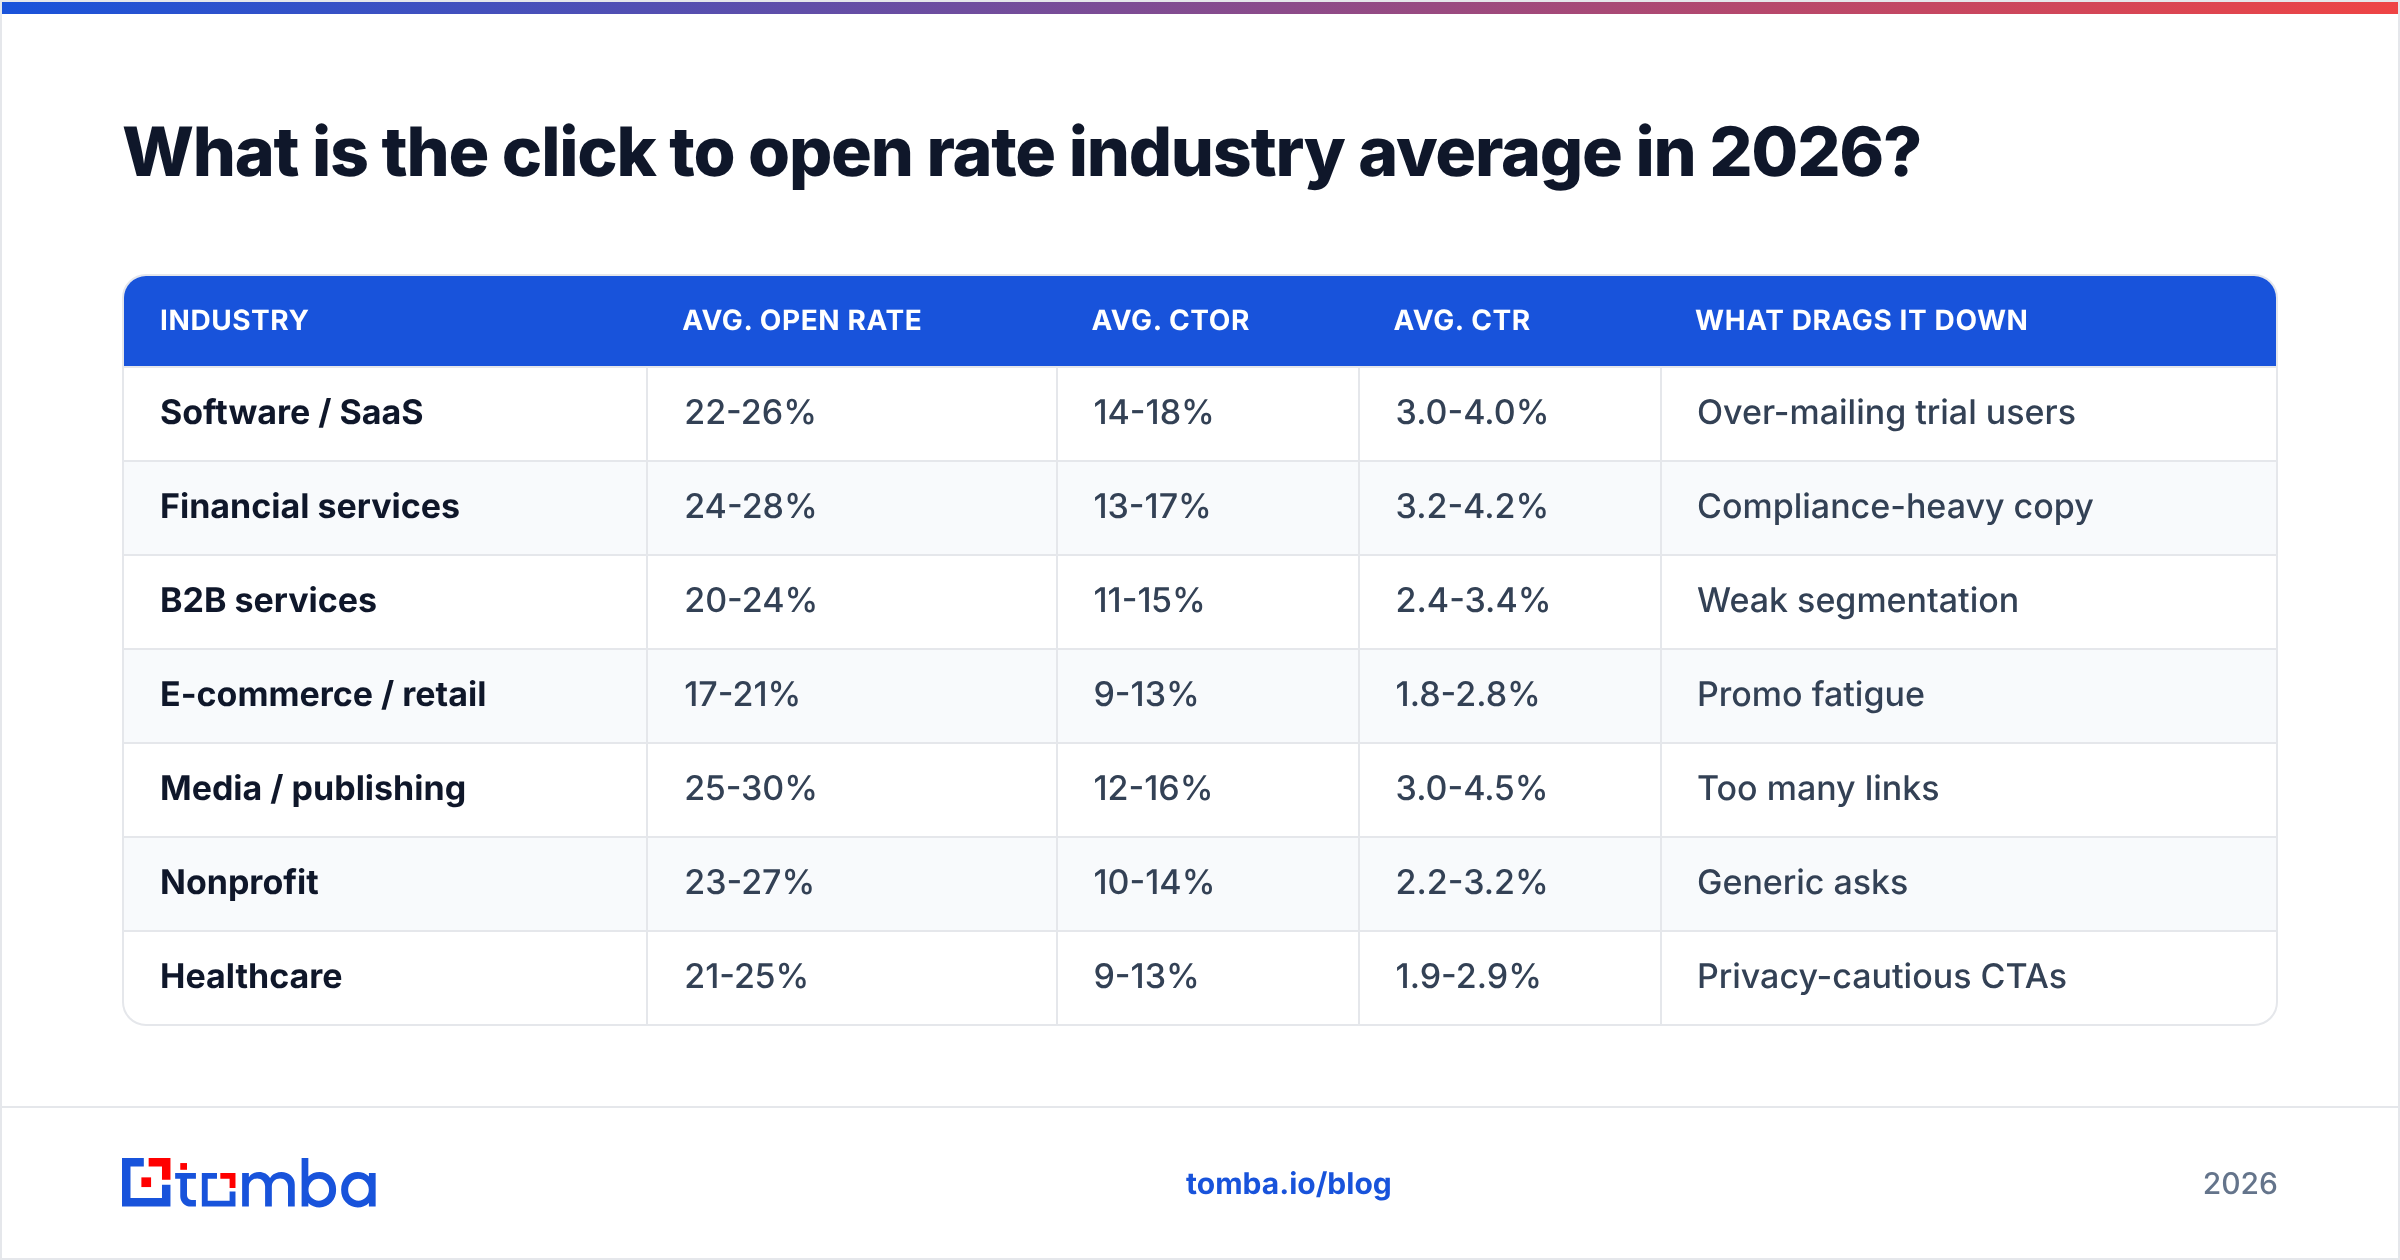
The table below collects representative 2026 benchmark ranges. Treat them as goalposts, not gospel — your own 90-day trend line matters more than any external number.
| Industry | Avg. open rate | Avg. CTOR | Avg. CTR | What drags it down |
|---|---|---|---|---|
| Software / SaaS | 22-26% | 14-18% | 3.0-4.0% | Over-mailing trial users |
| Financial services | 24-28% | 13-17% | 3.2-4.2% | Compliance-heavy copy |
| B2B services | 20-24% | 11-15% | 2.4-3.4% | Weak segmentation |
| E-commerce / retail | 17-21% | 9-13% | 1.8-2.8% | Promo fatigue |
| Media / publishing | 25-30% | 12-16% | 3.0-4.5% | Too many links |
| Nonprofit | 23-27% | 10-14% | 2.2-3.2% | Generic asks |
| Healthcare | 21-25% | 9-13% | 1.9-2.9% | Privacy-cautious CTAs |
A few patterns hold across every row. First, high-intent industries (software, finance) lead because subscribers opted in to solve a concrete problem. Second, sectors that lean on heavy promotional cadence (retail, media) see CTOR erode as subscribers tune out. Third, the spread inside each industry is enormous — the top quartile of senders often doubles the median, almost entirely on the strength of list quality and relevance.
For deeper context on how providers score your sends, the concept of email deliverability is worth understanding, because a message that lands in spam never gets the chance to be opened or clicked.
How do you calculate click to open rate correctly?#
The math is one line, but the inputs trip people up. Use unique opens and unique clicks, not raw totals — otherwise one enthusiastic subscriber who clicks five times skews the rate.
- Pull unique opens for the campaign (deduplicated by recipient).
- Pull unique clicks (one click per recipient, regardless of how many links they hit).
- Divide clicks by opens, multiply by 100.
- Segment before you judge — a blended account-wide CTOR hides which campaigns win.
- Exclude bot/pre-fetch noise where your ESP supports filtered opens.
- Track the trend, not the snapshot — a single send tells you little; eight weeks tells you a direction.
One caveat worth repeating: because privacy features auto-open emails, your open denominator may be inflated, which can push CTOR artificially down. If your open rate suddenly jumped to 50%+ with no other change, you're likely seeing machine opens, and your CTOR will look worse than reality. Comparing CTOR within the same measurement regime (same ESP settings, same audience) keeps the number honest.
Why is your CTOR below the industry average?#
Most below-average CTOR traces back to one of four root causes: irrelevant content, a cluttered call to action, poor mobile rendering, or a low-quality list. The first three are creative problems. The fourth is a data problem — and it's the one teams underestimate most.
Consider the mechanics. Every invalid address you mail raises your bounce rate. A high bounce rate damages your sender reputation, which nudges more of your valid mail toward the spam folder. Fewer real humans see the email, the engagement signals weaken, and your CTOR — measured only against the opens you do get — reflects an audience that's already been filtered down to the least engaged segment. Clean data is upstream of almost every metric you care about.
This is exactly where front-end hygiene pays off. Running new contacts through an email verifier before the first send strips out the typos, dead mailboxes, and traps that quietly tank deliverability. It's cheaper to remove a bad address than to repair a damaged domain reputation later.
The creative causes are more visible but no less common:
- Too many competing links. A newsletter with 14 links splits attention. The strongest CTORs usually orbit a single primary action.
- Mismatch between subject and body. A curiosity-gap subject that opens onto unrelated content gets the open but loses the click — and trains subscribers to distrust you.
- Walls of text. Most B2B email is now read on mobile. If the CTA sits below three dense paragraphs, it never gets seen.
- Weak offer. Sometimes the content simply isn't worth a click. No design tweak fixes a value problem.
How do you improve click to open rate above the average?#
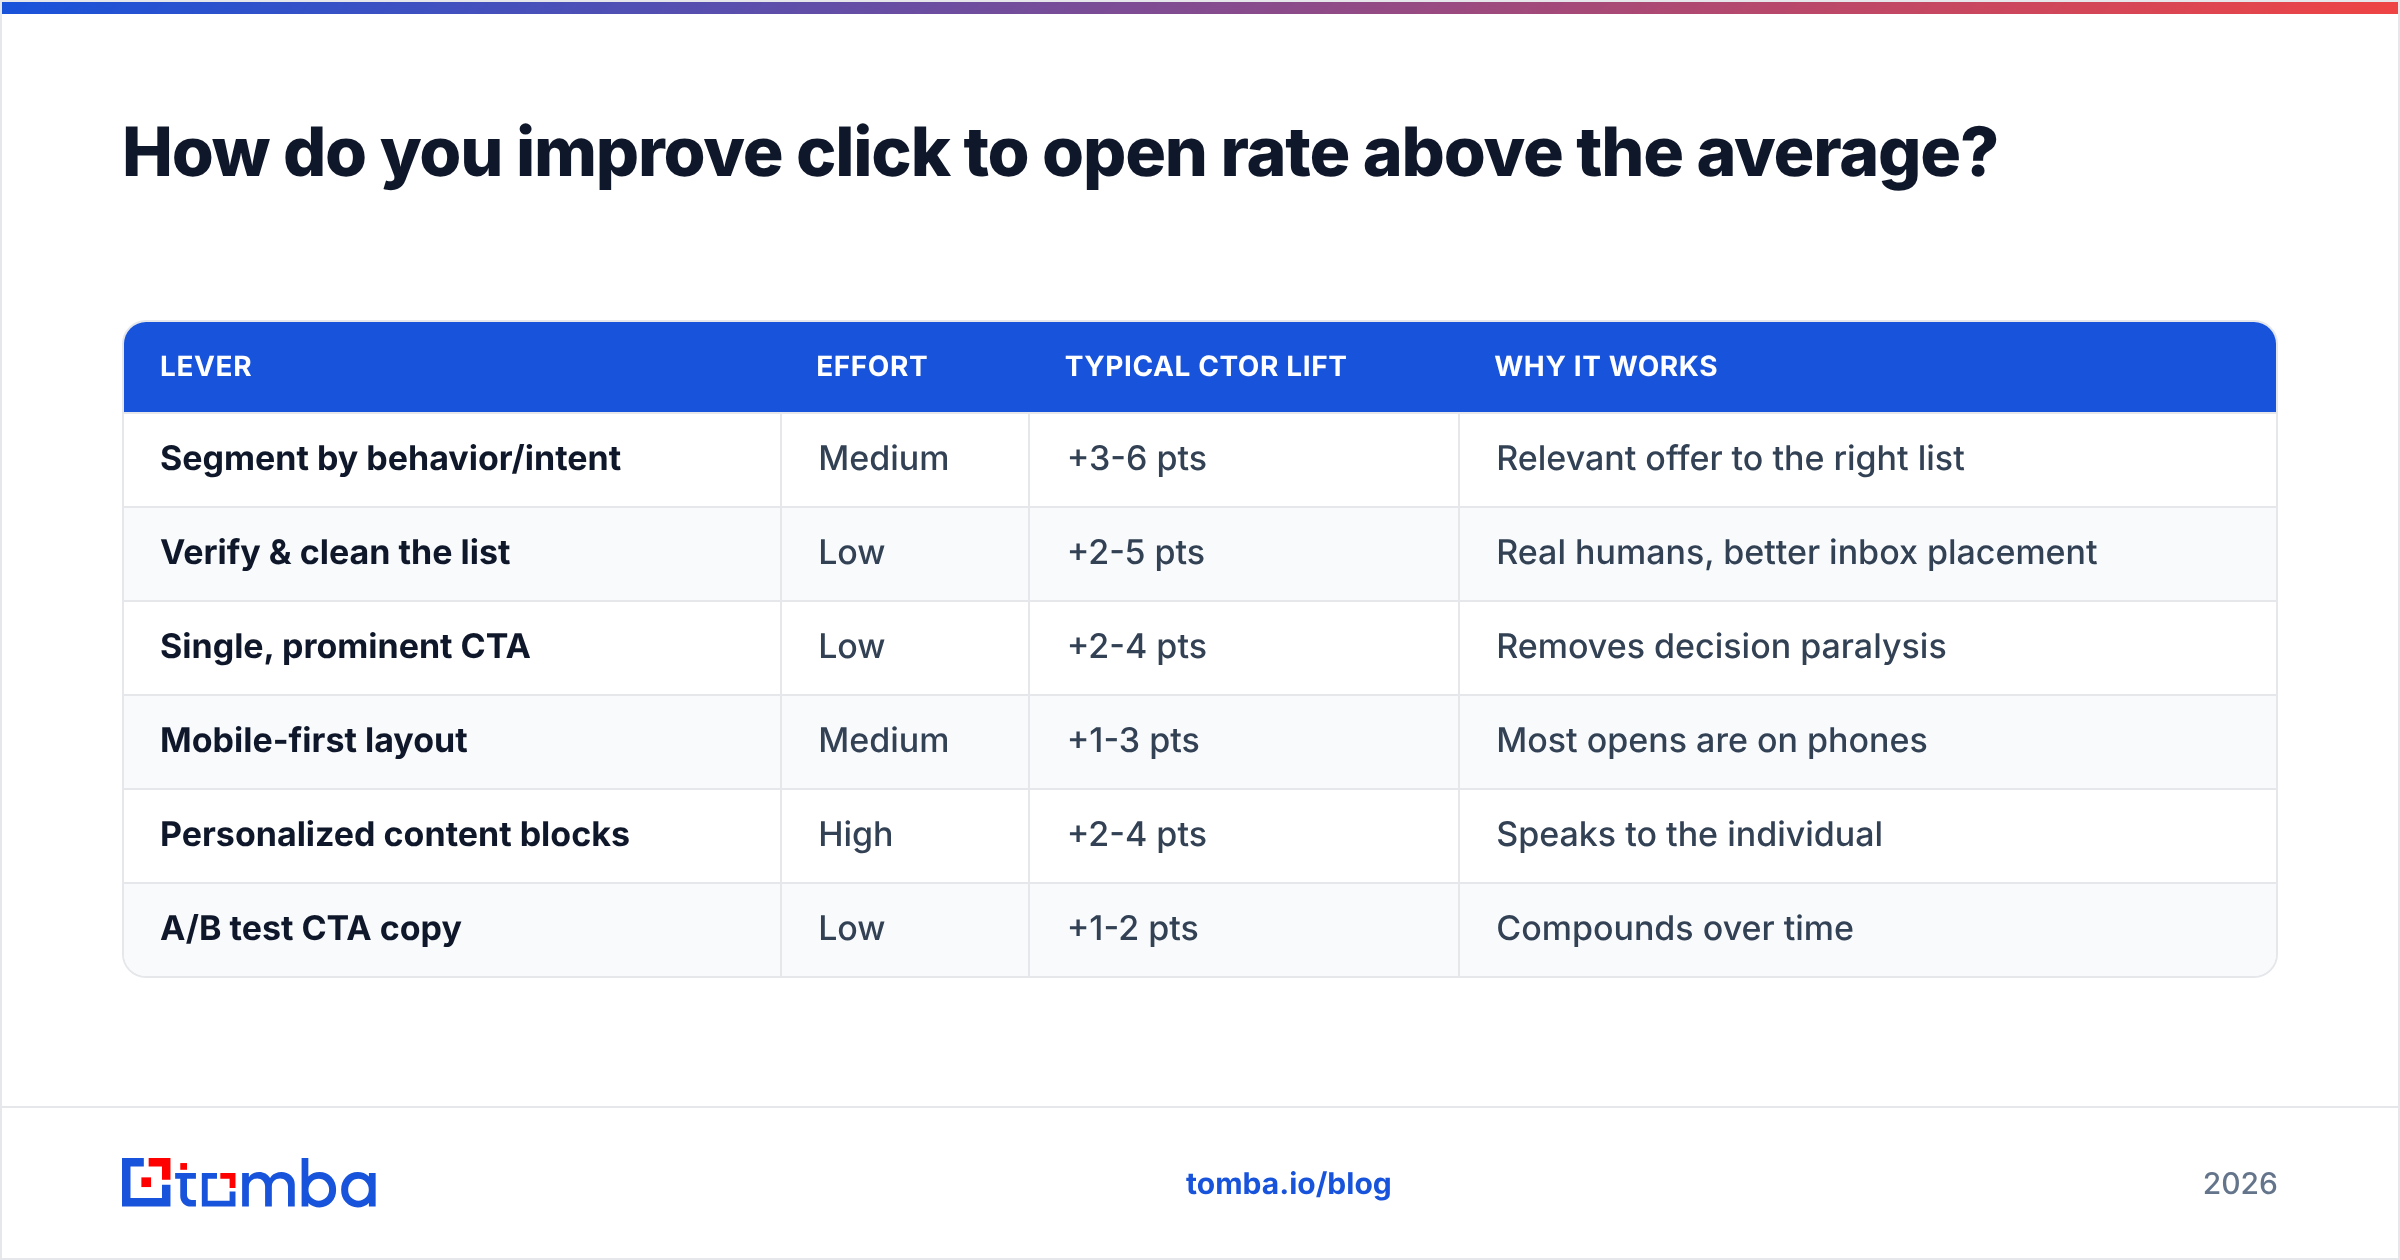
Lift CTOR by improving relevance and reducing friction — in that order. Below are the levers that consistently move the number, ranked by typical impact.
| Lever | Effort | Typical CTOR lift | Why it works |
|---|---|---|---|
| Segment by behavior/intent | Medium | +3-6 pts | Relevant offer to the right list |
| Verify & clean the list | Low | +2-5 pts | Real humans, better inbox placement |
| Single, prominent CTA | Low | +2-4 pts | Removes decision paralysis |
| Mobile-first layout | Medium | +1-3 pts | Most opens are on phones |
| Personalized content blocks | High | +2-4 pts | Speaks to the individual |
| A/B test CTA copy | Low | +1-2 pts | Compounds over time |
Start with segmentation and hygiene because they have the best effort-to-payoff ratio. A behavior-based segment — say, "opened the last three emails but hasn't clicked" — lets you tailor the message to where someone actually is in their journey. Pair that with a verified list and you've removed the two biggest sources of wasted sends.
Then tighten the creative. Give each email one job. If the goal is a demo booking, the whole message should funnel there; resist the urge to bolt on a webinar plug and a blog link. Make the CTA a button, not a buried text link, and put it where a thumb naturally lands. Test the button copy — "Get my benchmark report" almost always beats "Click here."
Personalization is the high-effort, high-ceiling play. Real personalization isn't "Hi {FirstName}" — it's swapping the hero block based on industry, plan tier, or last action. That requires good data on each contact, which is why enrichment matters. Pulling firmographic and role data through data enrichment lets you render genuinely different emails to genuinely different people without hand-building a hundred variants.
If you want the strongest possible baseline, the order of operations is: build the right list, verify it, segment it, then write to the segment. Most teams do this backward — they perfect the copy and mail it to a list that was never any good. For context on industry-standard email metrics and how marketers report them, the annual benchmark studies from HubSpot and Mailchimp are reliable, regularly updated references.
How does list quality affect CTOR versus open rate?#
List quality affects CTOR indirectly but powerfully — it changes who opens in the first place. Open rate tells you how compelling your subject line and sender name are. CTOR tells you whether the people who got that far found something worth acting on. A bad list corrupts both, but it corrupts CTOR in a sneakier way.
Here's the chain reaction. Mail a list full of stale or guessed addresses, and mailbox providers see bounces and low engagement. They respond by throttling you — routing more mail to spam, delaying delivery, or suppressing images. The subscribers who still reliably open are often a thinner, less representative slice of your audience. Your CTOR then reflects that filtered group, and small changes look bigger than they are.
The fix is structural, not cosmetic. Build lists from accurate sources and keep them clean:
- Source good addresses. Tools like a domain search pull real, current emails tied to a company rather than relying on permutation guesses.
- Verify before every major send, and re-verify dormant segments quarterly.
- Sunset chronic non-openers instead of dragging them through every campaign — they depress engagement signals across the board.
- Watch your bounce and complaint rates as leading indicators; CTOR is a lagging one.
When the inputs are clean, CTOR becomes a far more trustworthy diagnostic. You can A/B test copy and actually believe the result, because you're no longer measuring against an audience that's been quietly degraded by deliverability problems.
Tomba vs. generic benchmark tools: what to track#
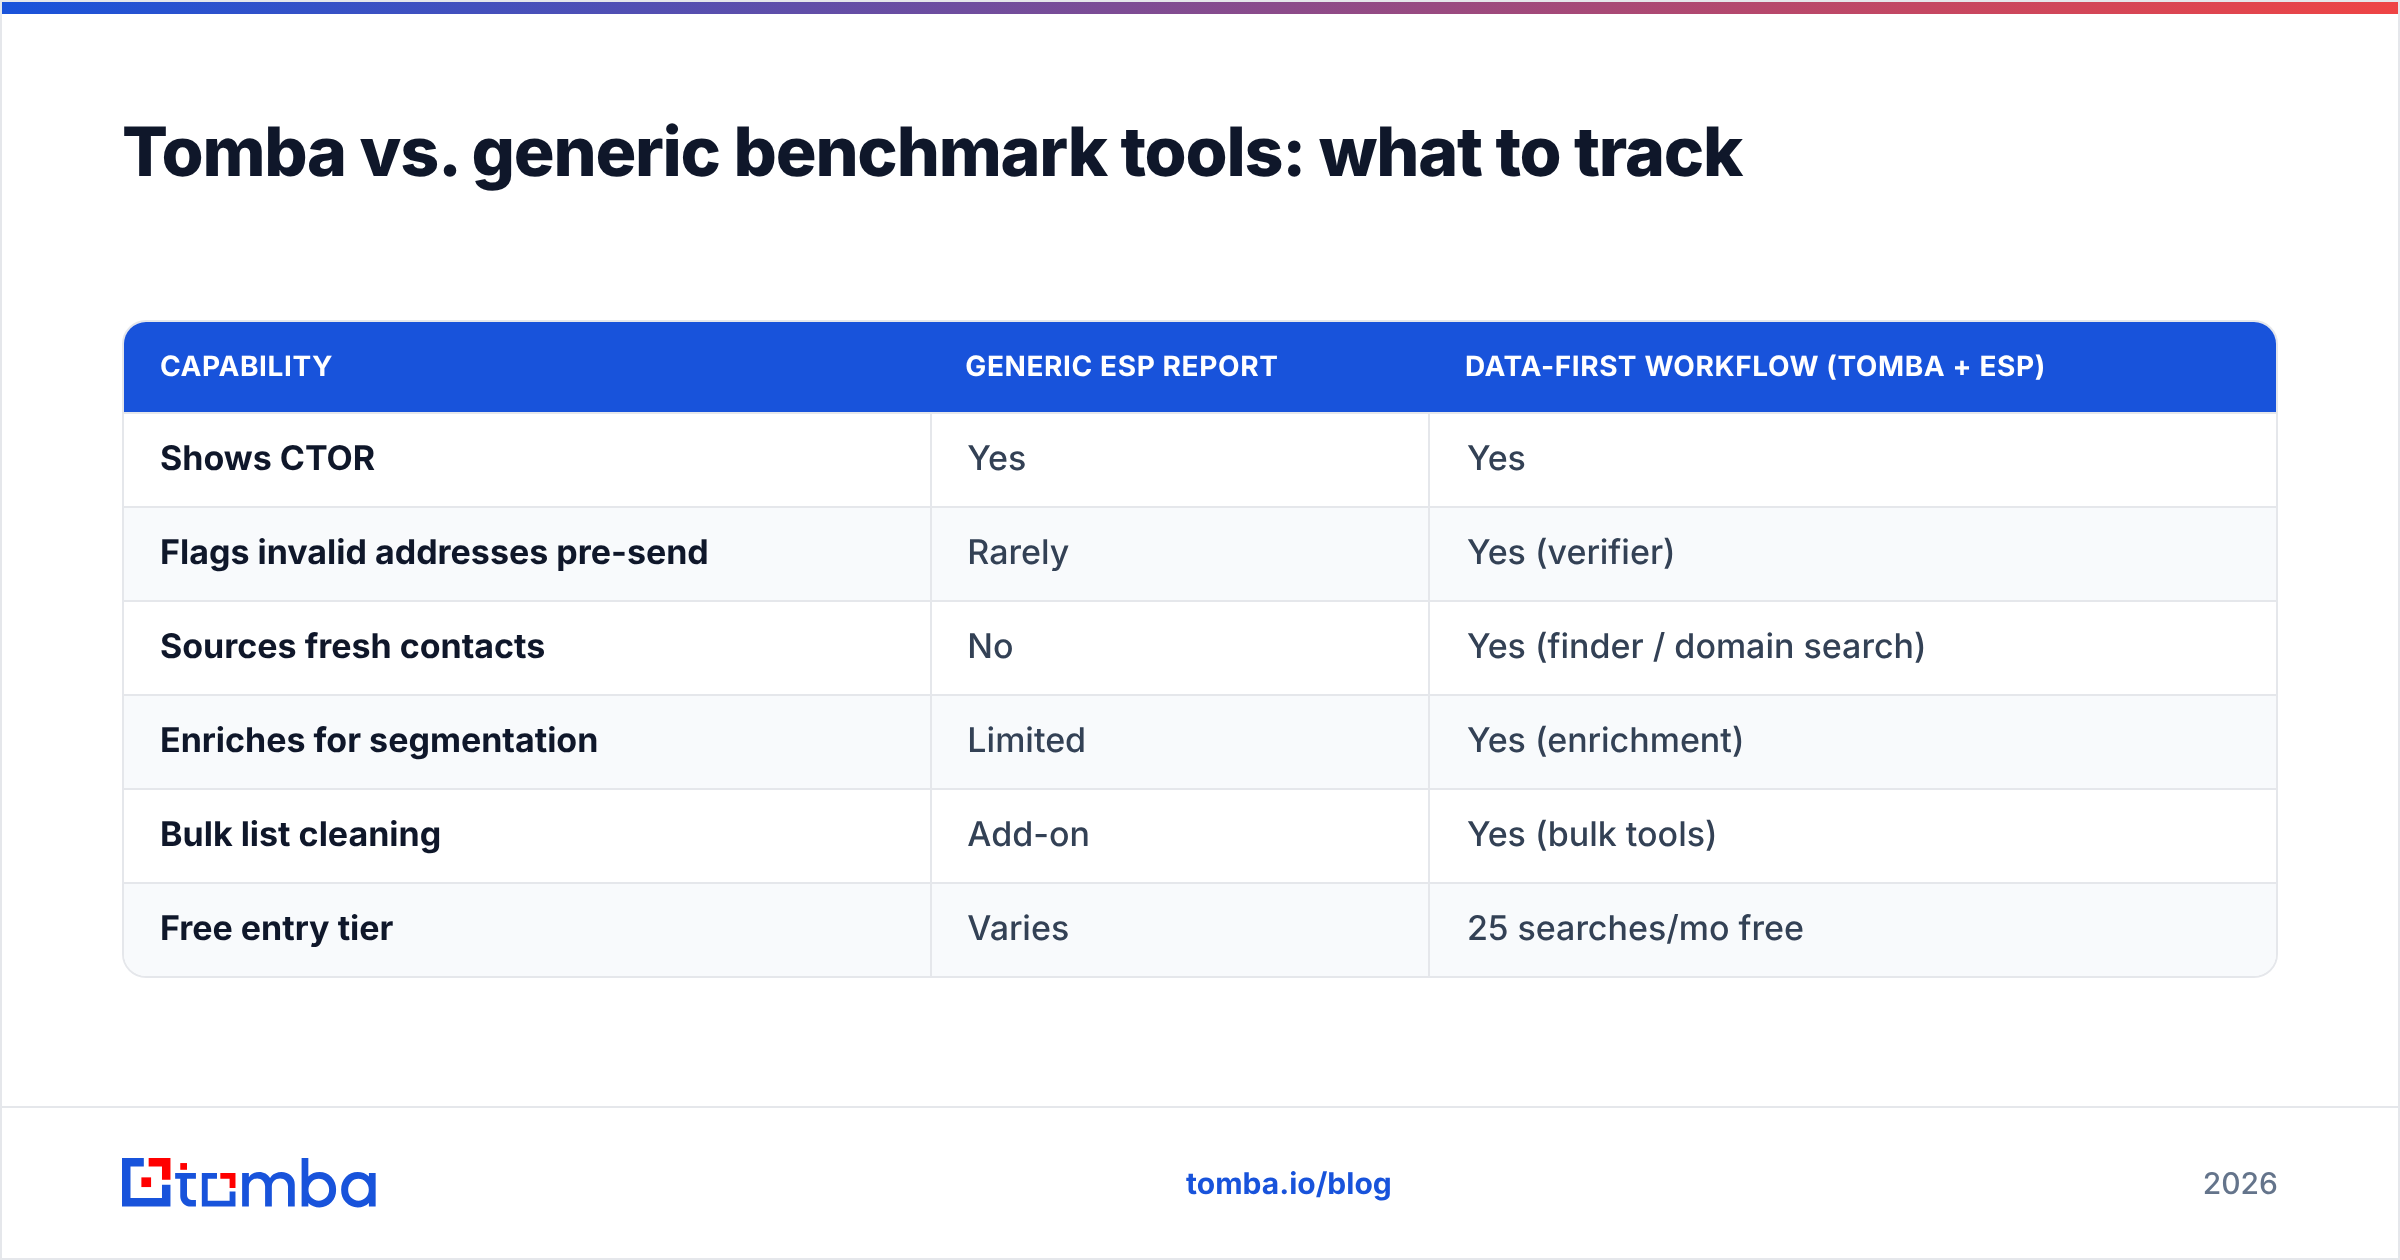
You don't need a dozen dashboards to manage CTOR. You need accurate contact data feeding your ESP, and a clear view of the metric over time. The comparison below frames where data quality fits into the picture.
| Capability | Generic ESP report | Data-first workflow (Tomba + ESP) |
|---|---|---|
| Shows CTOR | Yes | Yes |
| Flags invalid addresses pre-send | Rarely | Yes (verifier) |
| Sources fresh contacts | No | Yes (finder / domain search) |
| Enriches for segmentation | Limited | Yes (enrichment) |
| Bulk list cleaning | Add-on | Yes (bulk tools) |
| Free entry tier | Varies | 25 searches/mo free |
The ESP measures the outcome; the data layer determines the ceiling. If you're comparing options, Tomba's pricing runs from a free tier (25 searches/mo) through Starter at $49/mo, Growth at $99/mo, and Pro at $249/mo — so you can clean and source data without committing to enterprise contracts up front.
What's a realistic CTOR goal for your next quarter?#
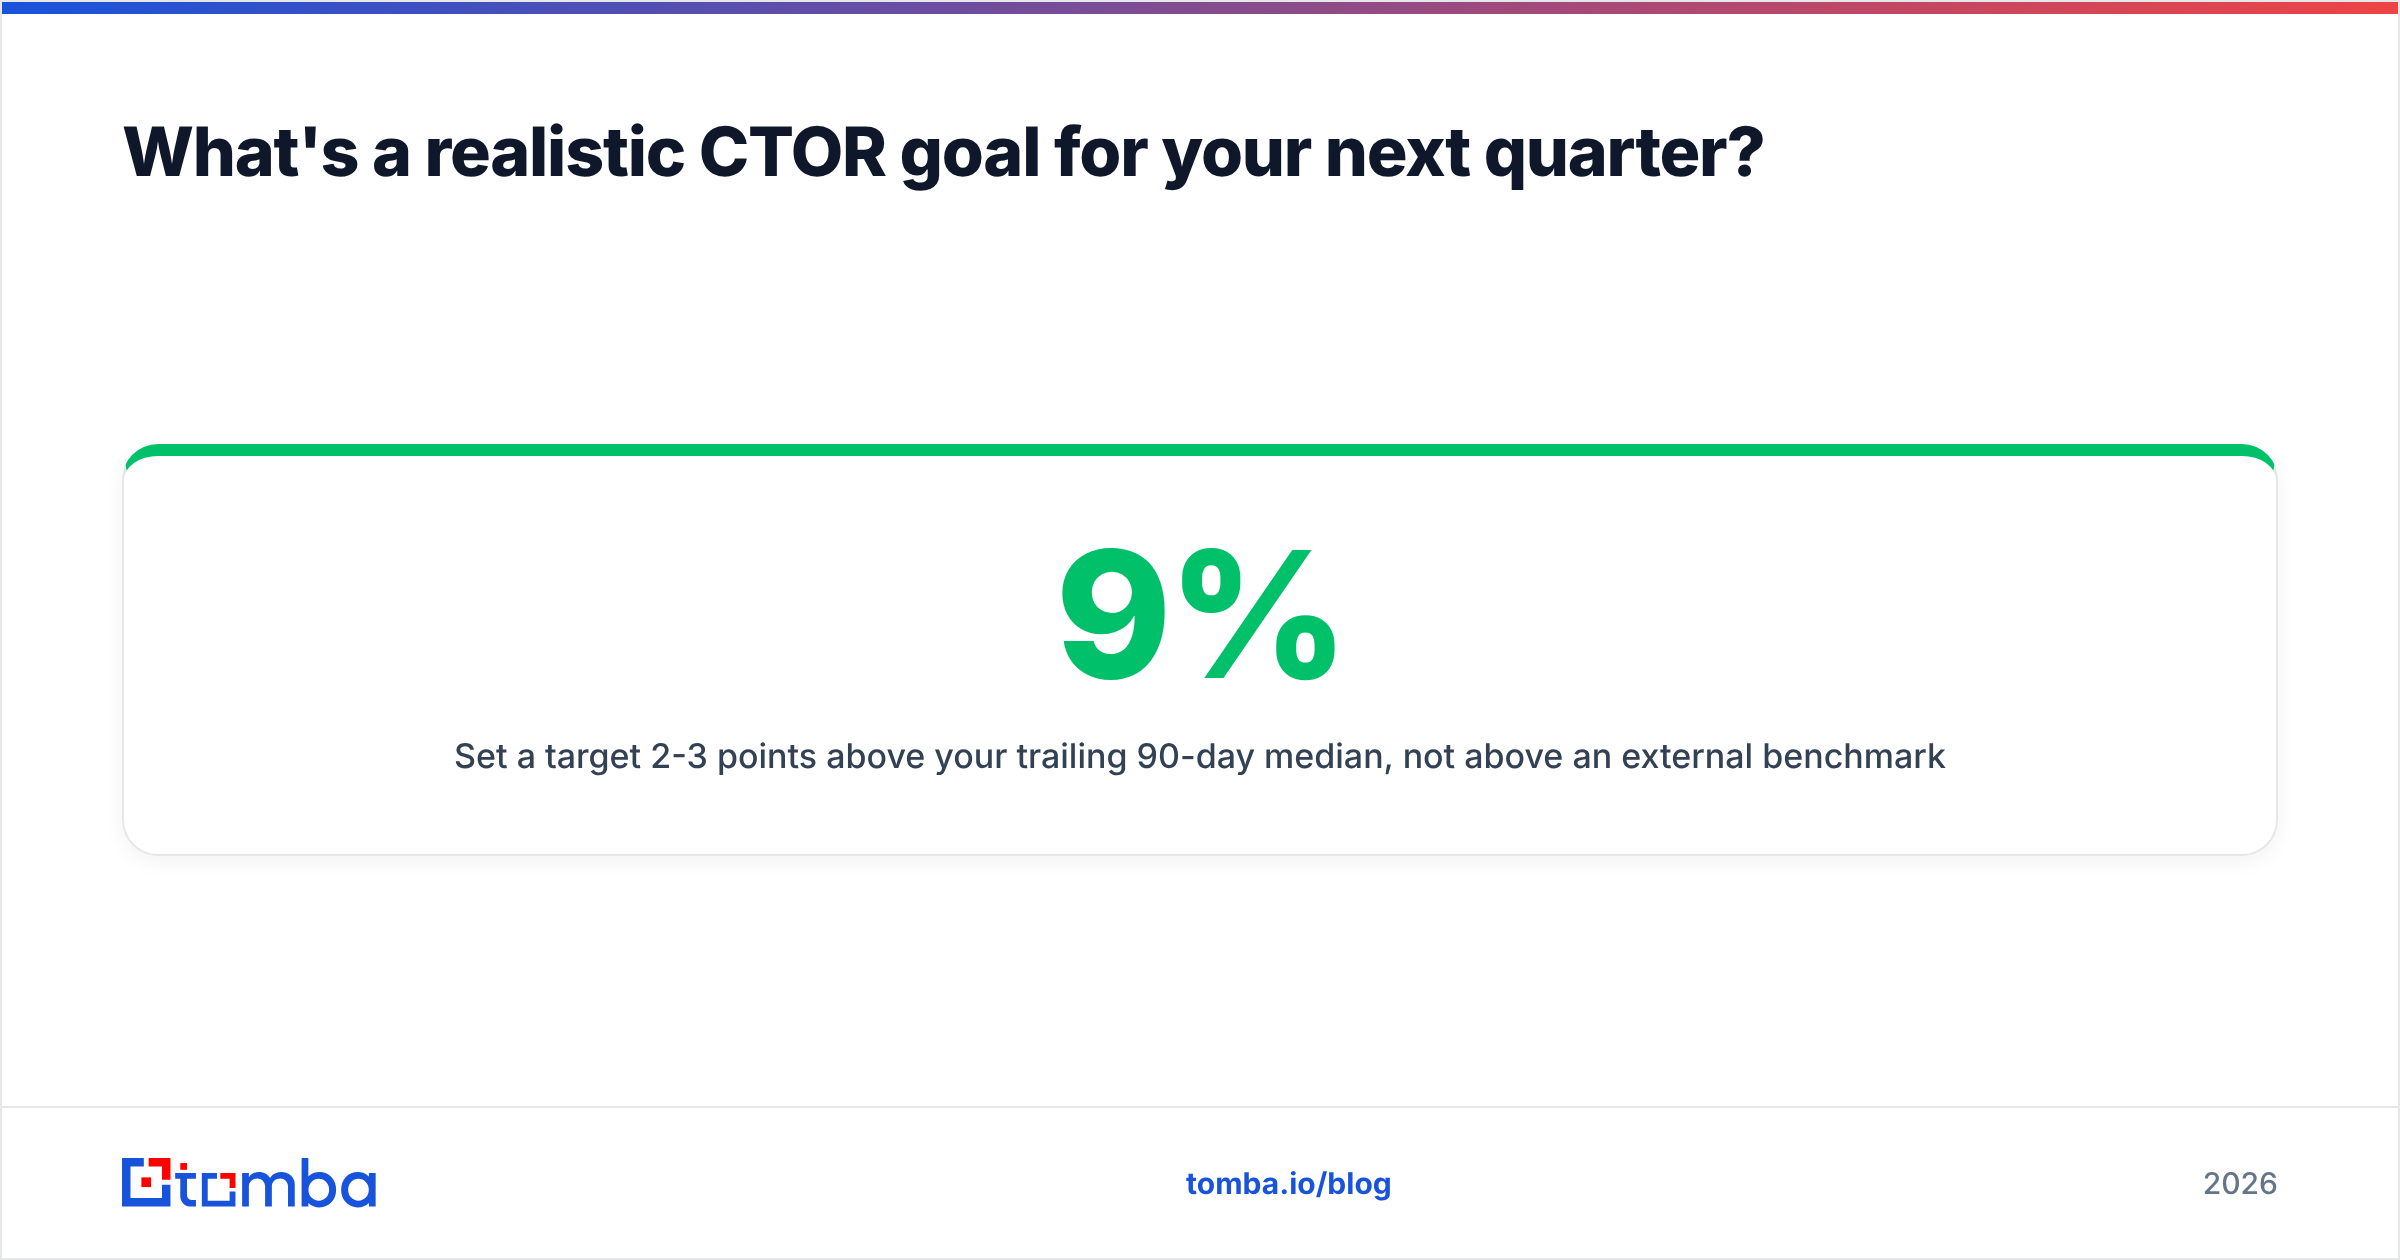
Set a target 2-3 points above your trailing 90-day median, not above an external benchmark. If your account-wide CTOR is 9%, chasing the 18% software benchmark in one quarter is a recipe for frustration. Aim for 11-12%, hit it through hygiene and segmentation, then push again.
Anchor your goal to three things: your starting point, your industry's median from the table above, and the specific lever you're pulling this quarter. A team that commits to verifying its list and consolidating to a single CTA can realistically add 4-6 points over a quarter — most of it from removing dead weight rather than from clever copy.
The throughline of every section here is the same: CTOR rewards relevance, and relevance starts with clean, accurate, well-segmented data. You can't personalize what you can't trust, and you can't reach an audience you never had valid addresses for.
Start with better data#
If your CTOR is stuck below the industry average, the fastest fix usually isn't a new template — it's a better list. The Tomba Email Finder helps you build accurate, verified contact lists by domain, name, or company, so the people you mail are real, reachable, and worth a click. Start free with 25 searches a month, verify what you already have, and watch your click-to-open rate climb because the inbox on the other end actually belongs to a human who wants to hear from you. Clean data first, better benchmarks follow.
// get started
Find, verify and enrich your first contacts today
Start on the free plan with 25 searches a month, then scale when your team is ready.
Free plan · No credit card required · GDPR & CCPA
// about the author