ABM Metrics That Matter in 2026: The Complete Scorecard
Stop drowning in vanity metrics. Here are the ABM metrics that actually predict pipeline, revenue, and account expansion in 2026 — with benchmarks and a scorecard you can copy.
ABM Metrics That Matter in 2026: The Complete Scorecard
TL;DR
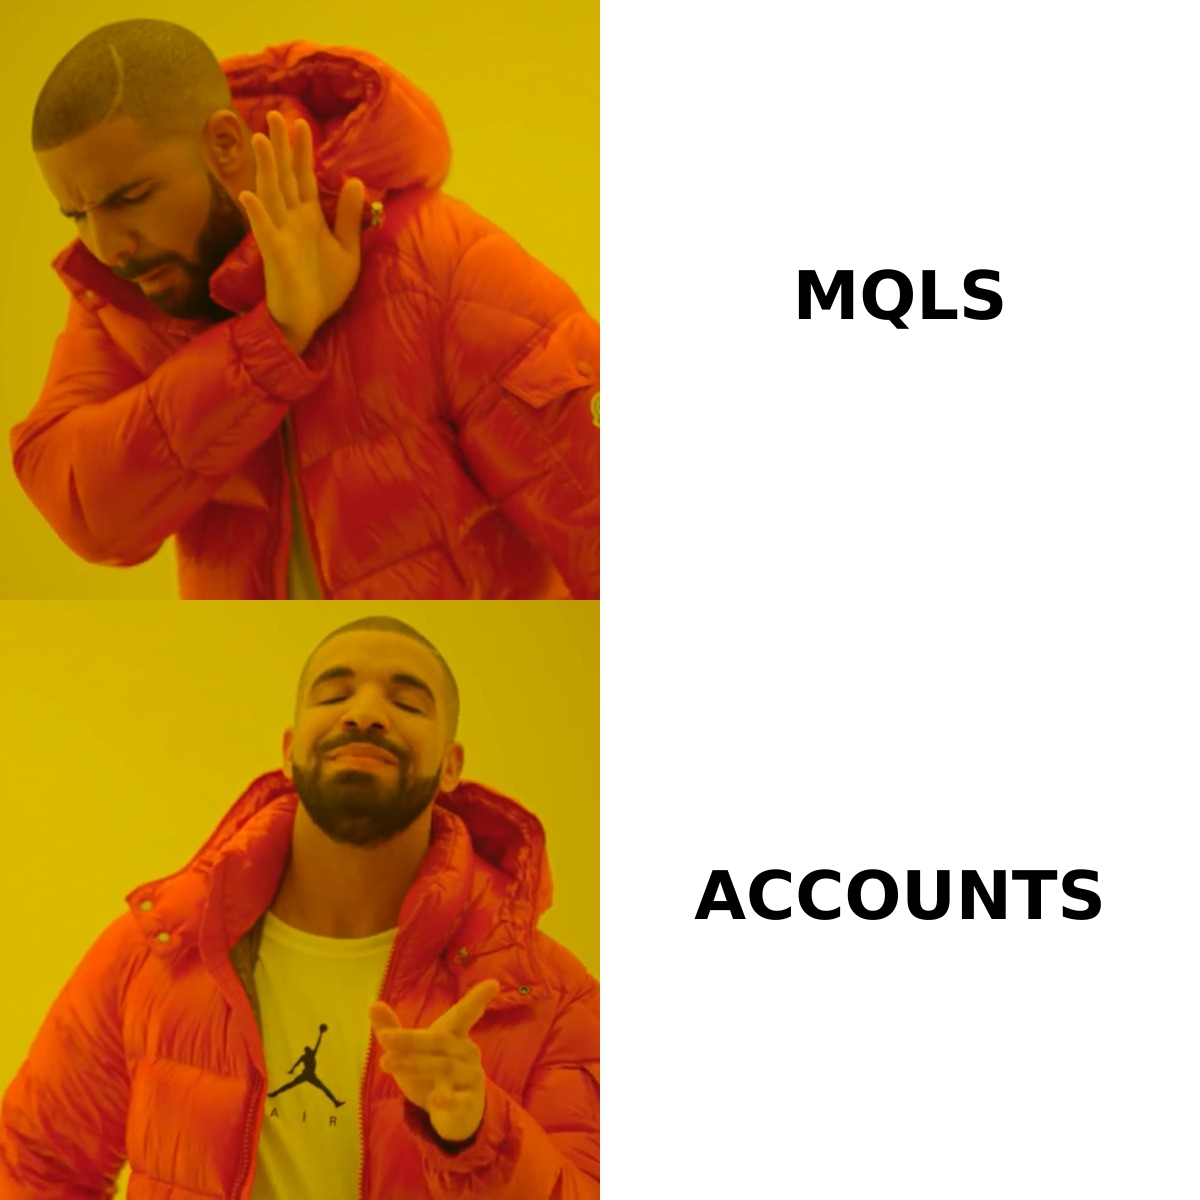
- Most ABM dashboards still measure marketing activity (MQLs, clicks, impressions) instead of account behavior — that's why finance keeps questioning the budget.
- The 12 metrics in this guide split into four tiers: account fit, engagement depth, pipeline contribution, and revenue impact. Skip a tier and your scorecard lies to you.
- The single most predictive ABM metric in 2026 is buying group coverage — the percentage of decision-makers inside a target account whose contact data you actually have. Without coverage, every other metric is noise.
- Benchmarks: ICP fit score ≥ 75, target-account engagement rate 25-40%, opportunity conversion 8-15%, ABM-influenced ACV 2.4x non-ABM ACV.
- Build the scorecard once, review it weekly with sales, and kill any metric you can't tie to a board-level revenue number within two clicks.
Why do most ABM metrics fail in 2026?#
You can run a beautiful ABM program and still get budget cut. The reason is almost always the same: the dashboard measures what marketing did, not what the account did.
CTR on a display ad doesn't tell you if Acme Corp's CFO is closer to signing. A 40% email open rate looks great until you realize Apple's MPP inflated it by 30 points. Last year's MQL goal becomes this year's punchline.
The 2026 ABM stack — clean data from sources like data enrichment APIs, intent signals, and unified CRM views — finally makes it possible to track account behavior directly. So the question stops being "can we measure this?" and becomes "are we measuring the right thing?"
This guide gives you the 12 metrics that survived the cull, organized into a tiered scorecard you can implement in a sprint.
What are the four tiers of an ABM scorecard?#
Think of an ABM scorecard like a doctor's checkup. Pulse, blood pressure, blood work, and outcomes — each tier answers a different question, and skipping one means you miss a diagnosis.
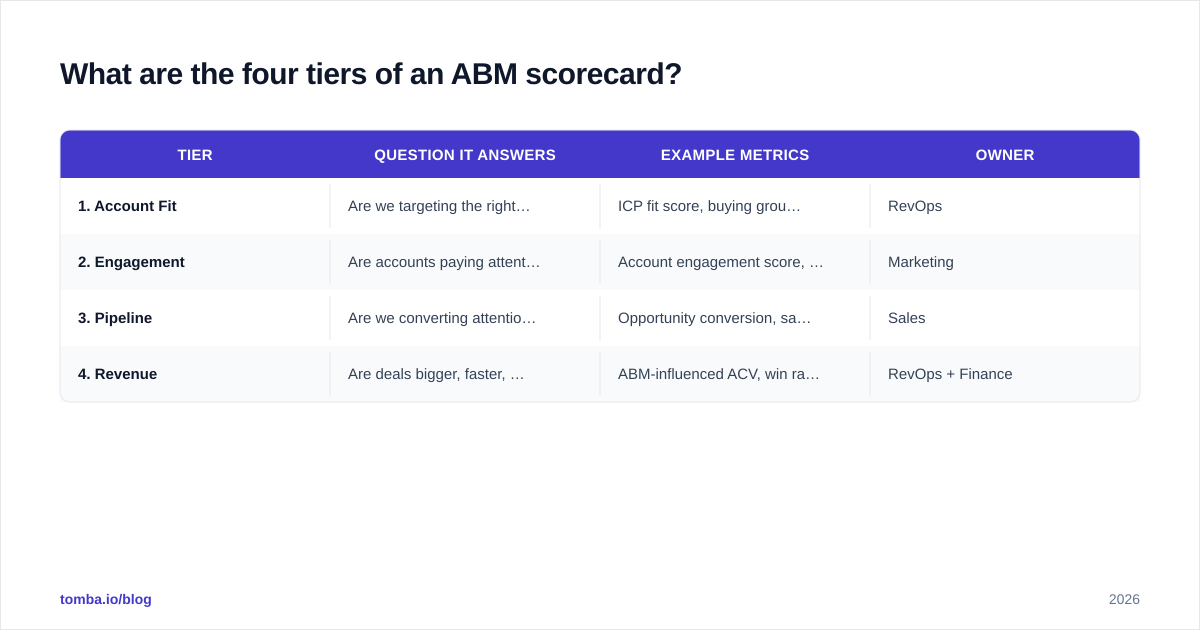
| Tier | Question it answers | Example metrics | Owner |
|---|---|---|---|
| 1. Account Fit | Are we targeting the right companies? | ICP fit score, buying group coverage | RevOps |
| 2. Engagement | Are accounts paying attention? | Account engagement score, intent surge rate | Marketing |
| 3. Pipeline | Are we converting attention to deals? | Opportunity conversion, sales cycle delta | Sales |
| 4. Revenue | Are deals bigger, faster, stickier? | ABM-influenced ACV, win rate, NRR | RevOps + Finance |
Tier 1 metrics are leading indicators. Tier 4 metrics are lagging indicators. If your dashboard only shows tier 4, you'll find out you're failing six months too late. If it only shows tier 1, you'll celebrate "engagement" while pipeline rots.
What is ICP fit score and how do you calculate it?#
ICP fit score answers tier 1: are these the right accounts in the first place?
Take your closed-won customer list from the last 24 months. Find the five attributes that show up most often: industry, employee count, tech stack, funding stage, geography. Weight them. Score every target account on a 0-100 scale.
ICP fit score =
  (industry_match × 25) +
  (size_band_match × 20) +
  (tech_stack_match × 20) +
  (funding_match × 15) +
  (geo_match × 10) +
  (recency_signal × 10)
Benchmark: Accounts scoring 75+ should make up 80% of your active ABM list. If they don't, your SDRs are working leads that statistically won't close, no matter how charming they are.
This is also where clean firmographic data matters. A weak B2B database will misclassify a 2,000-person enterprise as a 50-person startup, and your fit score collapses.
What is buying group coverage and why does it matter most?#
Gartner's research on the B2B buying group — now averaging 11+ stakeholders per enterprise deal — turned ABM measurement upside down. Targeting "the account" is meaningless if you only know one person at it.
Buying group coverage = (verified contacts at target persona roles) ÷ (expected buying group size) × 100
For a typical SaaS sale that means coverage of the economic buyer, the champion, the user, the IT/security gate, and the procurement gate. If you have email + phone for three of five, your coverage is 60%.
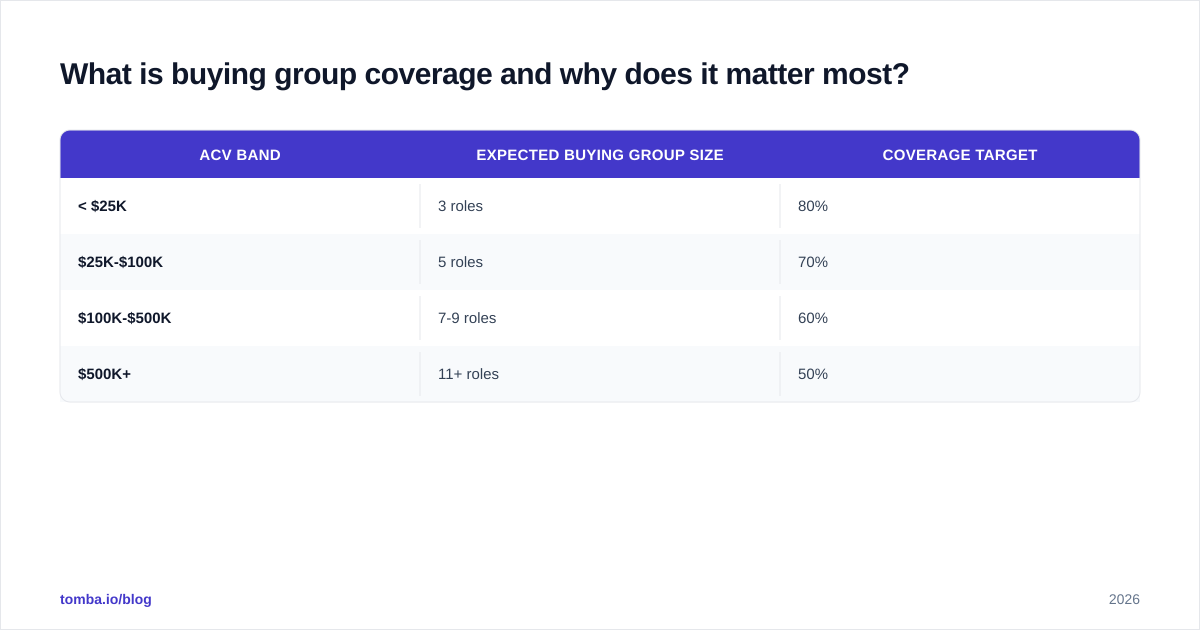
Benchmark by deal size:
| ACV band | Expected buying group size | Coverage target |
|---|---|---|
| < $25K | 3 roles | 80% |
| $25K-$100K | 5 roles | 70% |
| $100K-$500K | 7-9 roles | 60% |
| $500K+ | 11+ roles | 50% |
Coverage is where most ABM programs quietly die. The fix is contact discovery against your existing target list — domain search by company, LinkedIn finder for known stakeholders, and phone finder for the personas your reps actually call.
How do you measure account engagement (not lead engagement)?#
The old funnel measures leads. ABM measures accounts. The math is different.
A composite account engagement score rolls up signals from every contact at the company:
- Site visits in last 30 days (weight: 1)
- Pricing page visits (weight: 5)
- Demo requests (weight: 20)
- Email replies from decision-makers (weight: 8)
- Webinar attendance (weight: 6)
- Third-party intent surges from G2 or Bombora (weight: 4)
- LinkedIn ad clicks from named personas (weight: 2)
Sum, normalize to 0-100, and bucket: cold (<30), warm (30-60), hot (60-85), surging (85+).
Benchmark engagement rates:
| Segment | Healthy target |
|---|---|
| Tier 1 named accounts | 60-80% reaching "warm" or above quarterly |
| Tier 2 named accounts | 35-50% reaching "warm" or above quarterly |
| Tier 3 (programmatic ABM) | 20-30% reaching "warm" or above quarterly |
A tier-1 account that hasn't crossed "warm" in a full quarter isn't a target account — it's a fantasy. Re-tier or replace it.
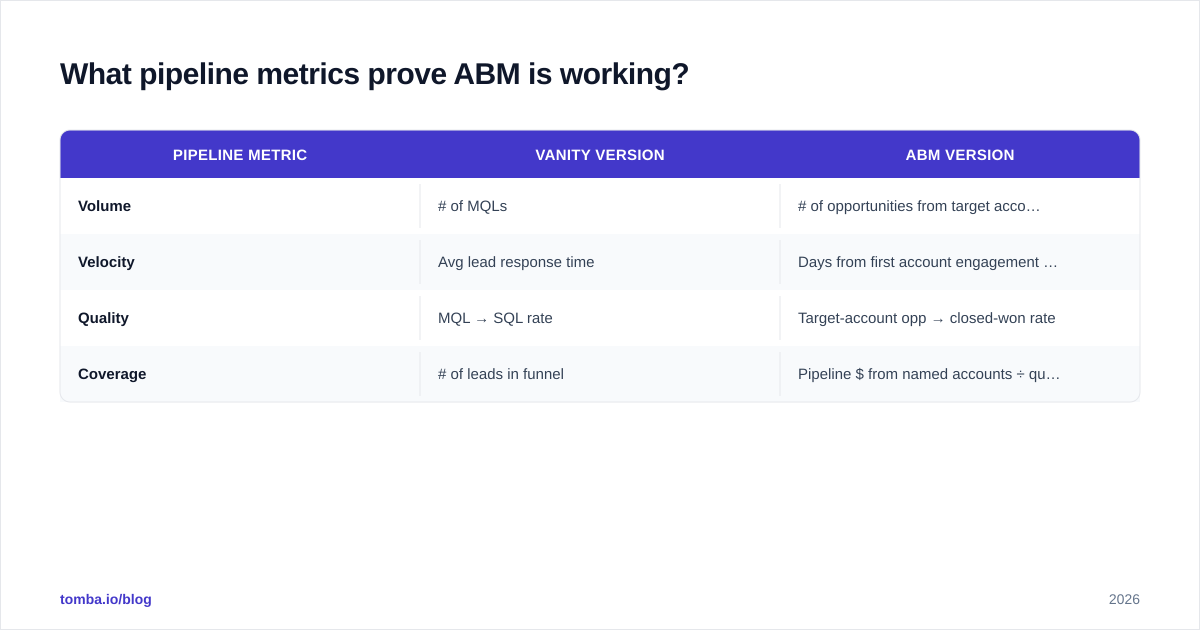
What pipeline metrics prove ABM is working?#
Once accounts are engaged, three pipeline metrics tell you if engagement converts.
1. Target-account opportunity creation rate Opportunities created from target accounts ÷ total target accounts. Benchmark: 8-15% per quarter for a healthy named-account program.
2. Sales cycle delta Average days to close for ABM-sourced deals vs. inbound. ABM should compress the cycle 20-40% because the buying group is pre-warmed. If your cycle is the same or longer, your "ABM" is actually batch-and-blast outbound wearing a costume.
3. Multi-threading depth Average number of stakeholders engaged per open opportunity. Forrester data (forrester.com) consistently shows deals with 4+ threaded contacts close at roughly 2x the rate of single-threaded deals.
| Pipeline metric | Vanity version | ABM version |
|---|---|---|
| Volume | # of MQLs | # of opportunities from target accounts |
| Velocity | Avg lead response time | Days from first account engagement to opp |
| Quality | MQL → SQL rate | Target-account opp → closed-won rate |
| Coverage | # of leads in funnel | Pipeline $ from named accounts ÷ quota |
What revenue metrics prove ABM ROI?#
Tier 4 is where finance lives. These four numbers decide whether your ABM program survives the next planning cycle.
1. ABM-influenced ACV Average contract value of deals touched by the ABM motion. Industry-wide, ABM-influenced deals run 1.8-2.5x non-ABM ACV. If yours don't, you're either targeting the wrong segment or your sales team is discounting the same way they always did.
2. ABM win rate Closed-won ÷ qualified opportunities, segmented by source. Healthy ABM win rates land between 28% and 45%, vs. 15-22% for traditional inbound.
3. ABM-attributed pipeline coverage Open ABM pipeline ÷ next-quarter quota. CRO target: 3-4x coverage. Anything less and the program is sub-scale.
4. Net revenue retention from ABM accounts NRR is the long-tail proof. If ABM is real, the accounts you acquired through it should expand faster. Target: 115%+ NRR on ABM-acquired logos, vs. 100-105% on inbound.
Track these in a single view next to your sales process metrics — the revenue operations team owns the rollup.
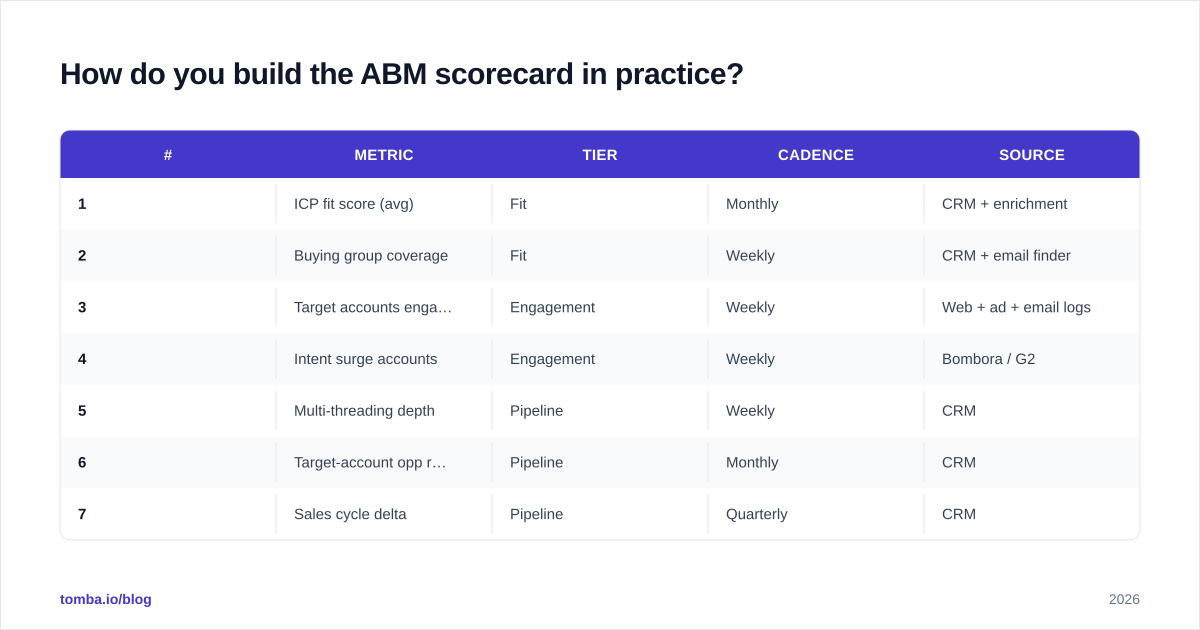
How do you build the ABM scorecard in practice?#
A working scorecard fits on one screen and updates weekly. Here's the minimum-viable build:
| # | Metric | Tier | Cadence | Source |
|---|---|---|---|---|
| 1 | ICP fit score (avg) | Fit | Monthly | CRM + enrichment |
| 2 | Buying group coverage | Fit | Weekly | CRM + email finder |
| 3 | Target accounts engaged | Engagement | Weekly | Web + ad + email logs |
| 4 | Intent surge accounts | Engagement | Weekly | Bombora / G2 |
| 5 | Multi-threading depth | Pipeline | Weekly | CRM |
| 6 | Target-account opp rate | Pipeline | Monthly | CRM |
| 7 | Sales cycle delta | Pipeline | Quarterly | CRM |
| 8 | ABM-influenced ACV | Revenue | Monthly | CRM |
| 9 | ABM win rate | Revenue | Monthly | CRM |
| 10 | Pipeline coverage ratio | Revenue | Weekly | CRM |
| 11 | NRR (ABM cohort) | Revenue | Quarterly | Billing + CRM |
| 12 | CAC payback (ABM) | Revenue | Quarterly | Finance |
Two implementation rules:
- Every metric has an owner. Not a team — a person. Unowned metrics rot.
- Every metric links to a corrective action. If multi-threading depth drops below 3, the SDR team gets an automated task to find two more contacts at the account. Without an action, a metric is decoration.
A second view of this scorecard lives in your weekly RevOps review:
Which ABM metrics should you ignore?#
The "stop-tracking" list saves more time than the "start-tracking" list. Drop these:
- Raw MQL count from target accounts. MQLs are a lead-based concept and don't map to account behavior. Track engaged accounts instead.
- Email open rate as a standalone KPI. Apple MPP and corporate proxies make this number unusable in 2026. Use reply rate from verified deliverable addresses instead — which depends on a clean email verifier step.
- Cost per click on ABM ads. Targeting 200 accounts at $50 CPC is a feature, not a bug. Use cost per engaged account.
- Total impressions on target accounts. Reach without behavior change is a billboard.
- Marketing-sourced revenue without a corresponding multi-touch attribution view. Almost every ABM deal is co-created with sales.
How do you connect ABM metrics to data quality?#
Every metric in tiers 1-4 depends on the contact and account data underneath. Coverage drops to zero if half your contacts bounce. Engagement scores lie if the personas are mistagged. Win rate by segment is meaningless if the firmographic field is "unknown" for a third of accounts.
A practical data-quality floor for ABM:
| Field | Floor for ABM-readiness |
|---|---|
| Email deliverability on contacts | ≥ 95% verified |
| Phone presence on target personas | ≥ 60% |
| Company firmographics (size, industry, tech) | ≥ 90% populated |
| Persona tagging on contacts | ≥ 85% mapped to ICP roles |
| Buying group coverage | ≥ benchmark per ACV band |
This is the unglamorous work that determines whether your scorecard is signal or theater. Run it as a quarterly hygiene sprint, not a one-time cleanup. Hubspot's own ABM playbook calls out the same gap — data debt compounds faster than any other ABM risk.
How often should you review ABM metrics?#
Cadence beats sophistication. A simple scorecard reviewed weekly outperforms a beautiful one reviewed quarterly.
- Weekly: engagement, coverage, pipeline coverage ratio, multi-threading. RevOps + ABM lead, 30 minutes.
- Monthly: fit score drift, opportunity creation rate, ACV, win rate. Add the head of sales.
- Quarterly: sales cycle delta, NRR, CAC payback, target-list rebalance. Add the CRO and CFO.
- Annually: redefine the ICP itself based on the last 12 months of closed-won, then rescore every account.
Skipping the weekly review is the most common failure mode. By the time the quarterly comes around, you have three months of bad pipeline you can't fix.
What does a healthy ABM scorecard look like?#
A condensed snapshot from a B2B SaaS company in the $20-50K ACV band, mid-program:
| Metric | Current | Target | Status |
|---|---|---|---|
| Avg ICP fit score (tier 1) | 81 | ≥ 75 | Green |
| Buying group coverage | 64% | ≥ 70% | Amber |
| Target accounts engaged (Q) | 41% | ≥ 35% | Green |
| Multi-threading depth | 3.8 | ≥ 4.0 | Amber |
| Target-account opp rate | 11% | 8-15% | Green |
| ABM-influenced ACV uplift | 2.1x | 2.0x+ | Green |
| ABM win rate | 33% | ≥ 30% | Green |
| Pipeline coverage | 3.2x | 3x+ | Green |
| NRR (ABM cohort) | 118% | ≥ 115% | Green |
Two ambers, seven greens, no reds. The amber on coverage triggers a contact-discovery sprint; the amber on multi-threading triggers a multi-thread playbook refresh. That's the whole game — find the amber, run the play.
Get the data foundation right first#
Every ABM metric in this guide collapses if the contact data under it is wrong. Verified emails, correct firmographics, and full buying group coverage are the load-bearing layer.
If you're building the scorecard above and need to fix coverage on your target-account list, start with the Tomba Email Finder. Drop in a target domain, pull the decision-makers, verify the addresses, and push them into your CRM with confidence scores attached. You can do it one account at a time from the web app, in bulk from a CSV, or via the Tomba API for the RevOps team's coverage automation.
Clean data, tiered metrics, weekly cadence. That's the whole ABM measurement stack — and it's what separates programs that get budget increases from programs that get cut.
Get the Tomba newsletter
Practical outbound tactics and product updates — once every two weeks.
About the author