Analyzing Sales: A 2026 Framework for Sales Data Analysis
Analyzing sales is more than a revenue chart. Here's a 2026 framework for the metrics, methods, and tools that turn raw pipeline data into decisions.
TL;DR
- Analyzing sales means converting raw pipeline, activity, and revenue data into decisions — not just admiring a hockey-stick chart at the end of the quarter.
- Start with three layers: outcome metrics (revenue, win rate), pipeline metrics (conversion, velocity), and activity metrics (calls, emails, meetings). Each answers a different question.
- The biggest mistake is analyzing dirty data. Bad contact records and unverified emails poison every downstream metric.
- A repeatable cadence (weekly pipeline review, monthly cohort analysis, quarterly strategy) beats one-off dashboard archaeology.
- The right tooling depends on your stage: spreadsheets for sub-$1M, CRM reporting for scaling teams, BI plus enrichment for everyone past Series B.
What does "analyzing sales" actually mean?#
Analyzing sales is the practice of turning the numbers your team generates — deals, calls, emails, demos, closes — into a clear answer to one question: what should we do differently next week?
Think of it like a doctor reading a chart. The patient (your pipeline) might look fine from across the room, but the bloodwork tells you whether something is quietly going wrong. Revenue is the temperature. It tells you the patient is sick, but not why. To diagnose, you need the underlying panels: conversion rates, sales cycle length, deal slippage, and rep-level activity.
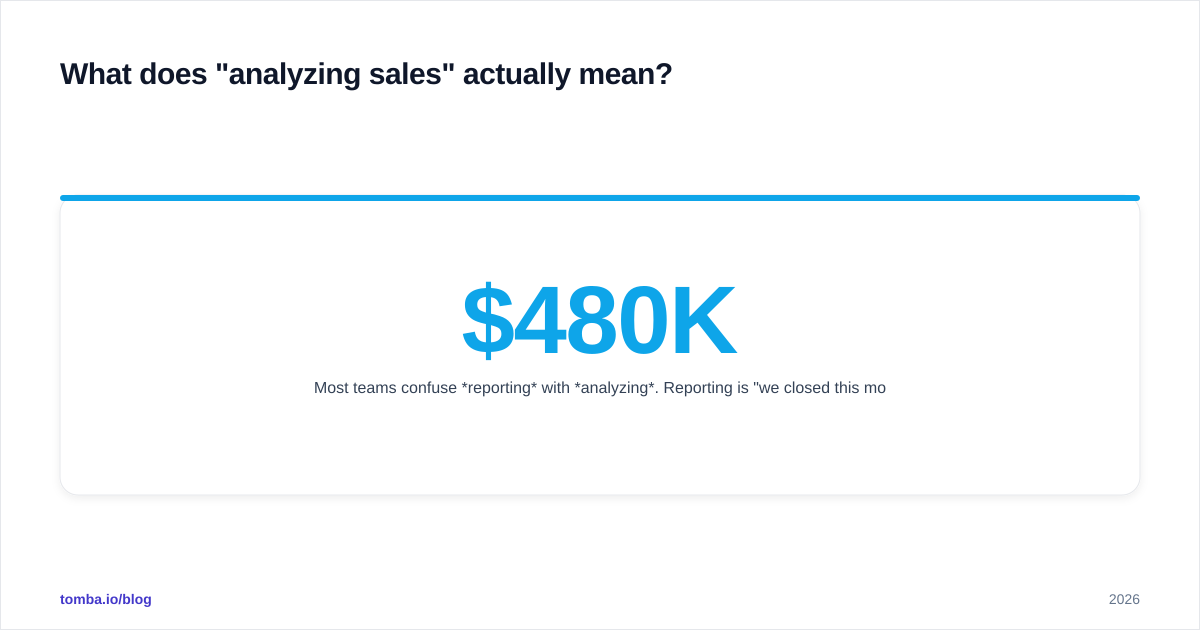
Most teams confuse reporting with analyzing. Reporting is "we closed $480K this month." Analyzing is "we closed $480K, but win rate on inbound dropped from 28% to 19% because lead quality fell after we changed the form — fix the form." One is a photograph. The other is a recommendation.
)
Which sales metrics actually matter in 2026?#
You do not need 200 metrics. You need a small set that maps to decisions. Group them into three layers, from lagging to leading.
Outcome metrics (lagging). These tell you what already happened. Total revenue, win rate, average deal size, and quota attainment. They are the scoreboard, but they are slow — by the time they move, the cause is months old.
Pipeline metrics (coincident). These describe the engine while it runs: stage-to-stage conversion, sales cycle length, pipeline coverage (pipeline value ÷ quota), and deal velocity. When these shift, your outcome metrics are about to shift too.
Activity metrics (leading). Calls made, emails sent, meetings booked, and response rate. These are the earliest signal. If activity drops on Monday, pipeline coverage drops in three weeks and revenue drops next quarter.
The discipline is reading them top-down for diagnosis and bottom-up for prediction. A revenue miss (outcome) sends you to conversion (pipeline), which sends you to activity. A drop in meetings booked (activity) lets you forecast the revenue miss before it lands.
How do you build a repeatable sales analysis process?#
A dashboard you check randomly is worse than no dashboard, because it invites cherry-picking. Build a cadence instead, where each rhythm answers a scoped question.
- Weekly pipeline review. Look at deals that moved, stalled, or slipped. The only question: which deals need intervention this week? Keep it under 30 minutes.
- Monthly cohort analysis. Group deals by the month they entered the pipeline and track how each cohort converts over time. This separates a genuine slowdown from normal lag.
- Quarterly strategy review. Now you zoom out to segment, channel, and rep performance. Which industries close fastest? Which lead source has the best marketing qualified lead conversion? This is where you reallocate budget.
The trick is matching the time horizon to the metric. Reviewing activity metrics quarterly is useless — they move daily. Reviewing strategy weekly creates whiplash. Each loop has a natural frequency; respect it.
Why does data quality break sales analysis before it starts?#
Here is the uncomfortable truth: most "analyzing sales" projects fail not because the analysis is wrong, but because the data feeding it is garbage. You cannot compute an accurate conversion rate when 30% of your contacts have bounced emails, duplicate records, or missing firmographic fields.
Bad data shows up in three predictable ways:
- Phantom pipeline. Deals tied to contacts who no longer work at the company, inflating coverage.
- Skewed conversion. If half your outbound emails never land because addresses are invalid, your "reply rate" is measuring deliverability, not message quality.
- Misattributed wins. Without clean source data, you credit the wrong channel and double down on the wrong thing.
The fix is upstream hygiene. Verify emails before they enter sequences, deduplicate records on import, and enrich thin contacts so every analysis has the firmographic dimensions (industry, company size, region) it needs to slice by. Teams that run their lists through an email verifier and data enrichment before analysis routinely find their "real" numbers differ from their reported ones by 15-20%.
As the analytics maxim goes: garbage in, garbage out. No BI tool fixes a dirty pipeline.
What tools should you use to analyze sales data?#
The right stack depends almost entirely on team size and data complexity. Buying enterprise BI for a five-person team is as wasteful as running a $20M pipeline out of one spreadsheet. Here is how the common options compare.
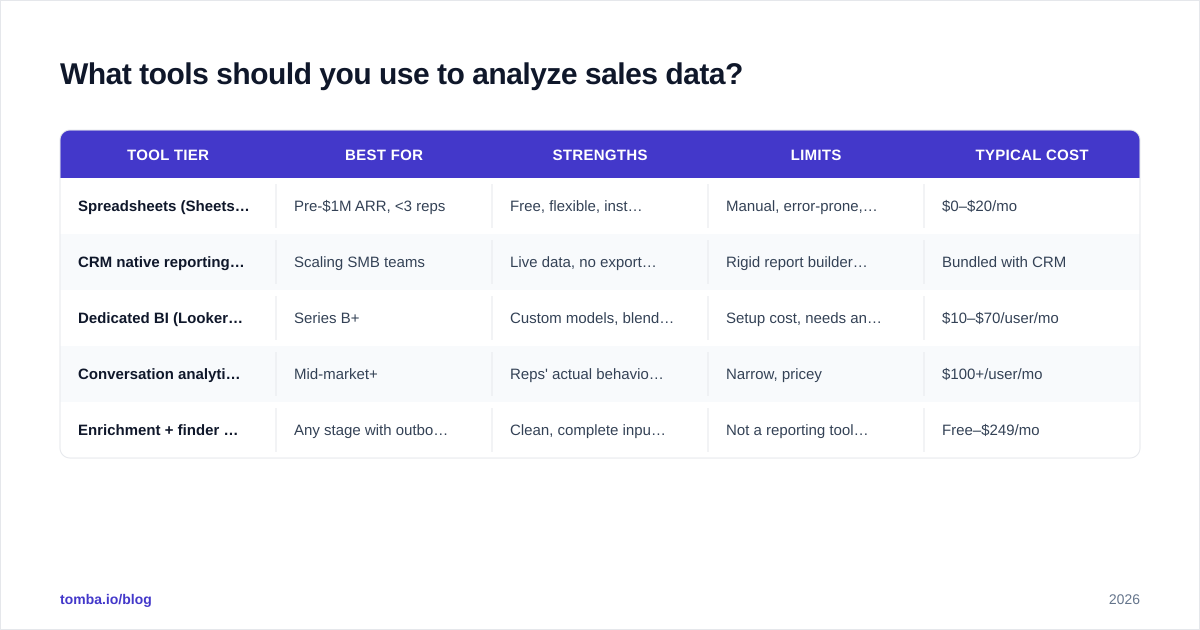
| Tool tier | Best for | Strengths | Limits | Typical cost |
|---|---|---|---|---|
| Spreadsheets (Sheets/Excel) | Pre-$1M ARR, <3 reps | Free, flexible, instant | Manual, error-prone, no real-time | $0–$20/mo |
| CRM native reporting (HubSpot, Pipedrive) | Scaling SMB teams | Live data, no export step | Rigid report builder, weak cohorting | Bundled with CRM |
| Dedicated BI (Looker, Power BI, Tableau) | Series B+ | Custom models, blends sources | Setup cost, needs an analyst | $10–$70/user/mo |
| Conversation analytics (Gong-class) | Mid-market+ | Reps' actual behavior, call data | Narrow, pricey | $100+/user/mo |
| Enrichment + finder layer (Tomba) | Any stage with outbound | Clean, complete input data | Not a reporting tool itself | Free–$249/mo |
Two things stand out. First, these tiers stack rather than compete — a Series B team typically runs a CRM, a BI layer, and an enrichment layer together. Second, every reporting tool above assumes clean inputs, which is why the enrichment layer sits underneath all of them. If you are weighing CRM platforms, both HubSpot and Salesforce publish detailed reporting docs worth reading before you commit. For unbiased peer reviews of any tool on this list, G2's sales analytics category is the least marketing-driven source.
)
How do you analyze sales by segment without drowning?#
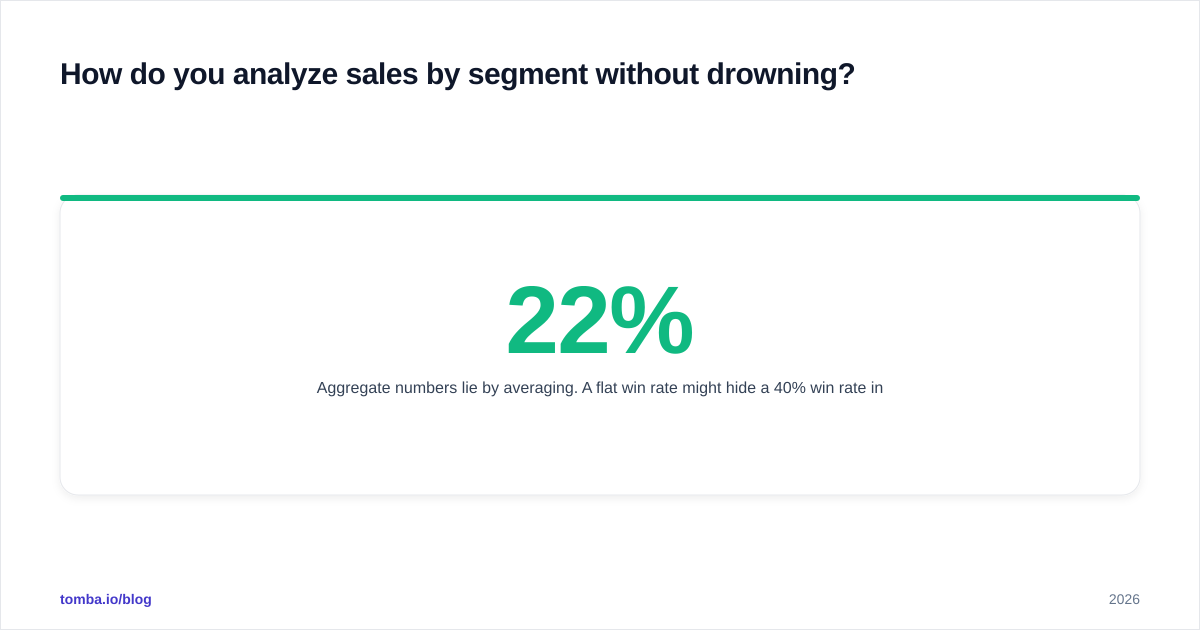
Aggregate numbers lie by averaging. A flat 22% win rate might hide a 40% win rate in healthcare and a 9% win rate in retail. Segmentation is where analysis stops being descriptive and starts being directive.
The four segmentation axes that pay off most:
- By source. Inbound vs outbound vs referral vs partner. Each has different economics; blending them hides your best channel.
- By segment/ICP. Company size and industry. This tells you where to point your reps.
- By rep. Not to rank-and-yank, but to find what your top performer does that's coachable.
- By stage. Where do deals die? A cliff at "proposal sent" is a pricing or champion problem, not a top-of-funnel problem.
The practical move is to pick one axis per analysis session. Trying to slice by source × segment × rep × stage at once produces 200 tiny cells with no statistical signal. Analyze one dimension, act, then analyze the next. For consistent segmentation you need consistent firmographic data on every record — which again traces back to enrichment and clean domain search at the point of capture.
What are the most common sales analysis mistakes?#
Even good analysts trip on the same roots. Watch for these:
- Vanity metrics. Tracking "emails sent" with no tie to reply or revenue. Volume without conversion is theater.
- Survivorship bias. Studying only closed-won deals to find your playbook. You learn more from the deals you lost at the same stage.
- Small-sample certainty. Declaring a channel "dead" after 12 leads. Set a minimum sample threshold before you act.
- Correlation as causation. "Deals with a demo close better" might mean demos work — or that already-hot deals are the ones that agree to demos.
- Static targets. Comparing this quarter to a quota set before the market moved. Re-baseline against trend, not a stale plan.
The meta-mistake underneath all of these is analyzing to confirm a belief rather than to test one. Good sales analysis is adversarial: you go in trying to disprove your current strategy. If it survives, you trust it more.
How does better data improve your sales analysis?#
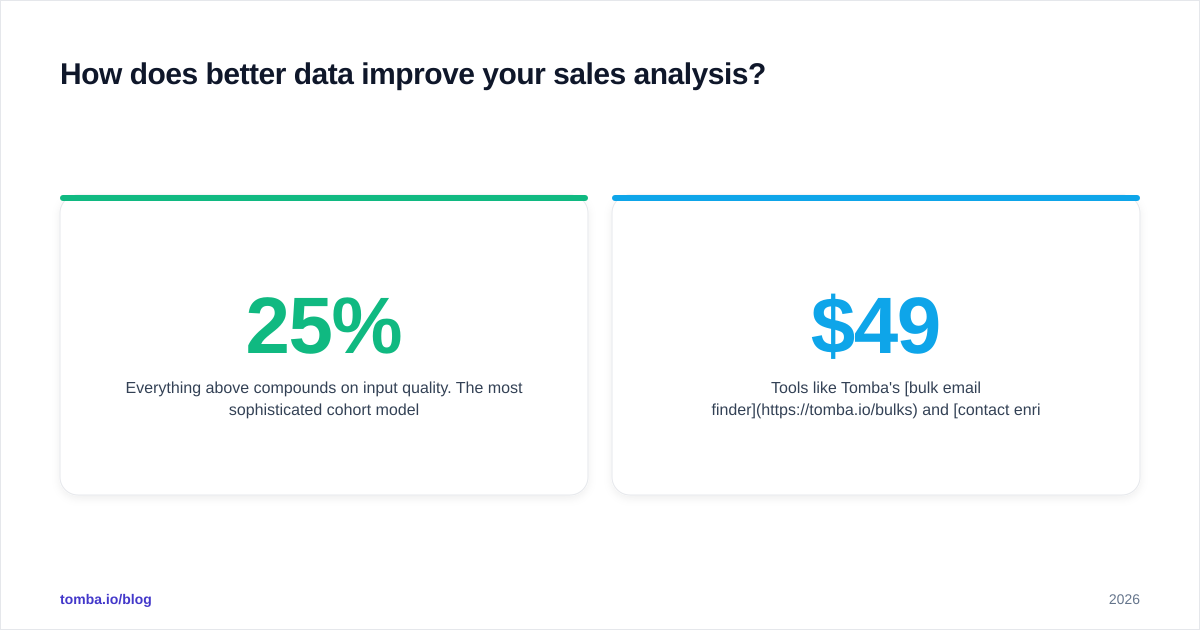
Everything above compounds on input quality. The most sophisticated cohort model in Tableau still produces a confident, wrong answer if 25% of your contacts are unreachable or misattributed.
This is where a contact-data layer earns its place in the stack. Before deals ever enter your CRM, you want verified emails, complete firmographic fields, and deduplicated records. That means:
- Valid contacts only, so reply and bounce rates measure your message, not your list.
- Complete firmographics, so every segmentation axis is available.
- No duplicates, so pipeline coverage isn't double-counted.
Tools like Tomba's bulk email finder and contact enrichment sit upstream of your analytics, feeding clean records into the CRM that your BI layer reports on. Pricing scales with volume — the Tomba pricing ladder runs from a free tier (25 searches/mo) through Starter at $49/mo, Growth at $99/mo, and Pro at $249/mo — so the hygiene layer stays proportional to your pipeline.
Frequently asked questions#
How often should I analyze sales data? Match frequency to metric horizon: activity and pipeline weekly, cohorts monthly, strategy quarterly. Daily revenue-staring causes more bad decisions than it prevents.
What's the single most important sales metric? There isn't one, but if forced to pick, stage-to-stage conversion. It's leading enough to act on and outcome-linked enough to matter, unlike pure activity counts.
Do I need a data analyst to analyze sales? Not until roughly Series B. Below that, CRM-native reporting plus disciplined cadence covers 90% of the value. Hire the analyst when you outgrow your CRM's report builder, not before.
Why are my reported numbers different from reality? Almost always data quality — bounced emails, duplicate deals, or missing source attribution. Run a verification and dedup pass before trusting any conversion rate.
Start with clean inputs#
Analyzing sales is only as good as the data underneath it, and the cheapest, highest-leverage fix is upstream: make sure every contact in your pipeline is real, reachable, and complete before a single metric is calculated. The Tomba Email Finder finds and verifies professional email addresses by name, domain, or company, so the pipeline you analyze reflects deals you can actually reach — not phantom records inflating your charts. Start on the free tier, run your existing list through it, and watch how much your "real" win rate differs from your reported one.
// get started
Find, verify and enrich your first contacts today
Start on the free plan with 25 searches a month, then scale when your team is ready.
Free plan · No credit card required · GDPR & CCPA
// about the author