Annual Churn Rate: How to Calculate and Reduce It in 2026
Annual churn rate quietly caps your growth. Here's how to calculate it correctly, benchmark it against SaaS peers, and cut it in 2026.
TL;DR
- Annual churn rate is the percentage of customers (or revenue) you lose over a 12-month period. It is the single metric that most quietly caps your growth.
- Calculate it as
(customers lost during the year ÷ customers at the start of the year) × 100— but always separate gross from net churn. - Healthy B2B SaaS annual logo churn sits around 5–7%; revenue churn should trend toward zero (and negative for best-in-class).
- Most churn is decided in the first 90 days. Onboarding, data hygiene, and proactive outreach move the number more than win-back campaigns.
- Reducing annual churn by a few points compounds harder than almost any acquisition tactic — a 5-point drop can add years of runway.
What is annual churn rate?#
Annual churn rate is the share of customers or recurring revenue you lose across a full year. Think of it as a leaky bucket: acquisition is the water pouring in, churn is the hole in the bottom. You can pour faster (spend more on marketing) or you can patch the hole (retention). Patching is almost always cheaper.
Two flavors matter, and confusing them is the most common reporting mistake:
- Customer (logo) churn — how many accounts canceled.
- Revenue churn — how much recurring revenue you lost, which can differ wildly when a few large accounts behave differently from the long tail.
A company can lose 10% of its small logos while growing revenue, because expansions from large accounts outpace the losses. That gap is why you report both, every quarter, side by side.
How do you calculate annual churn rate?#
The base formula is straightforward:
Annual churn rate = (Customers lost during the year ÷ Customers at start of year) × 100If you began the year with 500 customers and lost 45, your annual logo churn is (45 ÷ 500) × 100 = 9%.
Revenue churn swaps customers for dollars:
Gross revenue churn = (MRR lost to cancellations & downgrades ÷ MRR at start) × 100
Net revenue churn   = ((MRR lost − MRR gained from expansions) ÷ MRR at start) × 100
The placeholder below shows how the inputs flow into each output so your finance and CS teams stop arguing about which number is "real."
A few rules keep the math honest:
- Pick a consistent cohort window. Mixing monthly and annual contracts inside one number distorts it. Segment by contract length.
- Decide on new customers. The conservative method excludes customers acquired during the period from the denominator, so fast growth doesn't artificially deflate churn.
- Annualize carefully. You cannot just multiply monthly churn by 12. Use
1 − (1 − monthly churn)^12to account for compounding.

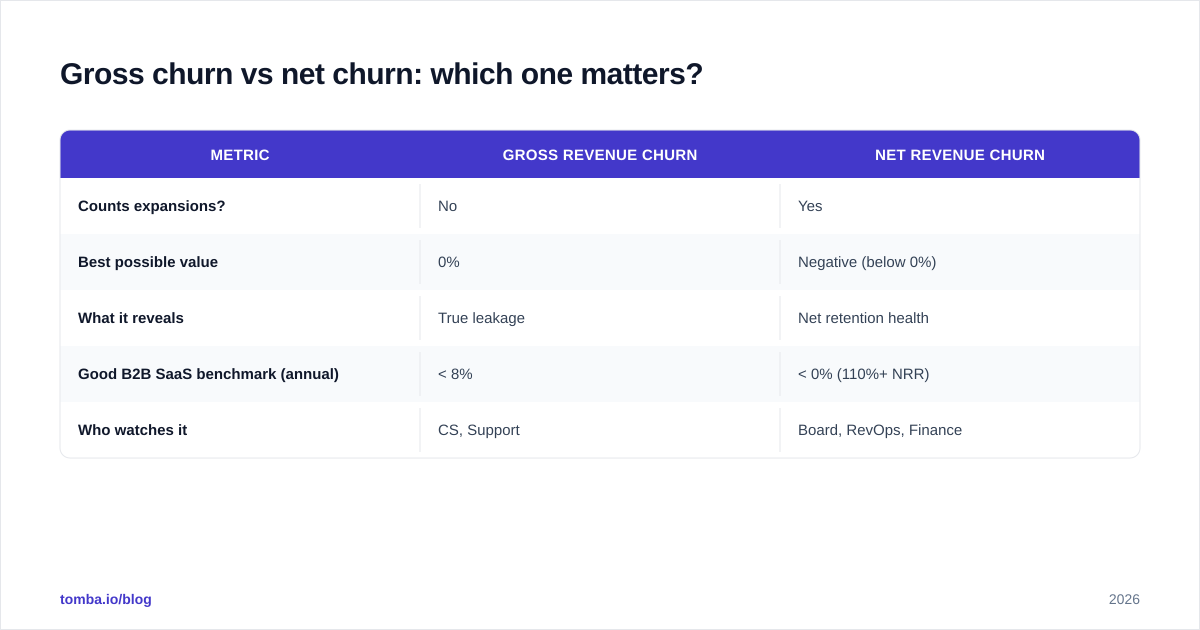
Gross churn vs net churn: which one matters?#
Both — but they answer different questions. Gross churn tells you how much you're losing. Net churn tells you whether expansion is covering for it. When net revenue churn goes negative, your existing base grows on its own even if you sign zero new logos. That is the holy grail of revenue operations.

| Metric | Gross revenue churn | Net revenue churn |
|---|---|---|
| Counts expansions? | No | Yes |
| Best possible value | 0% | Negative (below 0%) |
| What it reveals | True leakage | Net retention health |
| Good B2B SaaS benchmark (annual) | < 8% | < 0% (110%+ NRR) |
| Who watches it | CS, Support | Board, RevOps, Finance |
If you only report one number to your board, report net revenue retention (the inverse of net churn). If you only report one number to your CS team, report gross churn — because that's the leak they can actually plug.
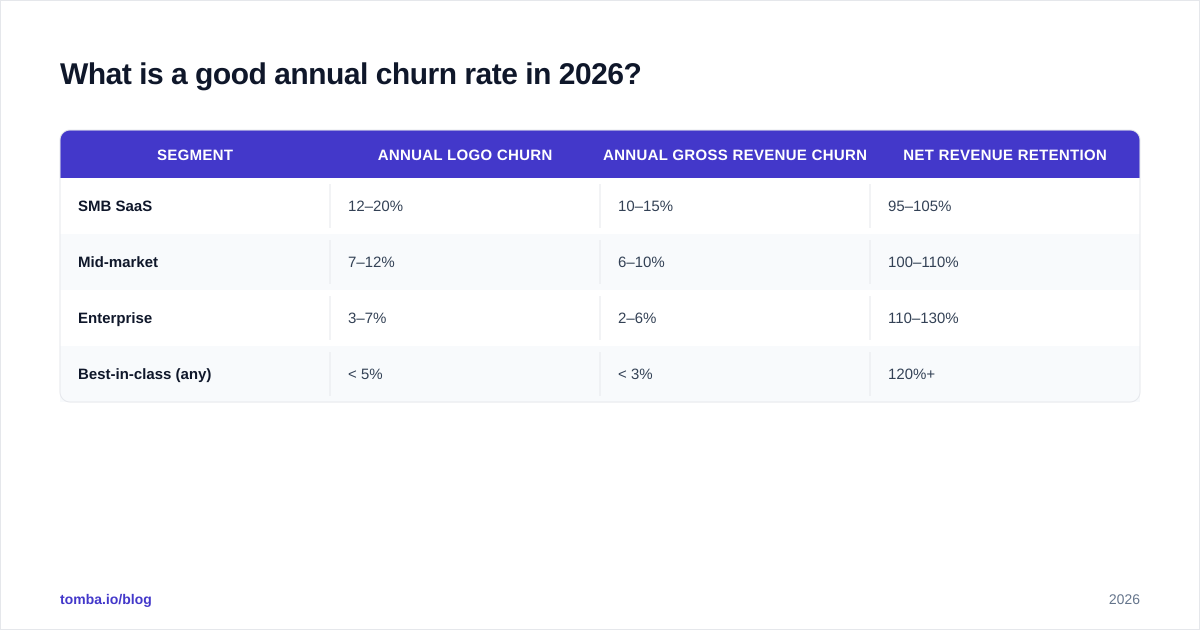
What is a good annual churn rate in 2026?#
Benchmarks vary by segment, but these ranges hold up across most B2B SaaS in 2026:
| Segment | Annual logo churn | Annual gross revenue churn | Net revenue retention |
|---|---|---|---|
| SMB SaaS | 12–20% | 10–15% | 95–105% |
| Mid-market | 7–12% | 6–10% | 100–110% |
| Enterprise | 3–7% | 2–6% | 110–130% |
| Best-in-class (any) | < 5% | < 3% | 120%+ |
Smaller customers churn faster — they have less switching cost, tighter budgets, and weaker onboarding. That isn't a failure; it's a structural reality you price and staff around. What matters is the trend. A flat or rising churn rate quarter over quarter is the warning sign, not the absolute number. For broader context on how vendors report these figures, G2's and Gartner's category research are useful external baselines (see G2 and Gartner).
Why does annual churn matter more than you think?#
Because it compounds in the wrong direction. A churn rate isn't a one-time loss; it's a tax on every future year of revenue. Drop annual churn from 10% to 5% and you don't just save 5% this year — you keep customers paying for roughly twice as long, which doubles their lifetime value and lengthens your payback on every dollar of acquisition spend.
Run the arithmetic on customer lifetime: average customer lifetime ≈ 1 ÷ annual churn rate. At 10% churn, the average customer stays 10 years. At 5%, they stay 20. That single change can be worth more than your entire paid-acquisition budget — and it costs far less to engineer.
This is also why churn is a marketing qualified lead problem upstream. If you acquire poor-fit accounts because your targeting is loose, they churn no matter how good your product is. Clean, accurate prospect data at the top of the funnel is a retention lever disguised as an acquisition one.
What actually causes high annual churn?#
Most teams blame the product. Usually it's one of these, in rough order of frequency:
- Bad-fit acquisition. You sold to accounts that were never going to succeed. This is the cheapest churn to fix — fix it before the sale by tightening your ICP and verifying contact data.
- Weak onboarding. The customer never reached first value. Churn risk is highest in the first 90 days.
- Low product adoption. Seats were bought but never activated. Usage data predicts churn months before the cancellation email.
- Poor data hygiene in your CRM. Stale or wrong contact records mean your CS team emails dead inboxes and misses renewal windows. Keeping records current with reliable data enrichment is unglamorous but high-leverage.
- Champion turnover. Your internal advocate left and nobody filled the gap. Track multiple contacts per account so a single departure doesn't sink the relationship.
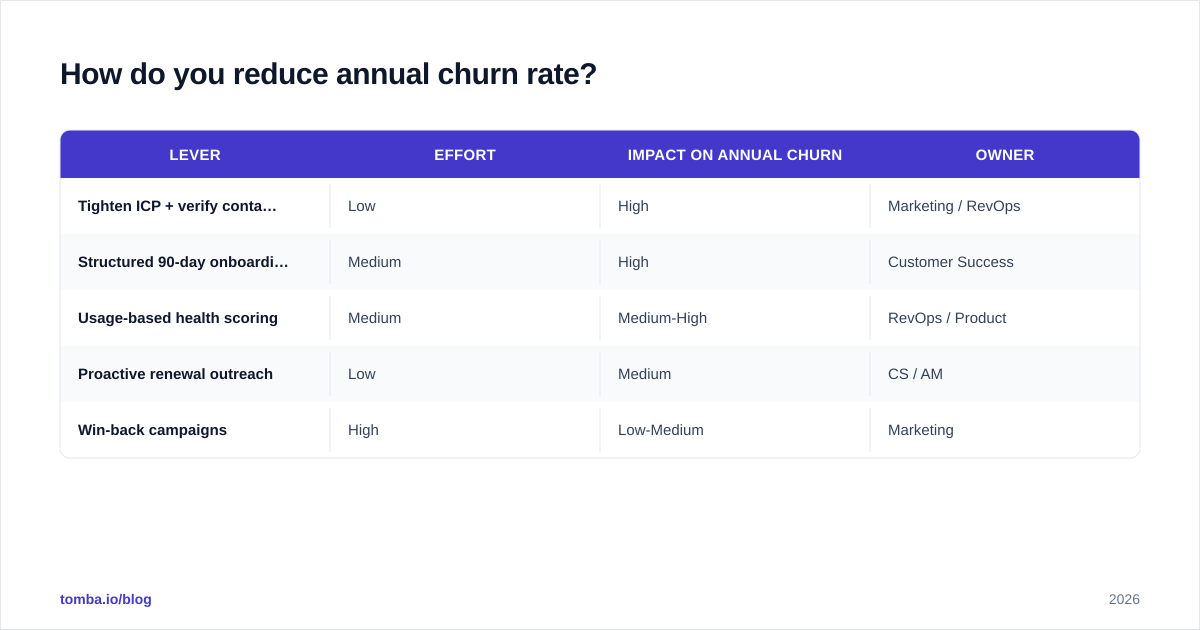
How do you reduce annual churn rate?#
There's no single switch, but the highest-ROI moves cluster in three phases:
1. Before the sale — buy better customers. Churn prevention starts at targeting. Build prospect lists around your proven best-fit profile and verify every contact so reps spend time on real, reachable decision-makers rather than chasing bounces. A clean top of funnel with accurate emails — sourced through an email finder and validated with an email verifier — keeps poor-fit logos out of the base in the first place.
2. First 90 days — engineer time-to-value. Map the milestones that correlate with one-year retention and instrument them. Trigger human outreach the moment an account stalls. A documented onboarding playbook beats heroics; HubSpot's research on customer onboarding is a solid external reference for structuring this (HubSpot).
3. Ongoing — make renewal a non-event. By the time renewal arrives, the decision should already be made by usage. Health scores, quarterly value reviews, and proactive expansion conversations turn renewals from a cliff into a formality. Keep contact and account data fresh so your CS team always reaches the right person — enriching and re-verifying records on a schedule prevents the silent churn that comes from simply losing touch.
| Lever | Effort | Impact on annual churn | Owner |
|---|---|---|---|
| Tighten ICP + verify contacts | Low | High | Marketing / RevOps |
| Structured 90-day onboarding | Medium | High | Customer Success |
| Usage-based health scoring | Medium | Medium-High | RevOps / Product |
| Proactive renewal outreach | Low | Medium | CS / AM |
| Win-back campaigns | High | Low-Medium | Marketing |
Notice that win-back — the tactic teams reach for first — sits at the bottom. Recovering a churned customer is far harder than never losing them. Spend your energy upstream.
How often should you measure annual churn?#
Calculate it monthly on a trailing-twelve-month basis, not once a year. An annual-only cadence means you find out about a problem when it's already a year old. A rolling TTM view smooths out seasonality while still surfacing trend changes within weeks. Pair it with leading indicators — login frequency, feature adoption, support ticket sentiment — so you're acting on predictions, not just autopsies. Clean CRM data underpins all of it; if your B2B database is full of stale records, every downstream metric inherits the noise.
Frequently asked questions#
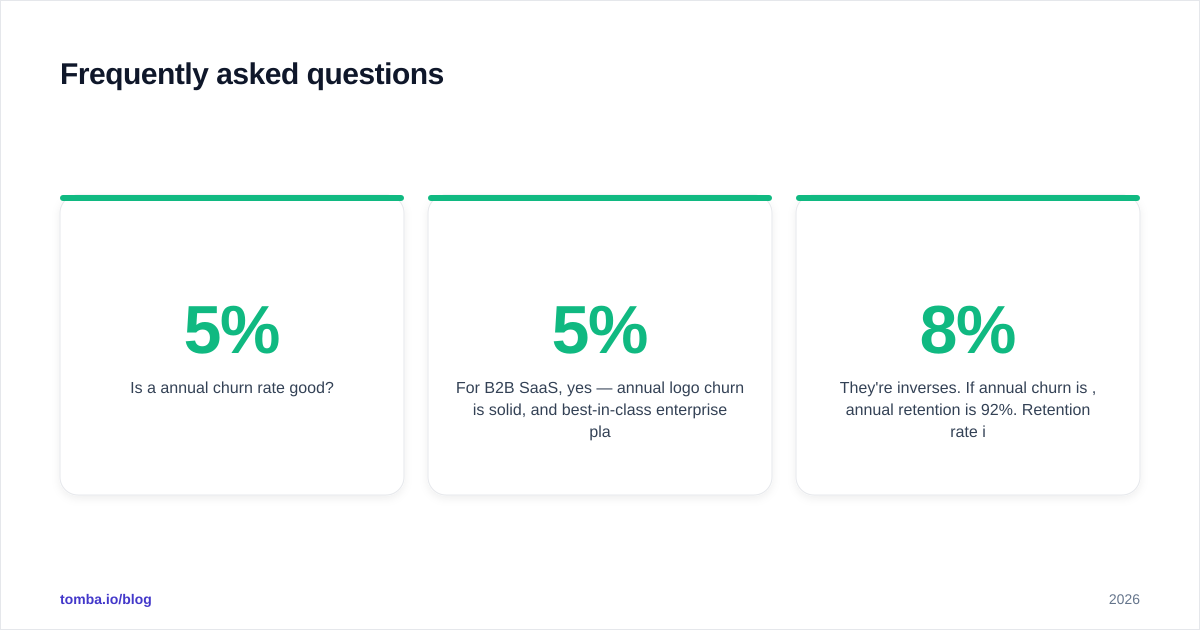
Is a 5% annual churn rate good? For B2B SaaS, yes — 5% annual logo churn is solid, and best-in-class enterprise players push below it. For SMB-focused products, 5% is excellent. Always compare against your own segment, not a blanket benchmark.
What's the difference between churn rate and retention rate? They're inverses. If annual churn is 8%, annual retention is 92%. Retention rate is the glass-half-full framing; churn is the glass-half-empty one. Net revenue retention can exceed 100% because expansions count, while retention rate as a simple inverse of logo churn cannot.
Can annual churn rate be negative? Logo churn can't be negative, but net revenue churn can — when expansion revenue from your existing base outpaces the revenue you lose. Negative net churn is the strongest signal of product-market fit at scale.
Does acquiring better-fit customers really lower churn? Yes, more than almost anything else. Poor-fit accounts churn regardless of product quality. Tightening your ICP and verifying contact data before outreach is the cheapest, highest-leverage churn reduction available.
Lower churn starts with better data at the top#
Annual churn is a downstream symptom of upstream decisions — who you target, how reachable they are, and whether your CRM reflects reality. If your reps are chasing bounced emails and stale contacts, you're acquiring and retaining blind.
Start where it's cheapest to fix: the data. Use the Tomba Email Finder to build prospect lists around your best-fit profile, verify every address before it hits a sequence, and keep your account records enriched so Customer Success always reaches the right decision-maker at renewal time. Cleaner data at the top means fewer bad-fit logos in the base — and a churn rate that finally trends the right way. See Tomba pricing to find the plan that fits your pipeline.
Ready to find emails that actually work?
Join 150,000+ professionals who stopped guessing and started sending. Free credits on signup — no credit card required.
Get the Tomba newsletter
Practical outbound tactics and product updates — once every two weeks.
About the author