Annual Sales Report 2026: Template, Metrics & Examples
Build an annual sales report that executives actually read. Get the structure, the metrics that matter, a copy-ready template, and the mistakes that sink most year-end decks.
placeholder
TL;DR
- An annual sales report is the year-end summary that ties revenue, pipeline, and team performance to the decisions leadership makes for next year — not just a pile of charts.
- The strongest reports follow a fixed structure: executive summary, revenue results vs. target, pipeline and conversion, segment/product breakdown, team performance, and a forward plan.
- Six metrics carry most of the weight: bookings, win rate, average deal size, sales cycle length, pipeline coverage, and net revenue retention.
- Bad data ruins good reporting. Clean, deduplicated, enriched contact records are the difference between a trusted report and one nobody believes.
- Use the copy-ready template below, then automate the data pulls so next year's report takes hours, not weeks.
What is an annual sales report?#
An annual sales report is a structured document that summarizes a full year of selling activity and translates it into decisions. Think of it like a company's yearly physical exam: individual numbers (blood pressure, cholesterol) only matter once a doctor reads them together and tells you what to change. Your bookings, win rate, and churn are the vitals — the report is the diagnosis.
It serves three audiences at once. Executives want the verdict: did we hit plan, and why or why not. Sales leaders want the operational story: which segments, reps, and motions drove the result. Finance and the board want defensible numbers they can model next year's targets on. A report that only does one of these jobs gets ignored by the other two rooms.
The annual version is distinct from your monthly or quarterly reviews. Monthly reports are about reaction — fix the leak now. The annual report is about pattern recognition across twelve months, so you can spot the structural trends a single quarter hides.
Why does an annual sales report matter in 2026?#
Because budgets are tighter and scrutiny is higher. Boards that approved "growth at all costs" plans a few years ago now want efficiency math — cost to acquire, payback period, retention — laid out clearly. Your annual sales report is where that case gets made or lost.
It also sets next year's quota. If your report under-counts pipeline or misattributes a lucky quarter to a new playbook, you bake that error straight into everyone's targets. According to research from Gartner and analyst commentary across the industry, sales orgs increasingly run on shared revenue data rather than departmental silos — which means your annual report is read alongside marketing and customer success numbers, and inconsistencies show.
Finally, it is a planning artifact. The forward-looking section — where you got to and where you're going — is often the part leadership rereads in Q2 when results wobble. Treat it as a commitment, not a formality.
What should an annual sales report include?#
Seven sections, in this order. The order matters: lead with the answer, then justify it.
- Executive summary — one page. Did you hit target, the top three drivers, and the top two risks for next year. If a director reads only this, they should still be informed.
- Revenue results vs. target — total bookings/revenue, attainment percentage, year-over-year growth, and a bridge that explains the gap between plan and actual.
- Pipeline and conversion — pipeline generated, stage-by-stage conversion, win rate, and sales cycle length.
- Segment, product, and region breakdown — where growth actually came from. Averages lie; segments tell the truth.
- Team performance — attainment distribution, ramp time for new hires, and top/bottom decile analysis.
- Data quality and source notes — what's measured, what's estimated, and known gaps. This builds trust.
- Forward plan — targets, headcount, and the two or three bets for next year.
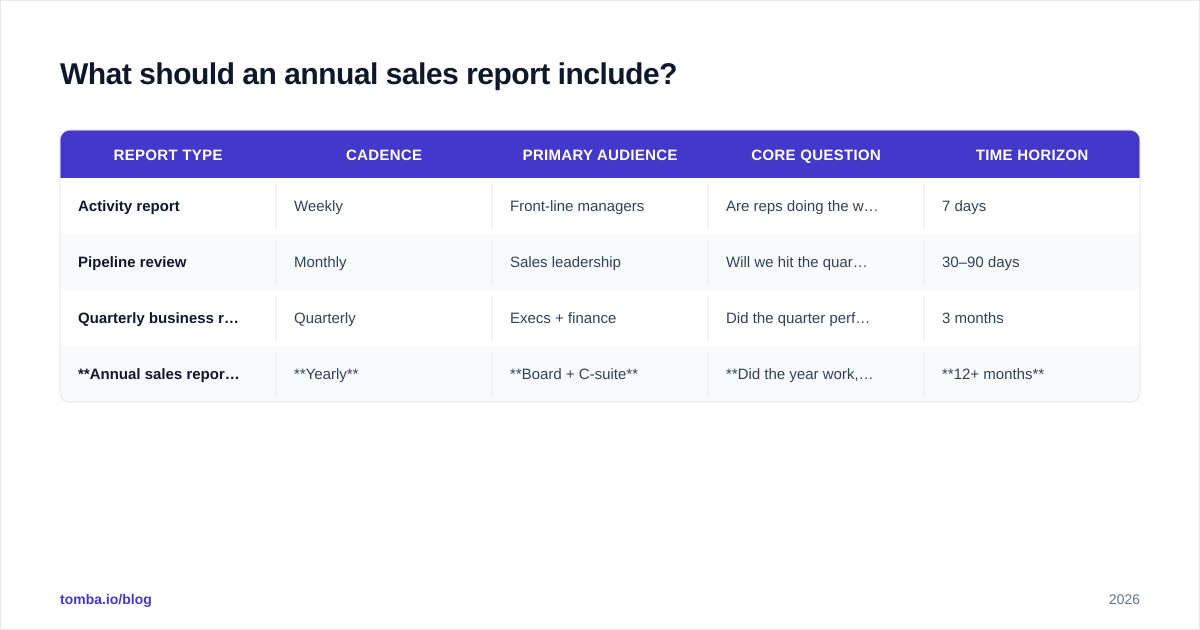
Here is how reporting cadence maps to purpose, so you don't duplicate effort across documents:
| Report type | Cadence | Primary audience | Core question | Time horizon |
|---|---|---|---|---|
| Activity report | Weekly | Front-line managers | Are reps doing the work? | 7 days |
| Pipeline review | Monthly | Sales leadership | Will we hit the quarter? | 30–90 days |
| Quarterly business review | Quarterly | Execs + finance | Did the quarter perform? | 3 months |
| Annual sales report | Yearly | Board + C-suite | Did the year work, and what's next? | 12+ months |

Which metrics belong in an annual sales report?#
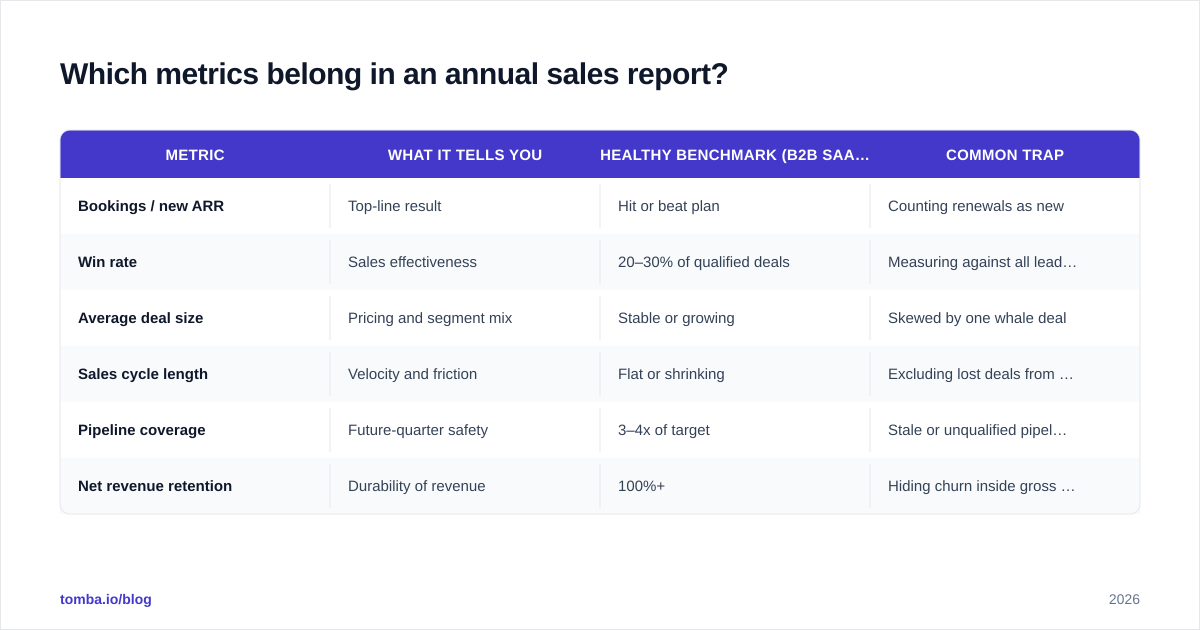
Six metrics carry the narrative. Everything else is supporting detail you keep in an appendix.
| Metric | What it tells you | Healthy benchmark (B2B SaaS) | Common trap |
|---|---|---|---|
| Bookings / new ARR | Top-line result | Hit or beat plan | Counting renewals as new |
| Win rate | Sales effectiveness | 20–30% of qualified deals | Measuring against all leads, not qualified |
| Average deal size | Pricing and segment mix | Stable or growing | Skewed by one whale deal |
| Sales cycle length | Velocity and friction | Flat or shrinking | Excluding lost deals from the math |
| Pipeline coverage | Future-quarter safety | 3–4x of target | Stale or unqualified pipeline |
| Net revenue retention | Durability of revenue | 100%+ | Hiding churn inside gross numbers |
A note on win rate: define it once and apply it everywhere. If your monthly reports use one denominator and your annual report uses another, leadership will spend the meeting arguing about the number instead of the decision. The same discipline applies to win rate and response rate — pick a definition, document it in the source-notes section, and freeze it for the year.
For the forward plan, pipeline coverage is the metric executives probe hardest. If you're claiming 4x coverage, be ready to show that the pipeline is real — recently engaged, qualified, and attached to contacts you can actually reach.
How do you build an annual sales report step by step?#
Step 1 — Lock your data sources. List every system the numbers come from: CRM, billing, marketing automation, and any spreadsheets. Note which are authoritative. The fastest way to lose a board's trust is two slides with two different revenue totals.
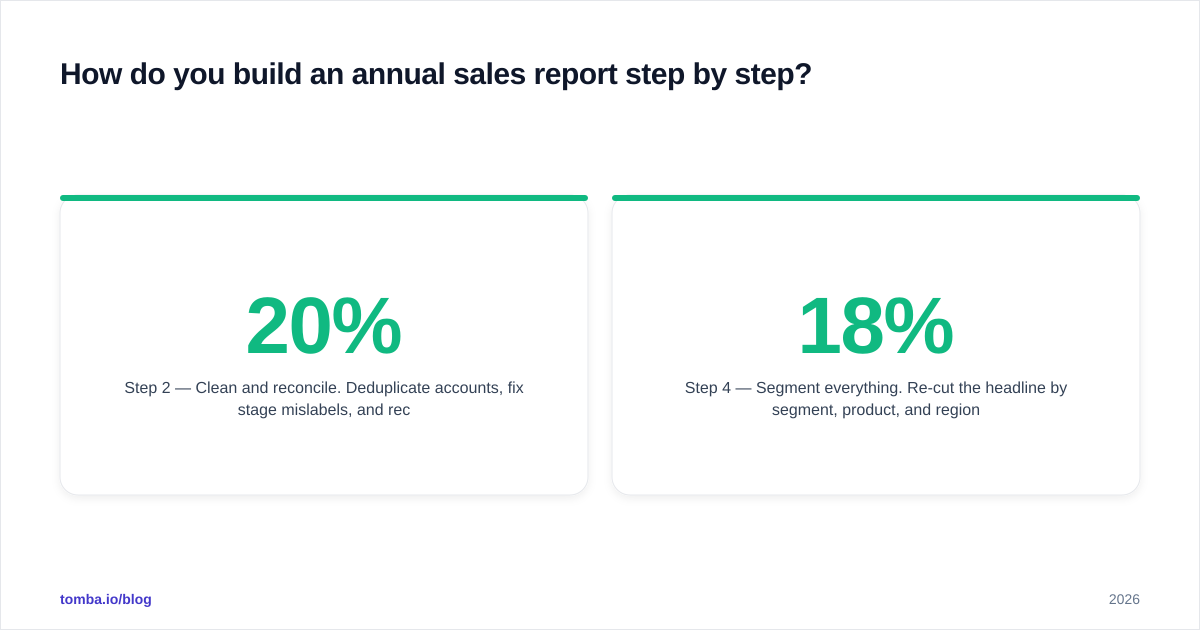
Step 2 — Clean and reconcile. Deduplicate accounts, fix stage mislabels, and reconcile CRM bookings against finance's recognized revenue. Expect a gap; explain it rather than hiding it. This is also where contact data quality bites — if 20% of your "engaged accounts" have bounced or outdated contacts, your pipeline coverage is fiction. Maintaining a clean B2B database and running periodic data enrichment on stale records keeps the denominator honest.
Step 3 — Build the bridge. A revenue bridge shows how you got from last year's number to this year's: new business, expansion, churn, and price changes as separate bars. This single visual answers more board questions than any other slide.
Step 4 — Segment everything. Re-cut the headline by segment, product, and region. The story "we grew 18%" almost always hides "enterprise grew 40%, SMB shrank 5%." Decisions live in the segments.
Step 5 — Write the summary last. Once the sections are done, write the executive summary from what the data actually said — not from what you hoped it would say. If the summary and the charts disagree, the charts win.
This workflow connects directly to your broader revenue operations practice — the annual report is the most visible output of a year's worth of clean pipeline hygiene.

What does a good annual sales report look like? (Example)#
Here's a condensed, anonymized example of a strong executive summary — the section most reports get wrong by burying the verdict.
2026 Sales Results — Executive Summary
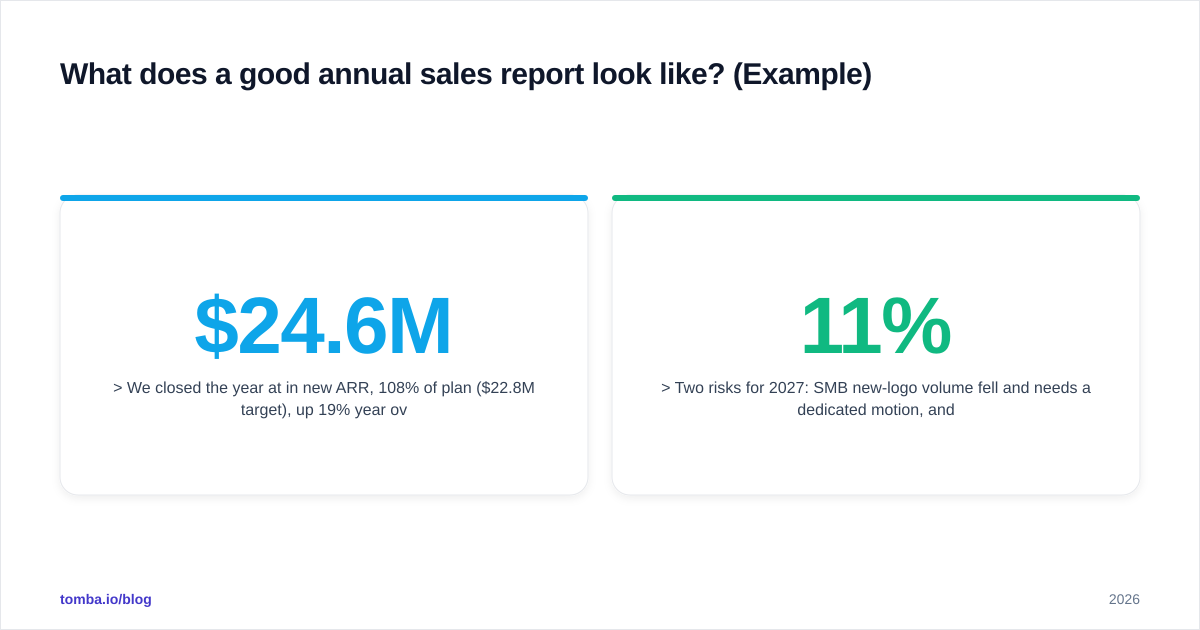
We closed the year at $24.6M in new ARR, 108% of plan ($22.8M target), up 19% year over year. Three drivers account for the beat: enterprise win rate rose from 22% to 29% after the solutions-engineering hire, average deal size grew 14% on the new platform tier, and Q3 expansion revenue offset a softer SMB Q1.
Two risks for 2027: SMB new-logo volume fell 11% and needs a dedicated motion, and net revenue retention slipped to 104% as a single large account downgraded. Pipeline coverage entering Q1 is 3.6x — adequate but thin in EMEA.
Notice what it does: leads with attainment, names the causes in plain language, and flags the risks before anyone has to ask. The supporting slides then prove each claim. That's the whole game — the report is a verdict with evidence attached, not evidence in search of a verdict.
Contrast that with the version most teams ship: fourteen charts, no sentence telling you what they mean, and a final slide that says "Questions?" The data was identical. The difference was whether someone did the interpretation work.
What are the most common annual sales report mistakes?#
- Dumping data instead of deciding. A report is interpretation, not export. If a slide has no takeaway sentence, cut it or write one.
- Untrustworthy numbers. Mismatched totals across slides destroy credibility in the first five minutes. Reconcile before you design.
- Vanity over reality. Highlighting total leads or activity volume while ignoring win rate and retention tells leadership you're optimizing for the wrong thing.
- No segmentation. Company-wide averages hide both your best growth and your worst leaks.
- Ignoring data hygiene. Reporting on a CRM full of duplicates, bounced contacts, and dead accounts produces confident, precise, wrong conclusions.
- No forward plan. A report that only looks backward leaves the most valuable question — "so what do we do?" — unanswered.
The hygiene point deserves emphasis. Most reporting errors aren't math errors; they're data errors that occurred months earlier, when records went stale and nobody noticed. Comparing your numbers against external benchmarks from sources like HubSpot's sales research or your CRM vendor's reports (for example Salesforce's State of Sales) only helps if your own inputs are clean to begin with.
How do you automate the annual sales report?#
Treat it as a pipeline, not an annual scramble. Three layers:
- Source of truth. Pick the authoritative system for each number and stop pulling the same metric from two places.
- Continuous hygiene. Enrich and verify contact and account data on a rolling basis so the year-end pull is already clean. Pushing fresh, verified contacts into your CRM throughout the year — via tools that connect through an email finder API or your existing integrations — means your pipeline coverage number reflects reachable accounts, not ghosts.
- Templated assembly. Save the structure above as a reusable template. Once the data layer is clean, regenerating the report is a matter of refreshing charts, not rebuilding logic.
The payoff: the report that took two analysts three weeks the first year takes one person two days the next, because the hard part — trustworthy data — is handled continuously instead of in a panic every December.
Closing: start with data you can trust#
The best annual sales report in the world is worthless if the underlying contacts and accounts are wrong. Pipeline coverage, win rate, and retention all depend on knowing who your real, reachable buyers are. That's where clean data starts.
Tomba's Email Finder helps you build and maintain an accurate contact base year-round — verified professional emails by domain, name, or company — so when reporting season arrives, your numbers reflect reality instead of a CRM full of dead records. Start free with 25 searches a month, and see full Tomba pricing when you're ready to scale. Build the data foundation now, and next year's report writes itself.
// get started
Find, verify and enrich your first contacts today
Start on the free plan with 25 searches a month, then scale when your team is ready.
Free plan · No credit card required · GDPR & CCPA
// about the author