ARR Waterfall Explained: Build, Track & Forecast in 2026
An ARR waterfall shows exactly how your recurring revenue grew or shrank — new, expansion, contraction, and churn. Here's how to build one in 2026.
You can hit your net-new ARR target and still be quietly bleeding. A single growth number hides four very different forces pulling in opposite directions. The ARR waterfall is the report that pulls them apart.
TL;DR#
- An ARR waterfall decomposes the change in annual recurring revenue between two periods into five movements: new, expansion, contraction, churn, and reactivation.
- It answers the question a single growth percentage cannot: where did the money actually come from, and where is it leaking?
- Net new ARR = New + Expansion + Reactivation − Contraction − Churn.
- The two metrics that fall out of it — Gross Revenue Retention (GRR) and Net Revenue Retention (NRR) — are the numbers investors and boards scrutinize most in 2026.
- Your waterfall is only as honest as your CRM data. Stale contacts and duplicate accounts quietly corrupt every cohort.
What is an ARR waterfall?#
An ARR waterfall is a chart and a table that shows how your recurring revenue moved from a starting balance to an ending balance over a period — usually a quarter or a year. Think of it like a bank statement for your subscription business. You start the month with a balance, money flows in (deposits) and out (withdrawals), and you end with a new balance. The waterfall just labels each flow by why it happened.
That "why" is the whole point. Two companies can both report 20% ARR growth. One grew because existing customers expanded their contracts; the other grew because the sales team papered over heavy churn with a frantic quarter of new logos. The first business is healthy. The second is on a treadmill. A flat top-line number treats them as identical — the waterfall exposes the difference instantly.
If you manage revenue operations, the waterfall is the single most important artifact you own. It feeds the board deck, the forecast, and the comp plan — and when it's wrong, every downstream decision inherits the error.

What are the five components of an ARR waterfall?#
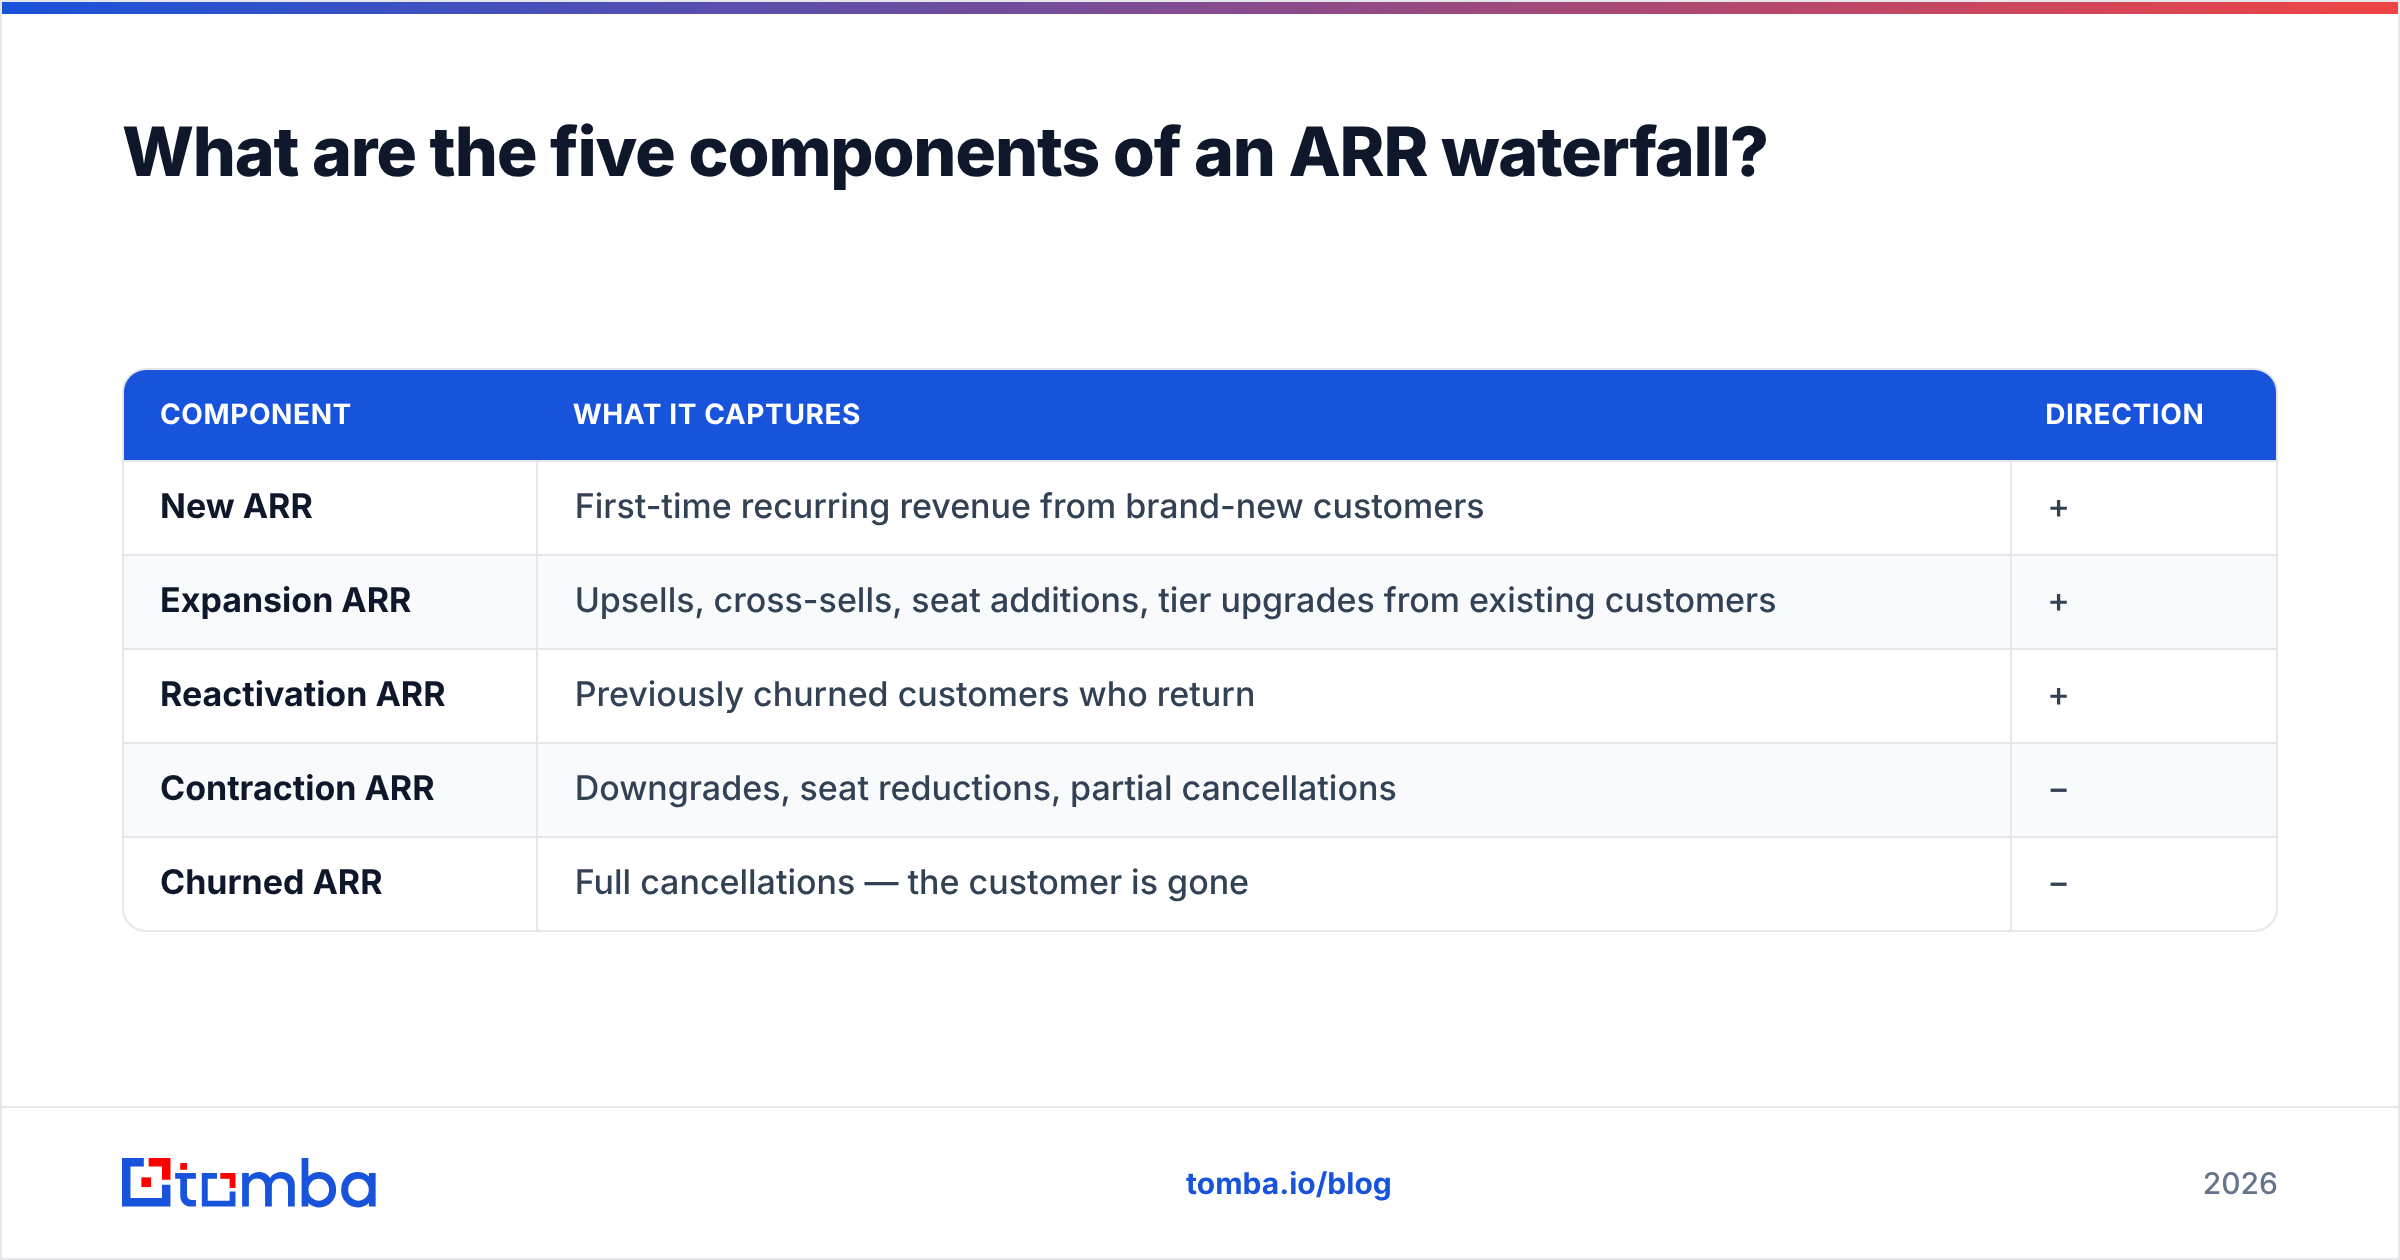
Every dollar of movement falls into exactly one of these buckets. Keep them mutually exclusive or your math stops reconciling.
| Component | What it captures | Direction |
|---|---|---|
| New ARR | First-time recurring revenue from brand-new customers | + |
| Expansion ARR | Upsells, cross-sells, seat additions, tier upgrades from existing customers | + |
| Reactivation ARR | Previously churned customers who return | + |
| Contraction ARR | Downgrades, seat reductions, partial cancellations | − |
| Churned ARR | Full cancellations — the customer is gone | − |
The headline output is net new ARR:
Net New ARR = New + Expansion + Reactivation − Contraction − Churn
Ending ARR  = Beginning ARR + Net New ARR
A worked example. You start the quarter at $4,000,000 ARR. You close $600,000 in new logos, $300,000 in expansion, and $40,000 in reactivation. You also lose $120,000 to contraction and $180,000 to outright churn.
Net New ARR = 600,000 + 300,000 + 40,000 − 120,000 − 180,000 = 640,000
Ending ARR  = 4,000,000 + 640,000 = 4,640,000
You grew 16% — but $300,000 of customer trouble (contraction + churn) was hidden inside that number. That $300,000 is your leak, and it's the number you act on next quarter.
How do you calculate GRR and NRR from the waterfall?#
Two retention ratios fall directly out of the waterfall, and they are the metrics most SaaS boards lead with.
Gross Revenue Retention (GRR) measures how much recurring revenue you keep from existing customers before counting any expansion. It can never exceed 100%.
GRR = (Beginning ARR − Contraction − Churn) / Beginning ARRUsing the numbers above:
GRR = (4,000,000 − 120,000 − 180,000) / 4,000,000 = 92.5%Net Revenue Retention (NRR) adds expansion back in. It can exceed 100% — and when it does consistently, you have a business that grows even if you stop acquiring new customers.
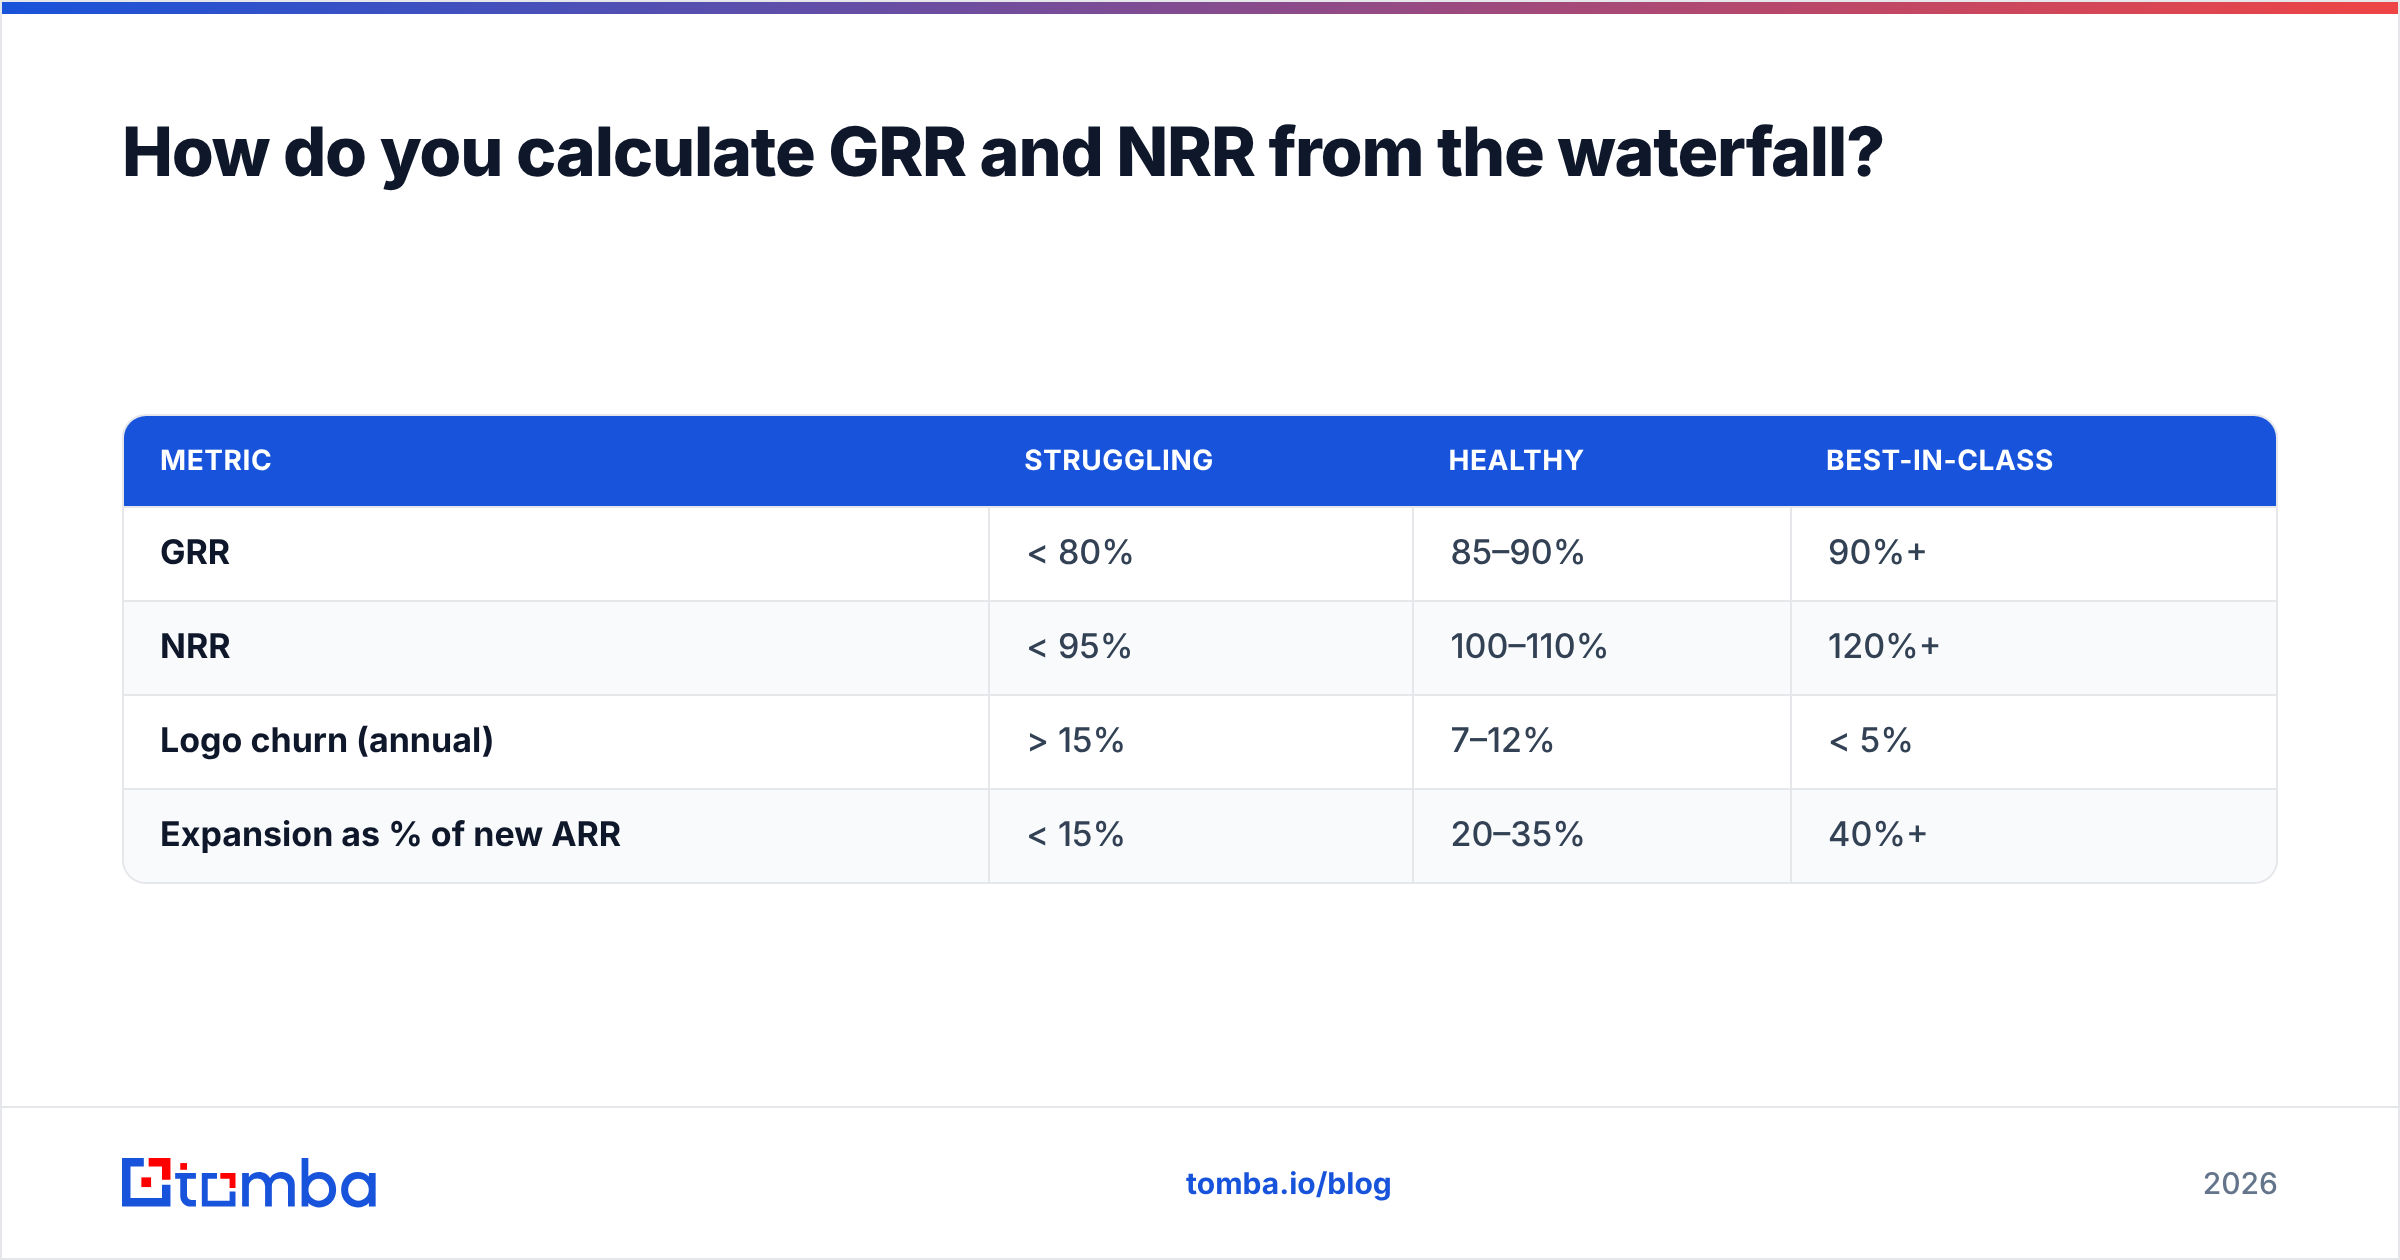
NRR = (Beginning ARR + Expansion − Contraction − Churn) / Beginning ARRNRR = (4,000,000 + 300,000 − 120,000 − 180,000) / 4,000,000 = 100%Here are the rough 2026 benchmarks teams hold themselves against, drawn from public SaaS reporting:
| Metric | Struggling | Healthy | Best-in-class |
|---|---|---|---|
| GRR | < 80% | 85–90% | 90%+ |
| NRR | < 95% | 100–110% | 120%+ |
| Logo churn (annual) | > 15% | 7–12% | < 5% |
| Expansion as % of new ARR | < 15% | 20–35% | 40%+ |
For deeper definitions of these and related terms, the B2B glossary is a useful reference, and HubSpot keeps a solid plain-English primer on revenue retention if you want a second framing.
How do you build an ARR waterfall step by step?#
You don't need a data warehouse to start. You need a clean source of truth and discipline about definitions.
- Pick your period and grain. Monthly is standard for operators; quarterly for boards. Be consistent — mixing grains is the most common reconciliation bug.
- Pull a customer-level snapshot at the start and end of the period. Every account, its ARR at T0 and T1, and its contract status.
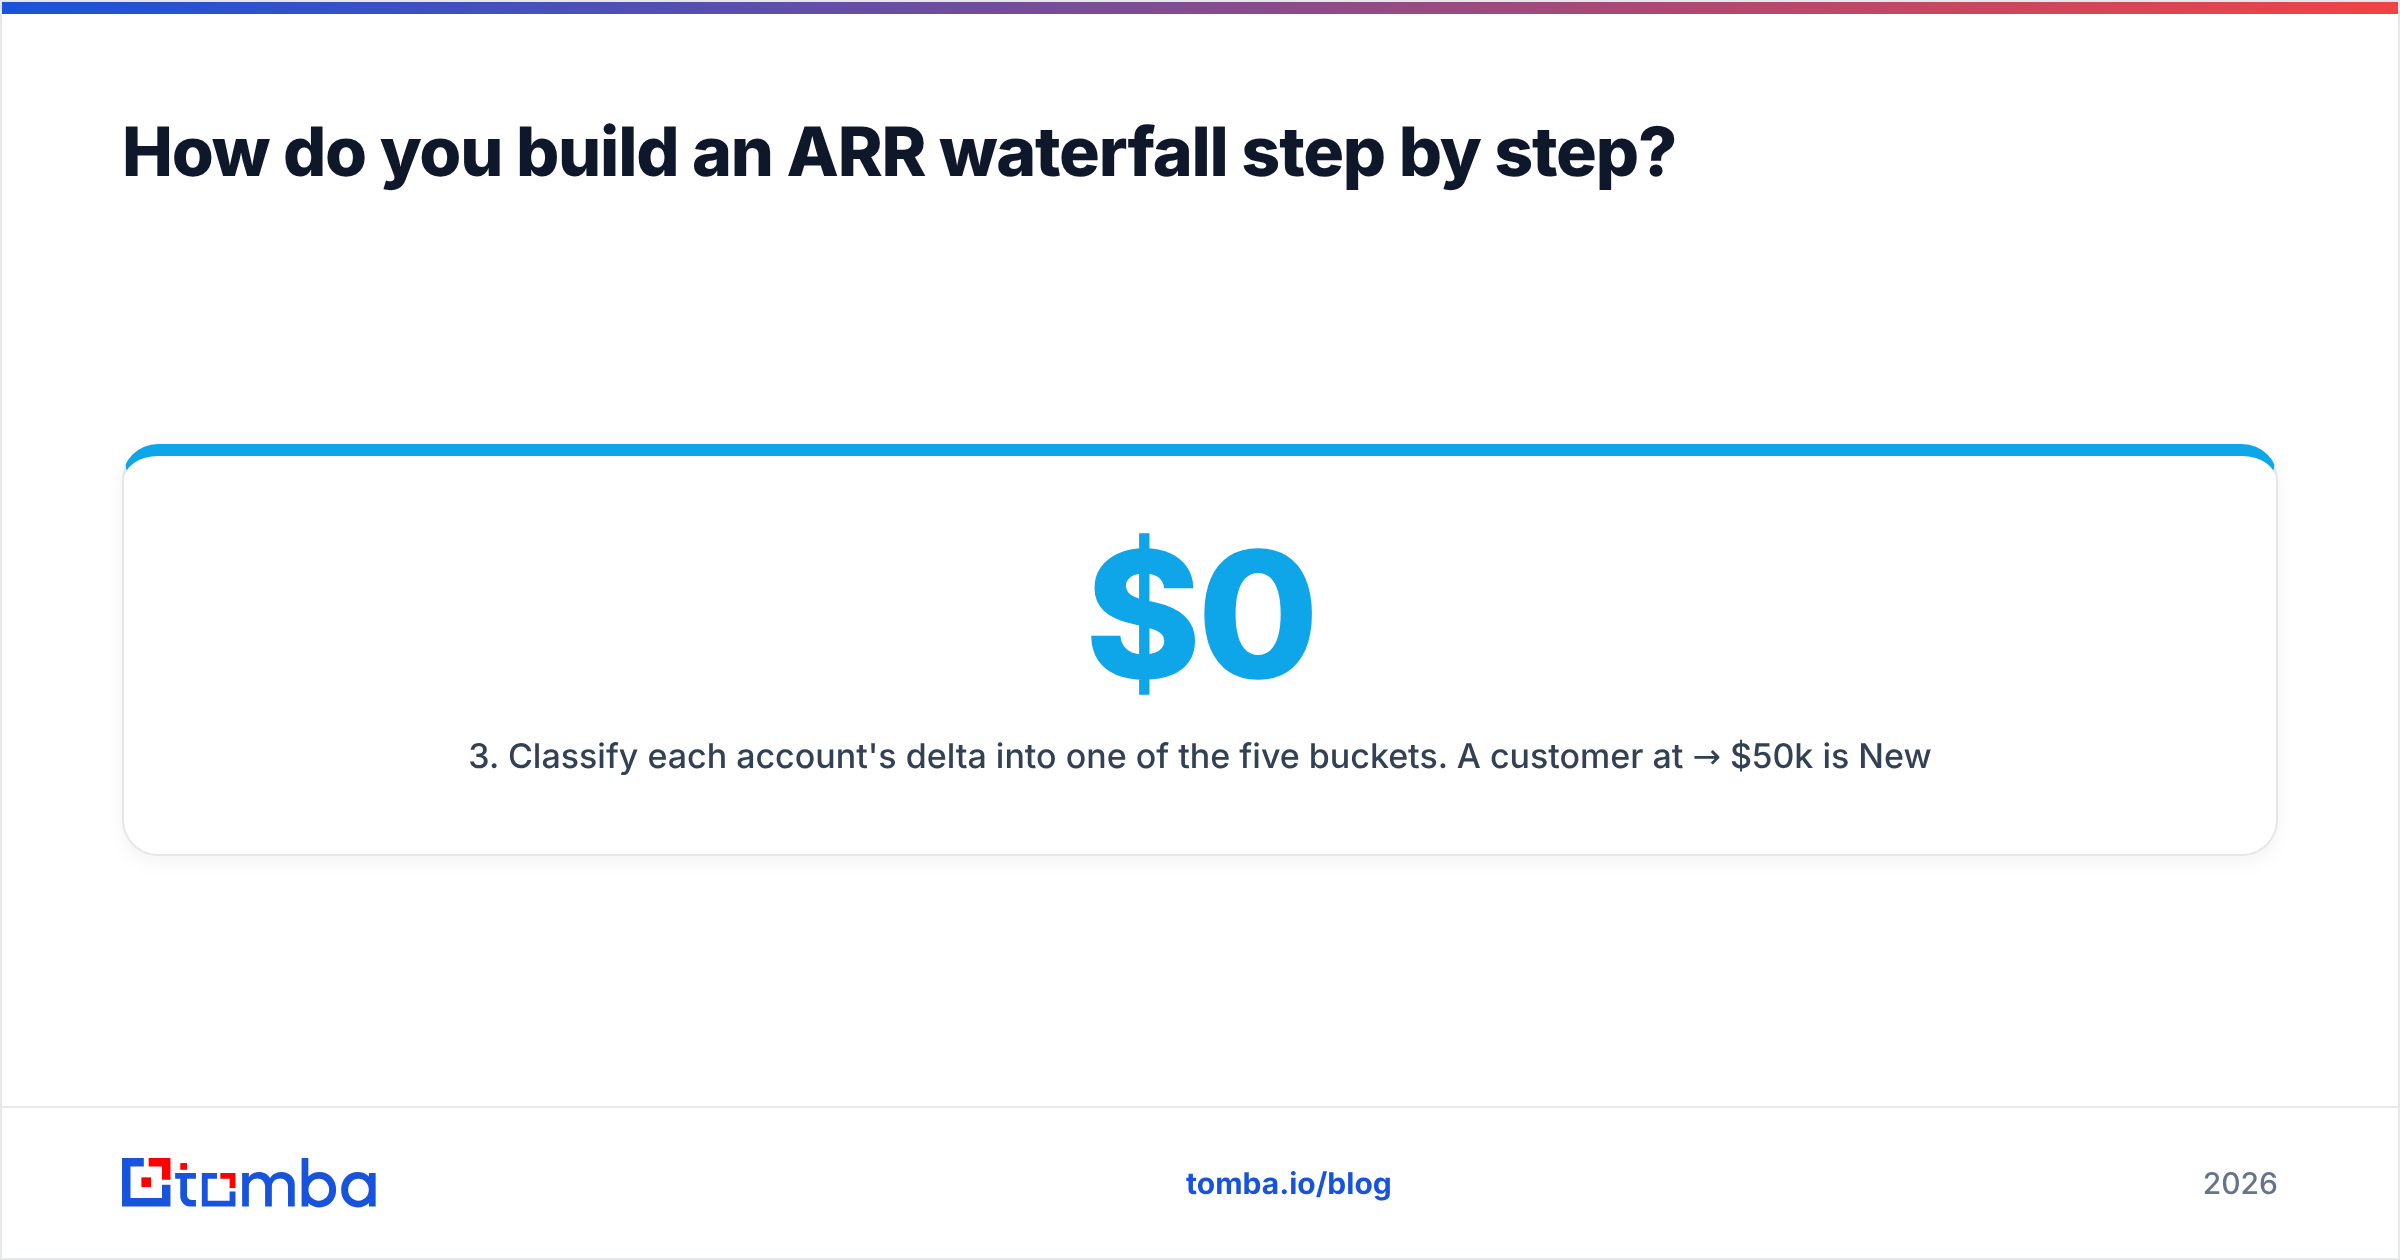
- Classify each account's delta into one of the five buckets. A customer at $0 → $50k is New. A customer at $50k → $70k is Expansion. $70k → $40k is Contraction. $40k → $0 is Churn. $0 → $30k where they previously existed is Reactivation.
- Sum each bucket and confirm the bridge ties: Beginning + New + Expansion + Reactivation − Contraction − Churn = Ending. If it doesn't tie to the penny, you have a classification error or a data gap.
- Layer in cohorts. Group customers by signup quarter so you can see whether newer cohorts retain better than older ones.
- Automate the snapshot. Once the logic is stable, move it out of a spreadsheet into your BI tool or RevOps stack so it refreshes itself.
The reconciliation step in #4 is non-negotiable. A waterfall that doesn't tie out is worse than no waterfall — it's a confident-looking number that's quietly wrong, and people will make staffing and spend decisions on it.
Why does data quality make or break your ARR waterfall?#
Garbage in, garbage waterfall. The model is simple arithmetic; the hard part is that the arithmetic runs on top of your CRM, and most CRMs are messier than their owners admit.
Three failure modes show up constantly:
- Duplicate accounts split one customer's ARR across two records, so an expansion looks like a new logo plus a churn. Your New and Churn buckets both inflate while NRR stays flat — a completely false picture.
- Stale contact and company data means you misattribute movement. A renamed or merged customer reads as churn-plus-new instead of a clean continuation.
- Missing firmographic fields make cohort and segment analysis impossible. You can compute a top-line waterfall but can't answer "which segment is leaking?"
This is where clean enrichment quietly pays for itself. Keeping account records deduplicated and current — correct company, domain, headcount, and contacts — is what lets the waterfall segment cleanly. Tomba's data enrichment and bulk lead generation tooling exist precisely to keep those underlying records trustworthy, and a periodic pass with an email verifier keeps your outreach lists from rotting between renewal cycles. Gartner has written extensively on how poor data quality erodes revenue decisions; the waterfall is where that erosion becomes visible.
ARR waterfall vs. MRR movement: are they the same thing?#
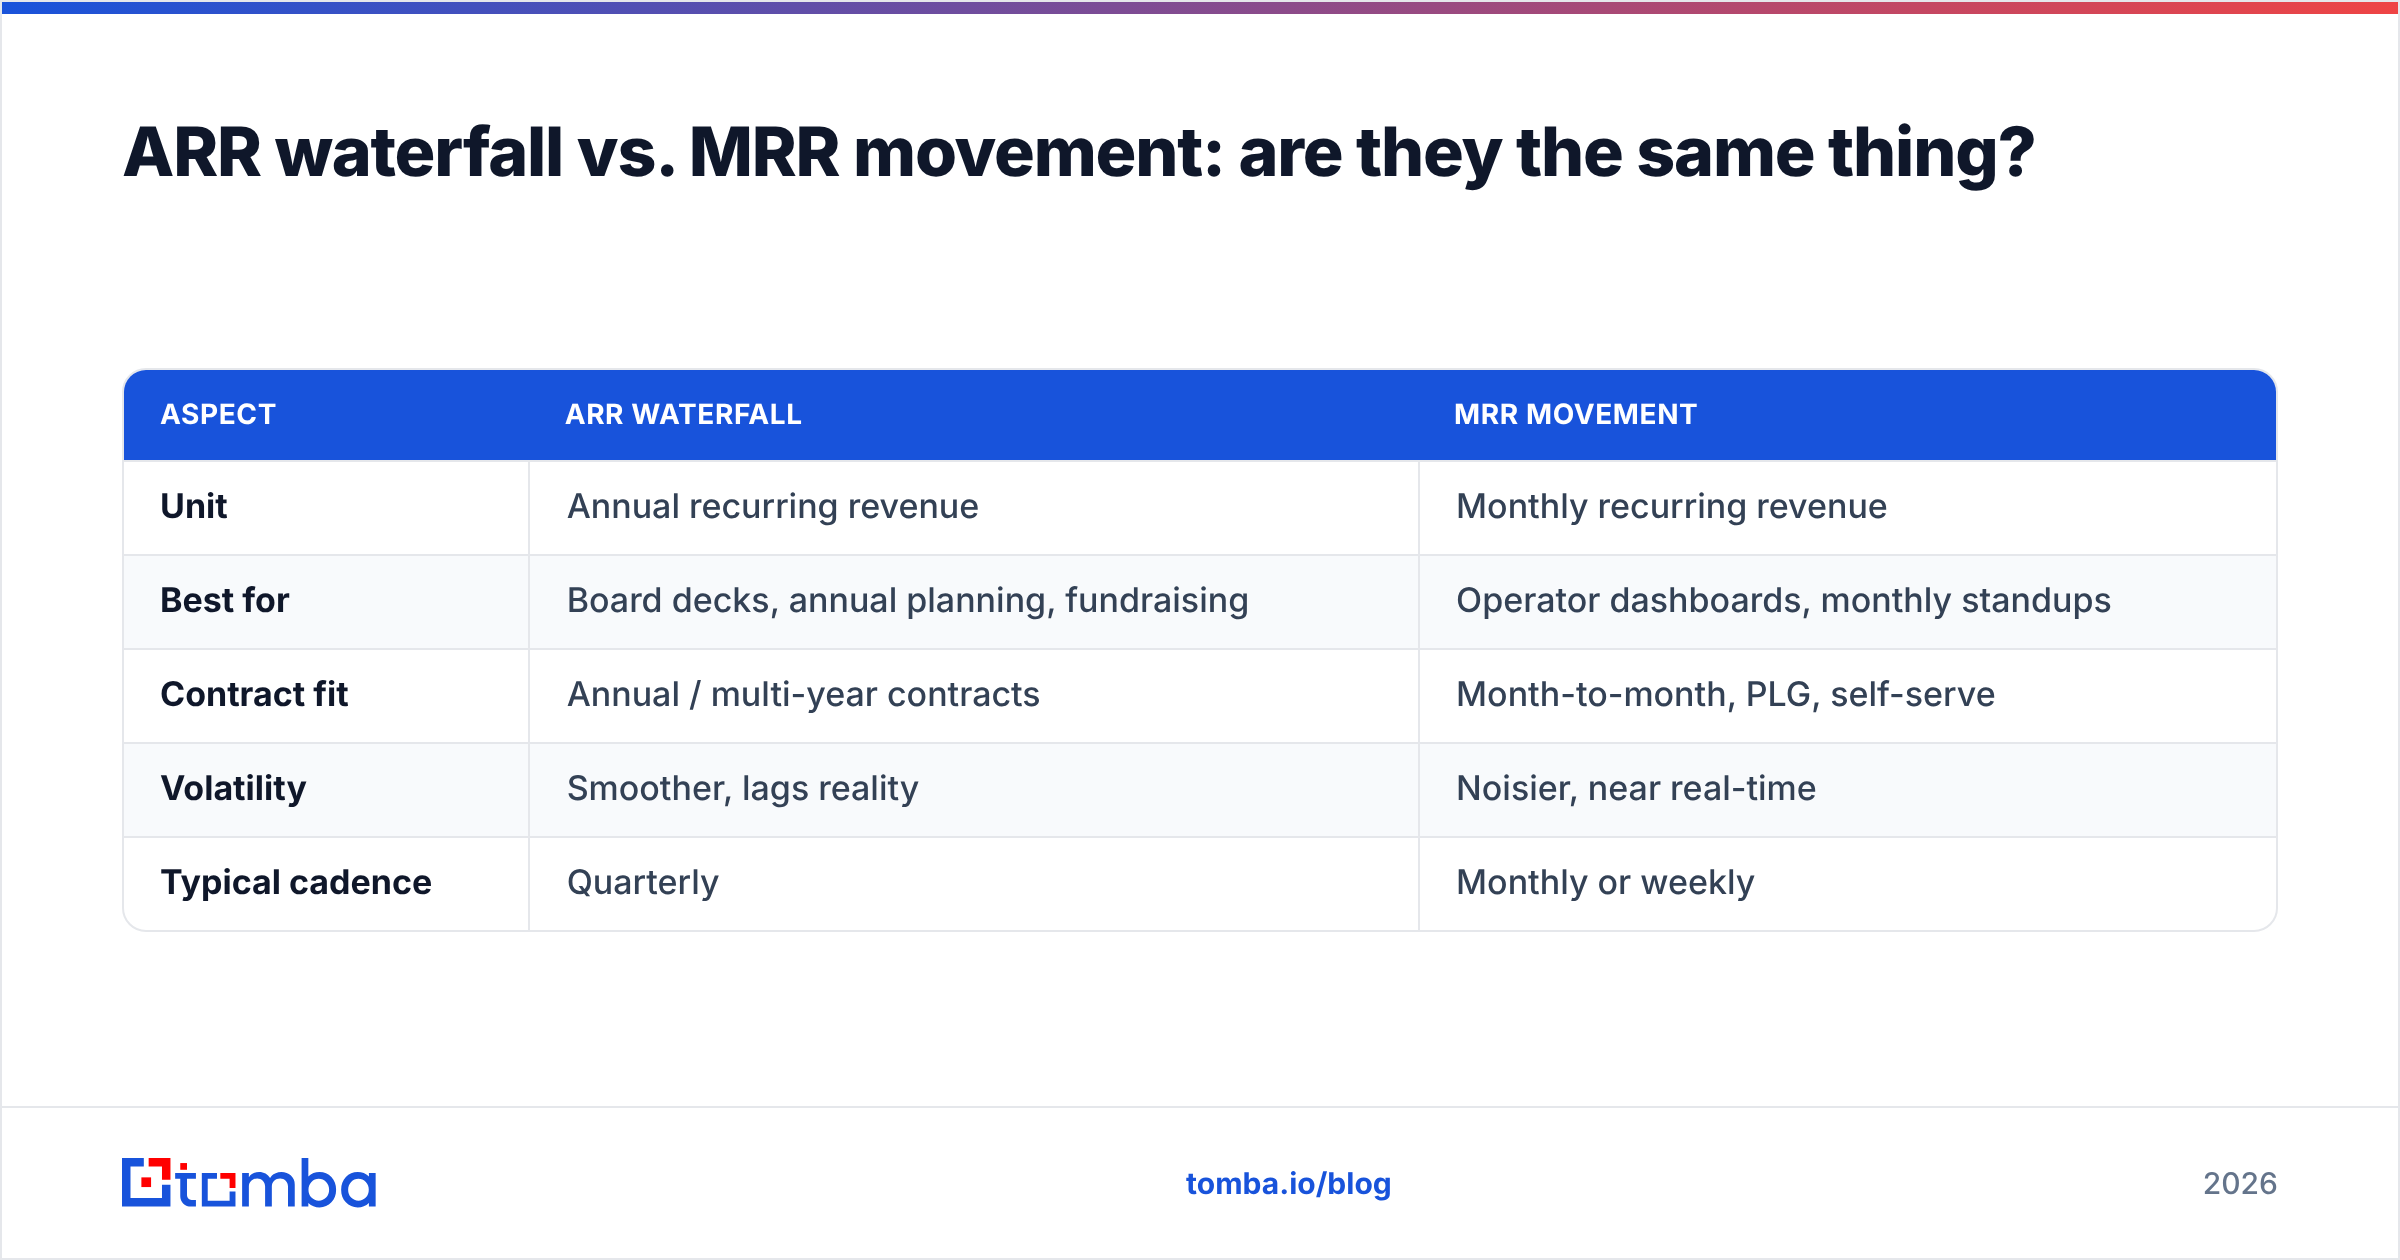
Nearly. The mechanics are identical — same five buckets, same bridge logic. The difference is the unit and the audience.
| Aspect | ARR waterfall | MRR movement |
|---|---|---|
| Unit | Annual recurring revenue | Monthly recurring revenue |
| Best for | Board decks, annual planning, fundraising | Operator dashboards, monthly standups |
| Contract fit | Annual / multi-year contracts | Month-to-month, PLG, self-serve |
| Volatility | Smoother, lags reality | Noisier, near real-time |
| Typical cadence | Quarterly | Monthly or weekly |
If most of your contracts are annual, lead with ARR — MRR will jump around as multi-year deals book. If you're product-led with monthly billing, MRR movement is the more honest real-time signal and you can roll it up to ARR for the board. Many teams maintain both and reconcile them quarterly.
What tools do you use to track an ARR waterfall?#
Your options scale with company stage:
- Spreadsheets (Sheets / Excel) — right for pre–Series A. Cheap, flexible, and forces you to understand the logic. Becomes a liability past a few hundred accounts. Tomba's Google Sheets add-on and Excel add-in help keep the underlying contact data fresh inside the spreadsheet you're already in.
- Billing-native analytics (Stripe, Chargebee, Maxio) — pull movement straight from billing events. Accurate for revenue but blind to CRM context like segment or owner.
- BI tools (Looker, Metabase, Tableau) — model the waterfall once, refresh forever, slice by any dimension. The standard at scale.
- Dedicated SaaS-metrics platforms — purpose-built waterfalls and cohort retention out of the box. Compare options on G2's revenue analytics category before committing.
Whatever you choose, the bottleneck is rarely the visualization layer — it's the B2B data feeding it. A beautiful Looker dashboard built on duplicated accounts is a beautiful wrong answer.
What are the most common ARR waterfall mistakes?#
- Counting reactivation as new. It inflates new-logo efficiency and hides a churn-then-return pattern you should be studying.
- Netting expansion against churn. Always report them gross. A net number of "+$0" could mean nothing happened or could mean $500k expansion offset $500k churn — wildly different stories.
- Ignoring contraction. Partial downgrades are the early-warning signal for full churn next renewal. Track them separately and act on them.
- Mixing booked vs. recognized revenue. Pick one convention — usually ARR-as-booked at contract start — and stamp it on the report so nobody re-litigates it monthly.
- Letting definitions drift. If "expansion" means different things to finance and sales, your waterfall becomes a debate instead of a decision tool. Write the definitions down once.
Keep your ARR waterfall honest with clean data#
The waterfall is only as trustworthy as the customer records underneath it. Before your next board cycle, dedupe your accounts, fill the firmographic gaps, and verify the contacts attached to every renewal. Tomba's Email Finder — together with its enrichment and verification tools — keeps the company and contact data behind your ARR model accurate, so every cohort ties out and every retention number holds up under scrutiny. Start free with 25 searches a month, and check the full Tomba pricing when you're ready to enrich at scale. A clean waterfall starts with clean data.
Ready to find emails that actually work?
Join 150,000+ professionals who stopped guessing and started sending. Free credits on signup — no credit card required.
Get the Tomba newsletter
Practical outbound tactics and product updates — once every two weeks.
About the author