Average B2B Lead Conversion Rate in 2026: Real Benchmarks
What is a healthy B2B lead conversion rate in 2026? See stage-by-stage benchmarks, the math behind each rate, and the levers that actually move the number.
TL;DR
- The average B2B lead conversion rate (lead-to-customer) sits around 2-5% in 2026, but the number is meaningless until you split it by funnel stage and lead source.
- MQL-to-SQL averages ~13%, SQL-to-opportunity ~50-60%, and opportunity-to-close ~20-30% — multiply them and you land near that 2-5% figure.
- Inbound and referral leads convert 3-5x better than cold-purchased lists, which is why data quality beats data quantity every time.
- The fastest lever is not more leads — it's faster follow-up, tighter qualification, and clean contact data so reps spend time selling, not chasing bounced emails.
- Benchmark against your own trailing 90 days first; industry averages are a sanity check, not a target.
What is the average B2B lead conversion rate?#
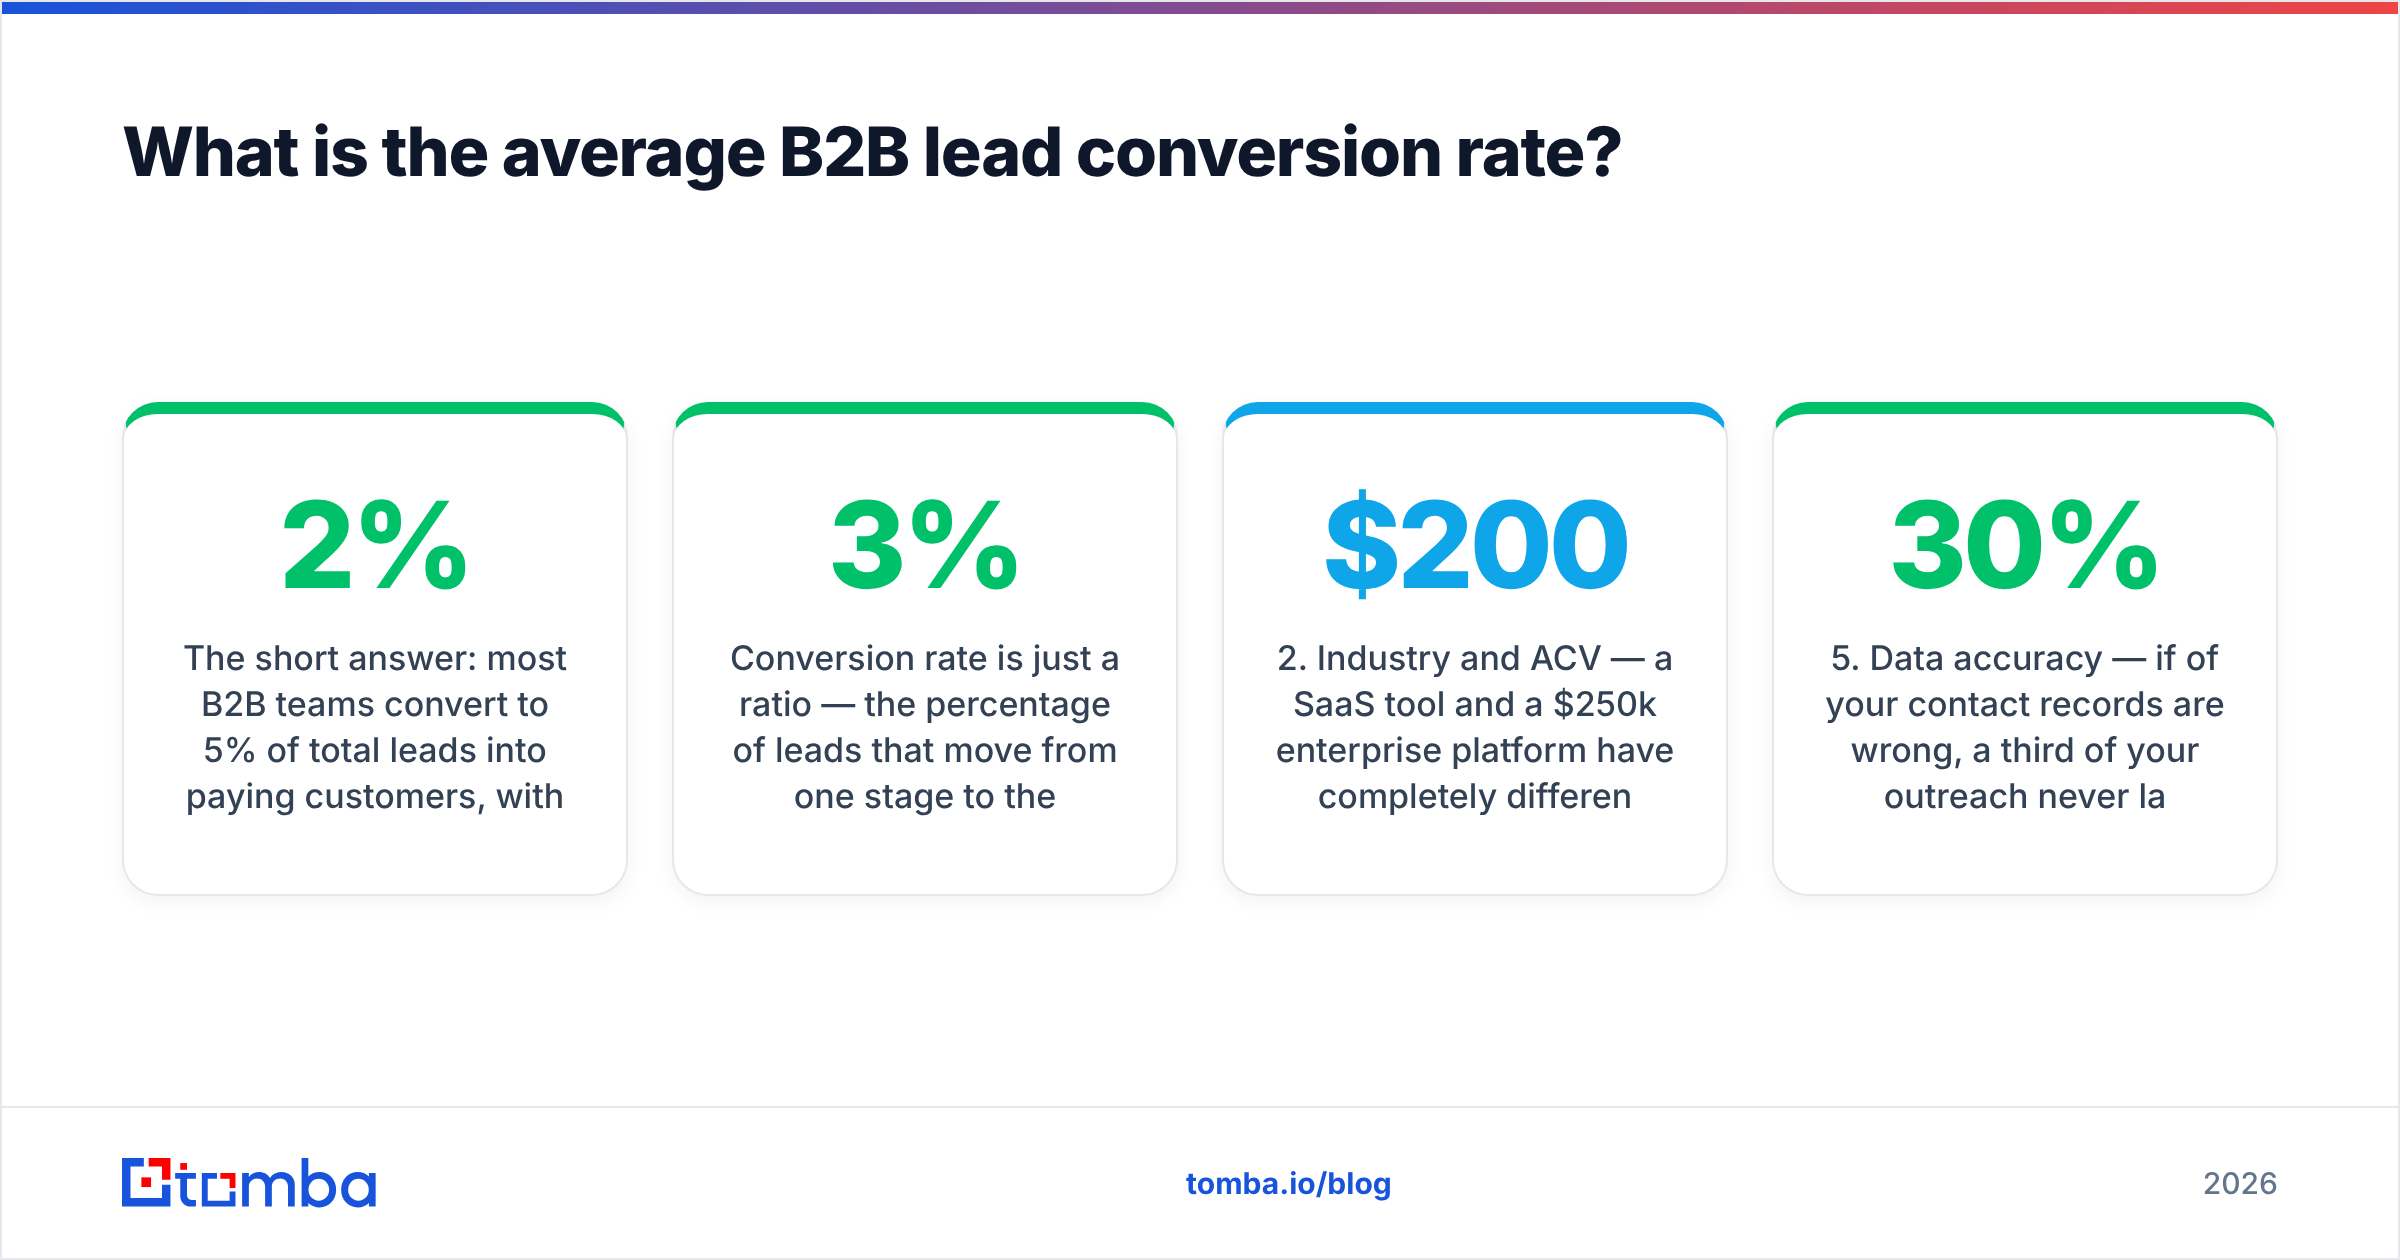
The short answer: most B2B teams convert 2% to 5% of total leads into paying customers, with a typical median around 3%. That single number hides enormous variance, so treat it as a starting reference, not a verdict on your funnel.
Conversion rate is just a ratio — the percentage of leads that move from one stage to the next. When people say "conversion rate" without context, they usually mean lead-to-customer across the entire journey. But a 3% lead-to-customer rate can come from a strong top of funnel with a leaky middle, or a weak top of funnel with surgical sales execution. You can't fix what you can't separate.
The variables that swing the average the most:
- Lead source — inbound demo requests convert far higher than scraped cold lists.
- Industry and ACV — a $200/mo SaaS tool and a $250k enterprise platform have completely different funnels.
- Definition of "lead" — counting every newsletter signup as a lead will crush your rate versus counting only sales-accepted leads.
- Sales cycle length — long cycles mean leads sit in "open" for months, distorting any point-in-time rate.
- Data accuracy — if 30% of your contact records are wrong, a third of your outreach never lands.
How do you calculate B2B lead conversion rate?#
Conclusion first: divide the number that converted by the number that entered, for the exact stage you care about, over a fixed time window.
The base formula:
Conversion rate = (conversions ÷ total leads) × 100
So 40 new customers from 1,000 leads is a 4% lead-to-customer rate. Simple — but the useful work is in measuring each stage separately so you can see where leads die.
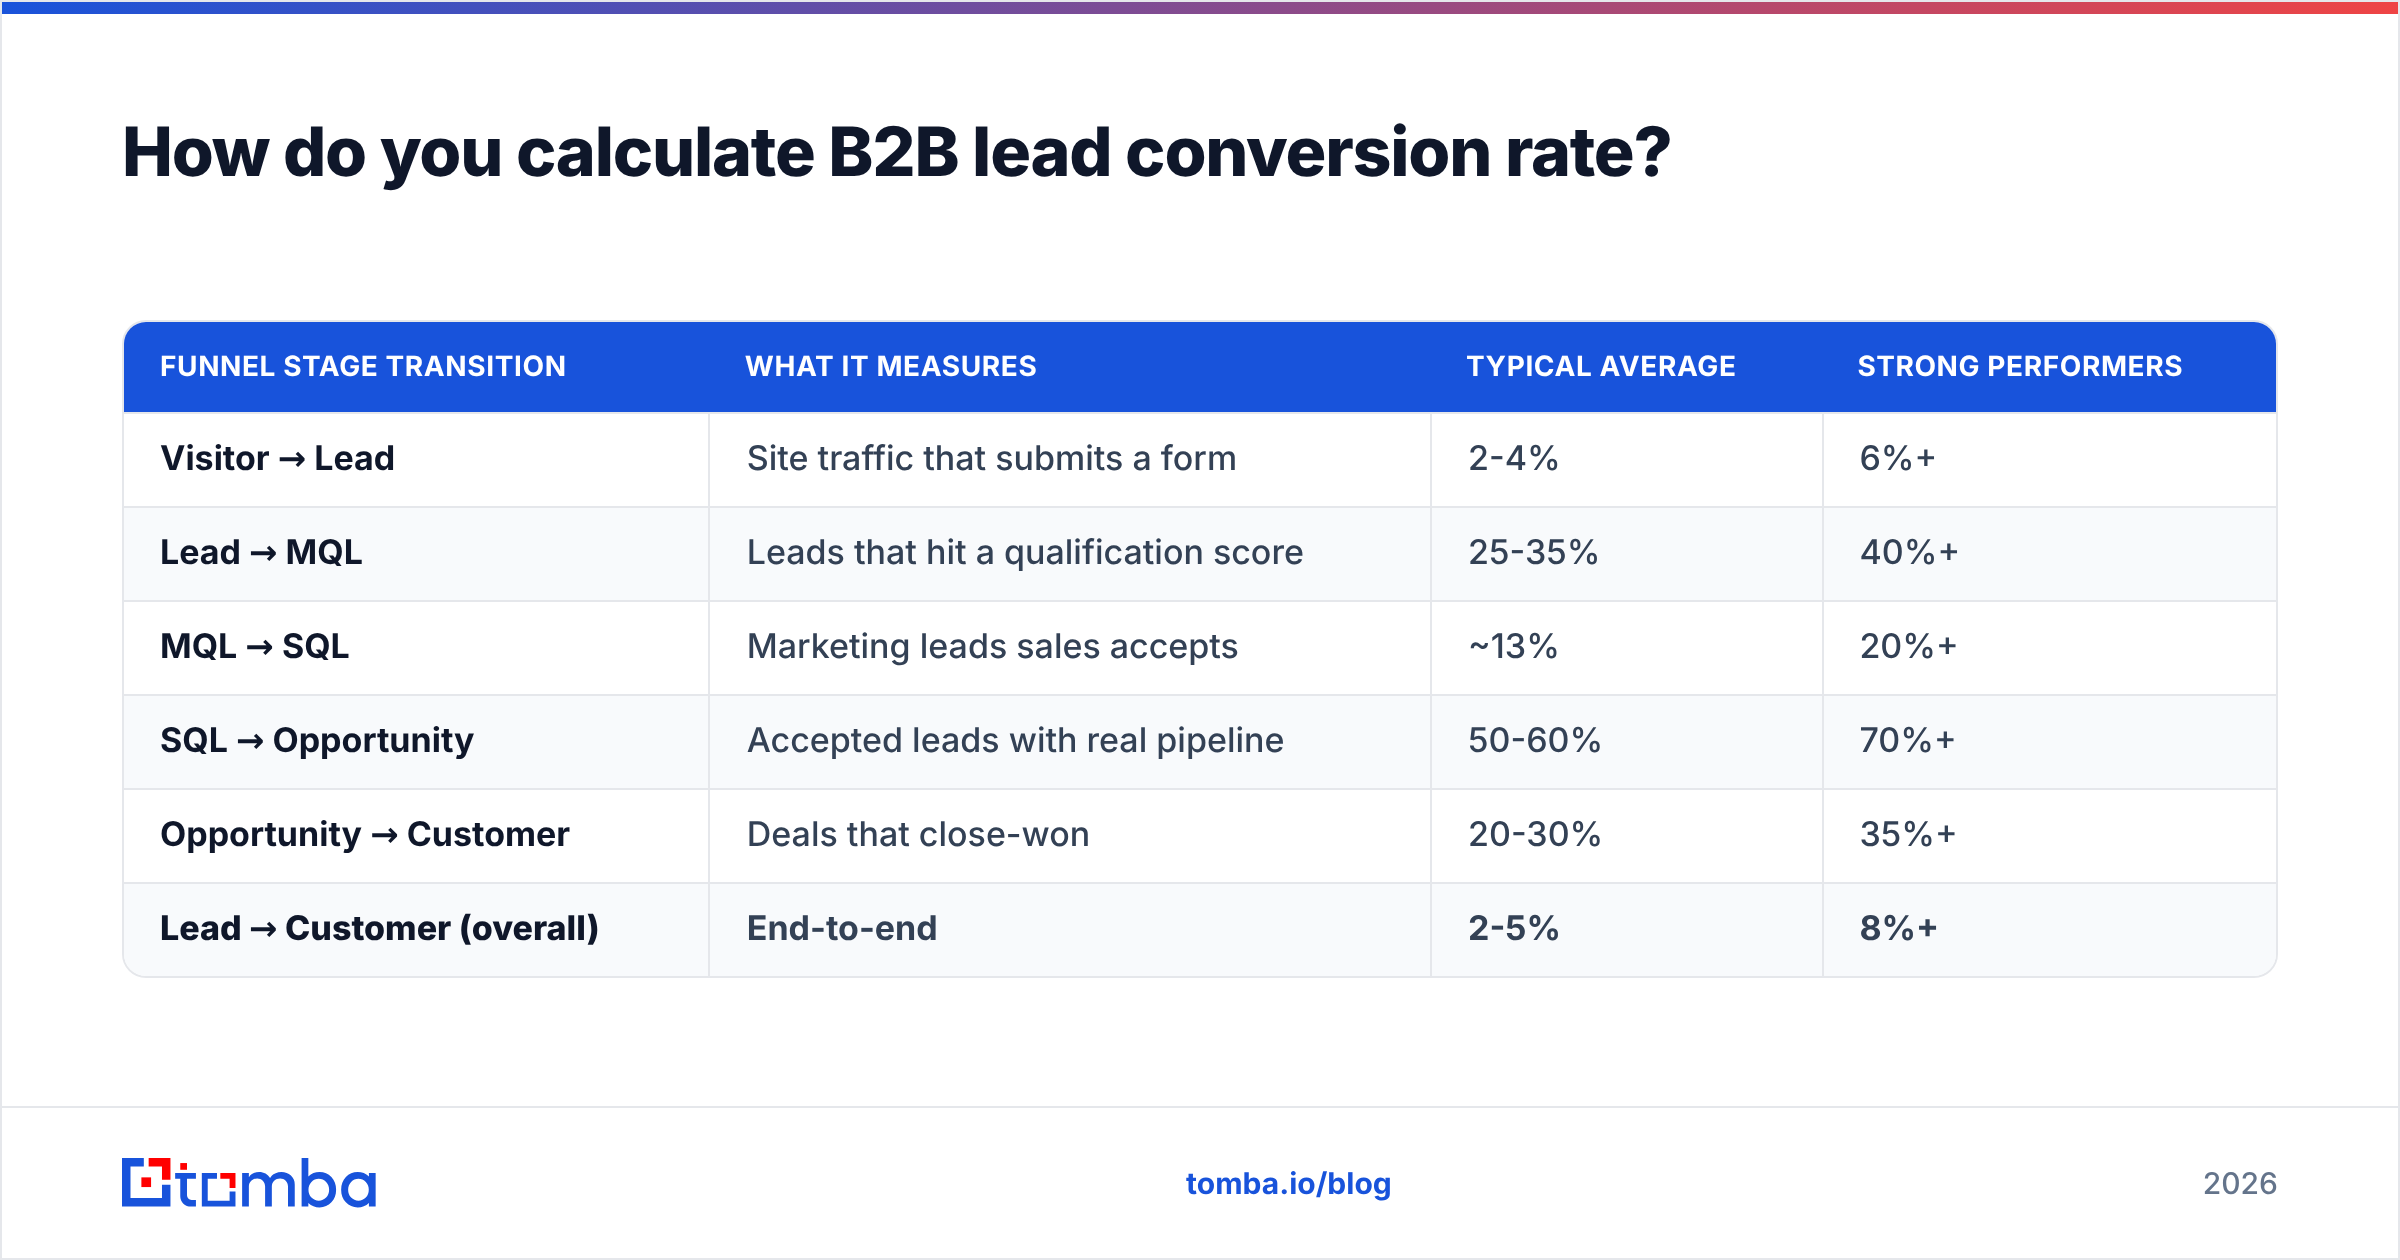
Here is the standard B2B funnel broken into the rates that matter, with rough 2026 benchmarks for a mid-market SaaS motion:
| Funnel stage transition | What it measures | Typical average | Strong performers |
|---|---|---|---|
| Visitor → Lead | Site traffic that submits a form | 2-4% | 6%+ |
| Lead → MQL | Leads that hit a qualification score | 25-35% | 40%+ |
| MQL → SQL | Marketing leads sales accepts | ~13% | 20%+ |
| SQL → Opportunity | Accepted leads with real pipeline | 50-60% | 70%+ |
| Opportunity → Customer | Deals that close-won | 20-30% | 35%+ |
| Lead → Customer (overall) | End-to-end | 2-5% | 8%+ |
Notice how the overall rate is the product of every stage, not an average of them. If each transition leaks even slightly, the compounding effect is brutal: five stages at 50% efficiency each leaves you converting roughly 3% end to end. That's why chasing one giant "fix" rarely works — small gains at multiple stages multiply.
For a refresher on how qualification thresholds feed these numbers, the definition of a marketing qualified lead is worth aligning your team on before you argue about benchmarks.
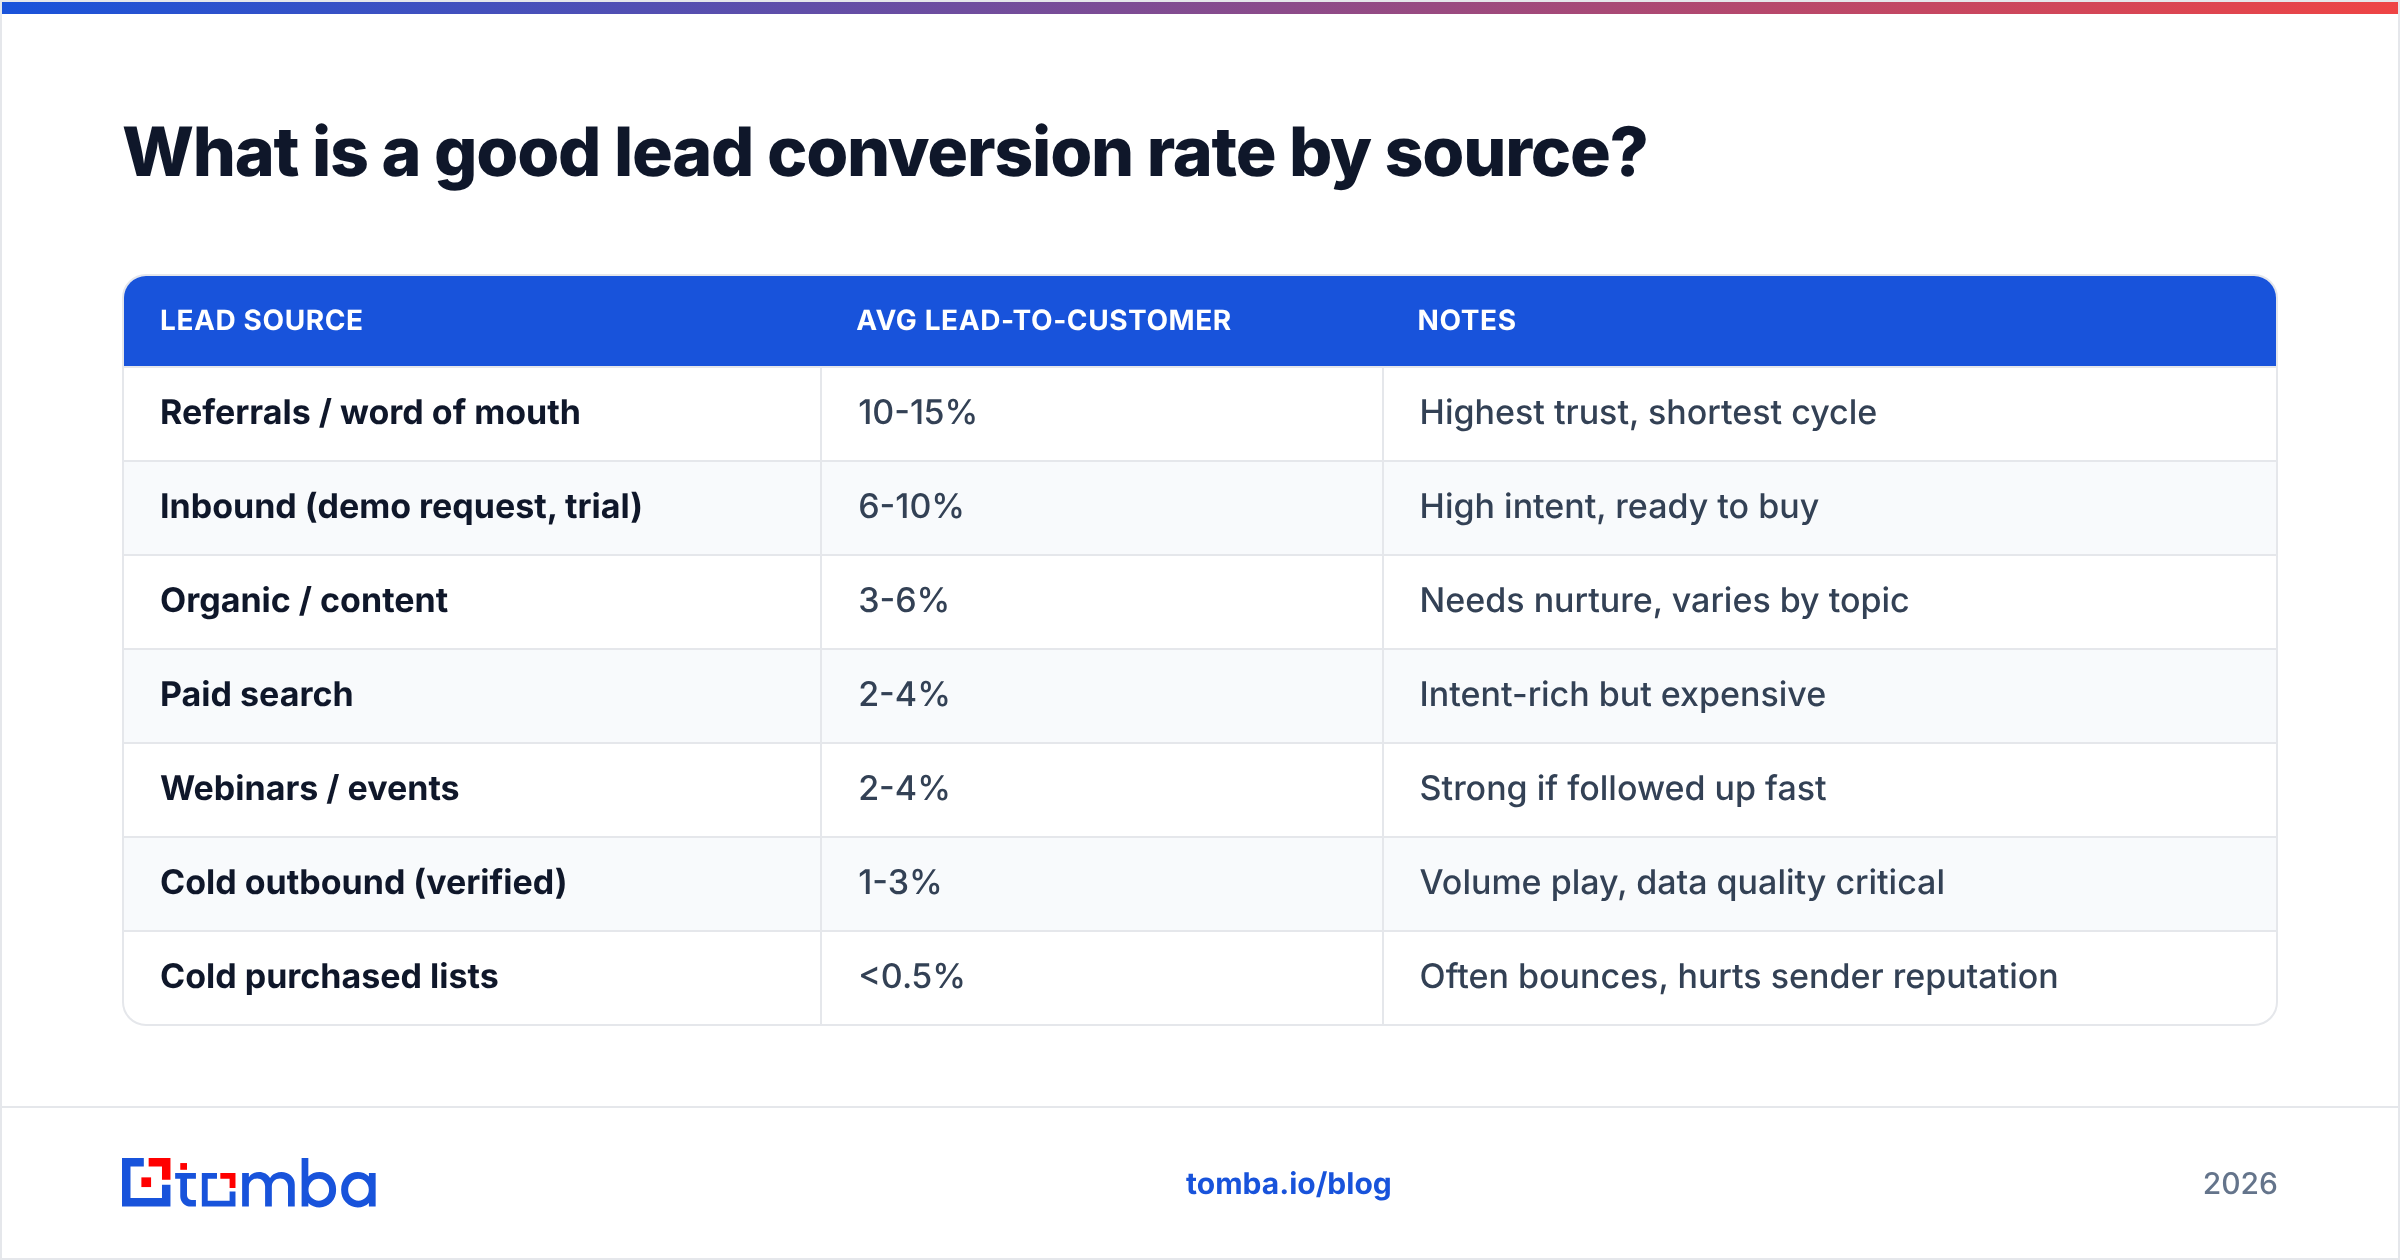
What is a good lead conversion rate by source?#
Source is the single biggest predictor of conversion, so segment every report by it. A blended average lies to you.
| Lead source | Avg lead-to-customer | Notes |
|---|---|---|
| Referrals / word of mouth | 10-15% | Highest trust, shortest cycle |
| Inbound (demo request, trial) | 6-10% | High intent, ready to buy |
| Organic / content | 3-6% | Needs nurture, varies by topic |
| Paid search | 2-4% | Intent-rich but expensive |
| Webinars / events | 2-4% | Strong if followed up fast |
| Cold outbound (verified) | 1-3% | Volume play, data quality critical |
| Cold purchased lists | <0.5% | Often bounces, hurts sender reputation |
The gap between verified cold outbound and a purchased list is the whole ballgame. A purchased list with 30% invalid addresses doesn't just waste sends — it tanks your email deliverability and gets your domain flagged, which then drags down the leads that would have converted. Cleaning the list with an email verifier before the first send routinely lifts effective conversion more than any subject-line tweak.
According to HubSpot's sales benchmark research, the teams with the highest conversion don't have magic scripts — they have faster response times and cleaner data. Salesforce's State of Sales reporting echoes it: reps spend less than a third of their week actually selling, and a big chunk of the rest is wasted on bad contact info.
Why is your B2B conversion rate lower than the benchmark?#
Conclusion first: it's almost always one of four leaks — bad data, slow follow-up, loose qualification, or a misaligned definition of "lead."
1. Dirty or incomplete contact data. If a rep can't reach the buyer, nothing else matters. Bounced emails, wrong direct dials, and outdated job titles silently cap your ceiling. This is the most fixable problem and the most ignored.
2. Slow speed-to-lead. Responding within five minutes versus an hour can change contact rates by an order of magnitude. Most B2B teams still take hours. Every minute a hot lead waits, intent decays.
3. Qualification that's too loose (or too tight). Pass everything to sales and reps drown in junk, killing SQL rates. Gate too hard and you starve the pipeline. Your MQL→SQL rate is the dashboard light here — if it's under 10%, marketing and sales disagree on what a lead is.
4. A "lead" definition that inflates the denominator. If a content download counts the same as a demo request, your top of funnel looks huge and your conversion rate looks terrible. Separate them.
The data leak deserves special attention because it compounds. Say you buy 5,000 contacts and 28% are invalid. You've already lost 1,400 leads before the first touch — and worse, the bounces signal spam to mailbox providers, throttling delivery to the 3,600 good ones. Running those contacts through a bulk email finder and verification step first means your reps work a list that's real, and your sender reputation stays intact.
How do you improve B2B lead conversion rate in 2026?#
Here's the priority order that actually moves the needle, highest leverage first:
- Fix your data before you fix your funnel. Verify every email, enrich missing direct dials and titles, and remove duplicates. A clean list lifts contact rate, which lifts every downstream stage. Use data enrichment to fill gaps rather than discarding incomplete records.
- Cut speed-to-lead to under five minutes. Route hot inbound leads to reps instantly with alerts and round-robin assignment. This is often the single biggest one-week win.
- Tighten the MQL definition with sales. Agree on a lead score threshold both teams sign off on, then watch MQL→SQL climb.
- Personalize the first touch with real context. Generic blasts convert poorly. Pulling a verified email plus the prospect's role and company lets reps open with relevance.
- Nurture the 95% who aren't ready. Most leads won't buy today. A sequenced nurture track recovers deals that a one-and-done outreach loses.
- Measure stage-by-stage and attack the worst rate. Don't optimize blindly — find the leakiest transition and fix that one first.
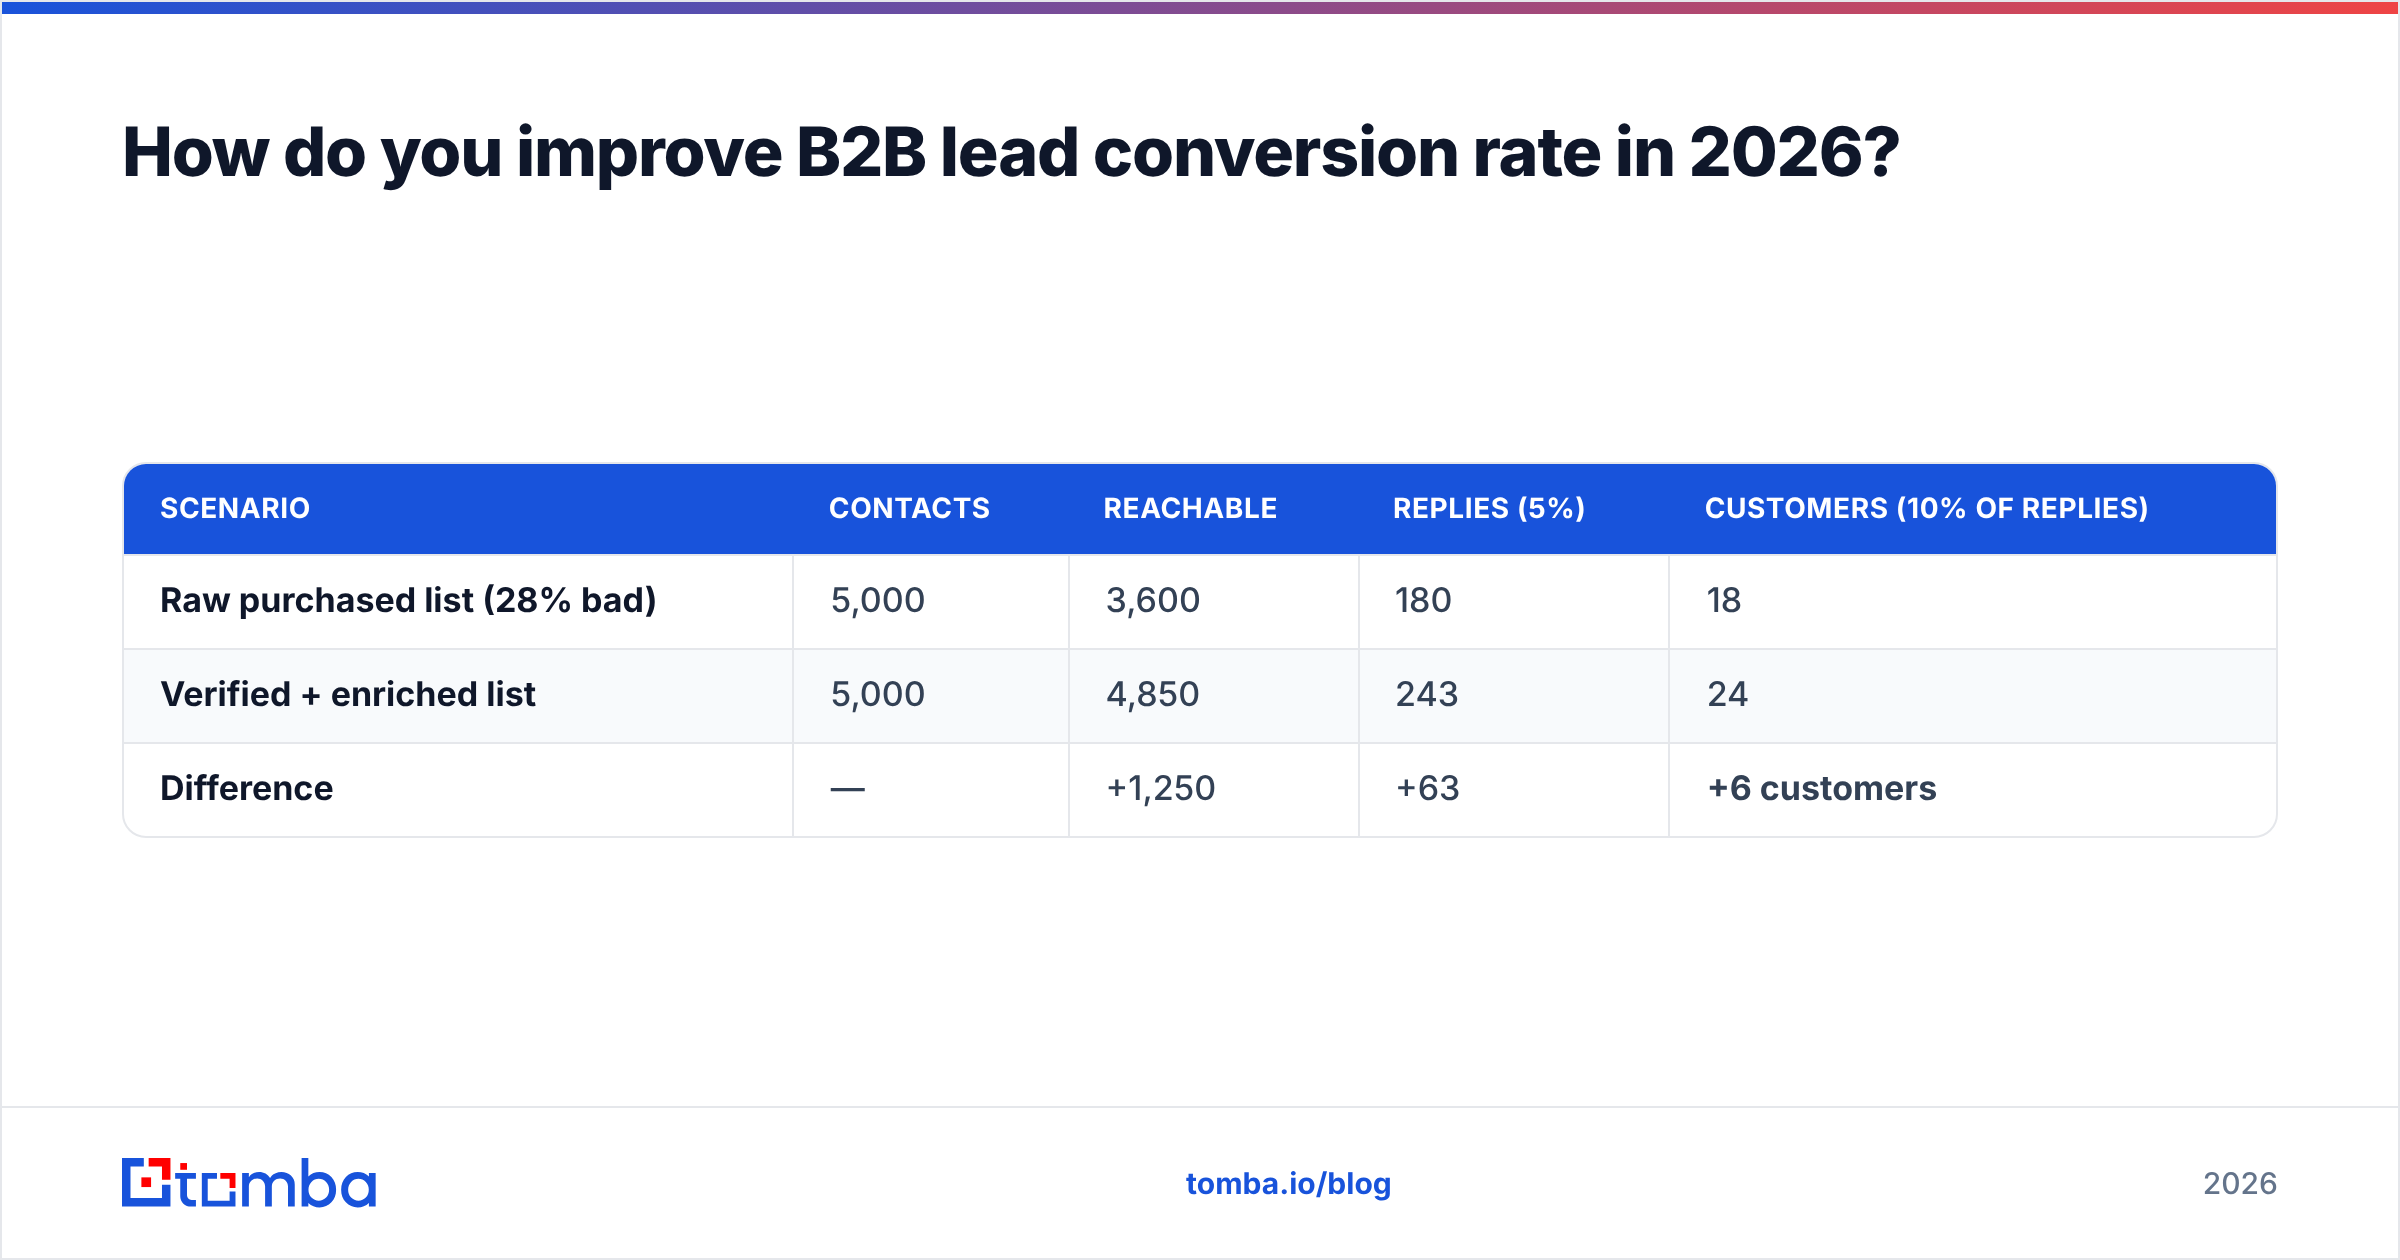
A practical example of how data quality cascades:
| Scenario | Contacts | Reachable | Replies (5%) | Customers (10% of replies) |
|---|---|---|---|---|
| Raw purchased list (28% bad) | 5,000 | 3,600 | 180 | 18 |
| Verified + enriched list | 5,000 | 4,850 | 243 | 24 |
| Difference | — | +1,250 | +63 | +6 customers |
Same list size, same outreach, same close rate — a third more customers purely from clean data. That's why teams that adopt a verification-first workflow see conversion gains that look almost too good until you trace the math.
If you want to operationalize this, the standard stack is a domain search to map the buying committee at target accounts, an email finder to get verified addresses, and an enrichment pass to fill in the rest before anything enters your CRM.
What conversion rate should you actually target?#
Benchmark against yourself first. Pull your trailing 90 days, calculate each stage rate, and set a realistic 10-20% improvement goal on your single weakest transition. Hitting a generic "5%" is the wrong target if your enterprise motion naturally runs at 2% with huge ACVs.
A quick reality check on what "good" looks like by motion:
- High-velocity SMB SaaS: 4-8% lead-to-customer, short cycles, volume matters.
- Mid-market: 2-5%, balanced between volume and qualification.
- Enterprise / high-ACV: 1-3%, where a single 1% gain can mean millions.
The point of any benchmark is to find the gap, not to declare victory. If your number is below these ranges, the diagnosis is almost always upstream — in the quality of the leads and the speed and relevance of the first touch — not in your closing skills.
Frequently asked questions#
What is the average B2B lead conversion rate? Roughly 2-5% lead-to-customer in 2026, with a median near 3%. Inbound and referral sources push higher; cold lists pull lower.
What's a good MQL-to-SQL conversion rate? Around 13% is average; strong teams hit 20%+. If you're under 10%, marketing and sales likely disagree on the lead definition.
Does data quality really change conversion that much? Yes. A list with 25-30% invalid contacts loses those leads outright and damages deliverability for the rest, so clean data often lifts effective conversion more than any copy change.
How fast should I follow up with a new lead? Under five minutes for hot inbound. Contact and conversion rates drop sharply with every passing hour.
Start with cleaner leads#
You can't out-sell a broken list. The fastest path to a higher average B2B lead conversion rate is to make sure every contact your reps touch is real, reachable, and relevant — before the first email goes out. Tomba's email finder gives you verified professional addresses by name, domain, or company, so your funnel starts with leads that actually convert instead of bounces that drag down your sender reputation. Start free with 25 searches a month, then scale on the Starter plan at $49/mo — see full Tomba pricing to match a tier to your volume. Feed clean data into the top of your funnel and watch every downstream rate move with it.
Ready to find emails that actually work?
Join 150,000+ professionals who stopped guessing and started sending. Free credits on signup — no credit card required.
Get the Tomba newsletter
Practical outbound tactics and product updates — once every two weeks.
About the author