Average CAC in 2026: B2B Benchmarks, Formula & How to Cut It
What's a healthy average CAC in 2026? Real B2B benchmarks by industry and channel, the formula, the LTV:CAC ratio that matters, and seven ways to bring it down.
TL;DR
- Average CAC (Customer Acquisition Cost) is total sales and marketing spend divided by new customers won in the same period. There is no single "good" number — it depends on your industry, motion, and contract value.
- In 2026, blended B2B SaaS CAC commonly lands between $700 and $1,400 for SMB deals and several thousand dollars for mid-market and enterprise.
- The metric that actually decides whether your CAC is healthy is the LTV:CAC ratio — aim for 3:1 or better, with a CAC payback under 12 months.
- The fastest lever on average CAC is usually lead quality, not ad spend. Better-targeted, verified contact data cuts wasted outreach more than any creative tweak.
- Tools like a bulk email finder and clean data enrichment reduce the cost-per-meeting that quietly inflates CAC.
What is average CAC and why does it matter?#
Average CAC is the typical amount you spend to win one new paying customer. Think of it like the price tag on a slot machine pull: if every pull costs $1,000 and pays back $4,000 over the customer's lifetime, you keep playing. If it pays back $900, you're lighting money on fire — politely, with great branding.
Formally, CAC sits at the center of revenue operations because it ties marketing, sales, and finance to the same number. Marketing wants more leads, sales wants better leads, and finance wants both to cost less. CAC is the referee.
It matters for three reasons:
- Fundability. Investors and boards read CAC and CAC payback as a proxy for how efficiently you grow.
- Pricing. If your average CAC creeps toward your annual contract value, your pricing or your motion is broken.
- Channel decisions. You can't kill an unprofitable channel until you know what each channel's CAC actually is.
How do you calculate average CAC?#
The core formula is deliberately simple:
Average CAC = (Total sales + marketing spend in a period) ÷ (New customers acquired in that period)
Say you spent $50,000 on marketing and $30,000 on sales last quarter and closed 80 new customers. Your average CAC is $80,000 ÷ 80 = $1,000.
The trouble starts with what you include. A defensible CAC calculation pulls in:
- Paid media — ads, sponsorships, retargeting.
- Salaries and commissions — the loaded cost of SDRs, AEs, and marketers, not just their base.
- Tools and software — your CRM, sequencer, data providers, and B2B database subscriptions.
- Content and creative — agencies, freelancers, design.
- Overhead allocation — the slice of management and ops that supports go-to-market.
Two common mistakes wreck the number:
- Blended vs. paid CAC confusion. Blended CAC includes organic and word-of-mouth customers in the denominator, which flatters the result. Paid CAC isolates customers won through paid effort. Report both, and label them.
- Timing mismatch. B2B sales cycles can run 60–120 days. If you divide this month's spend by this month's signups, you're comparing spend to customers it didn't generate. Match spend to the cohort it actually influenced.
What is a good average CAC in 2026 by industry?#
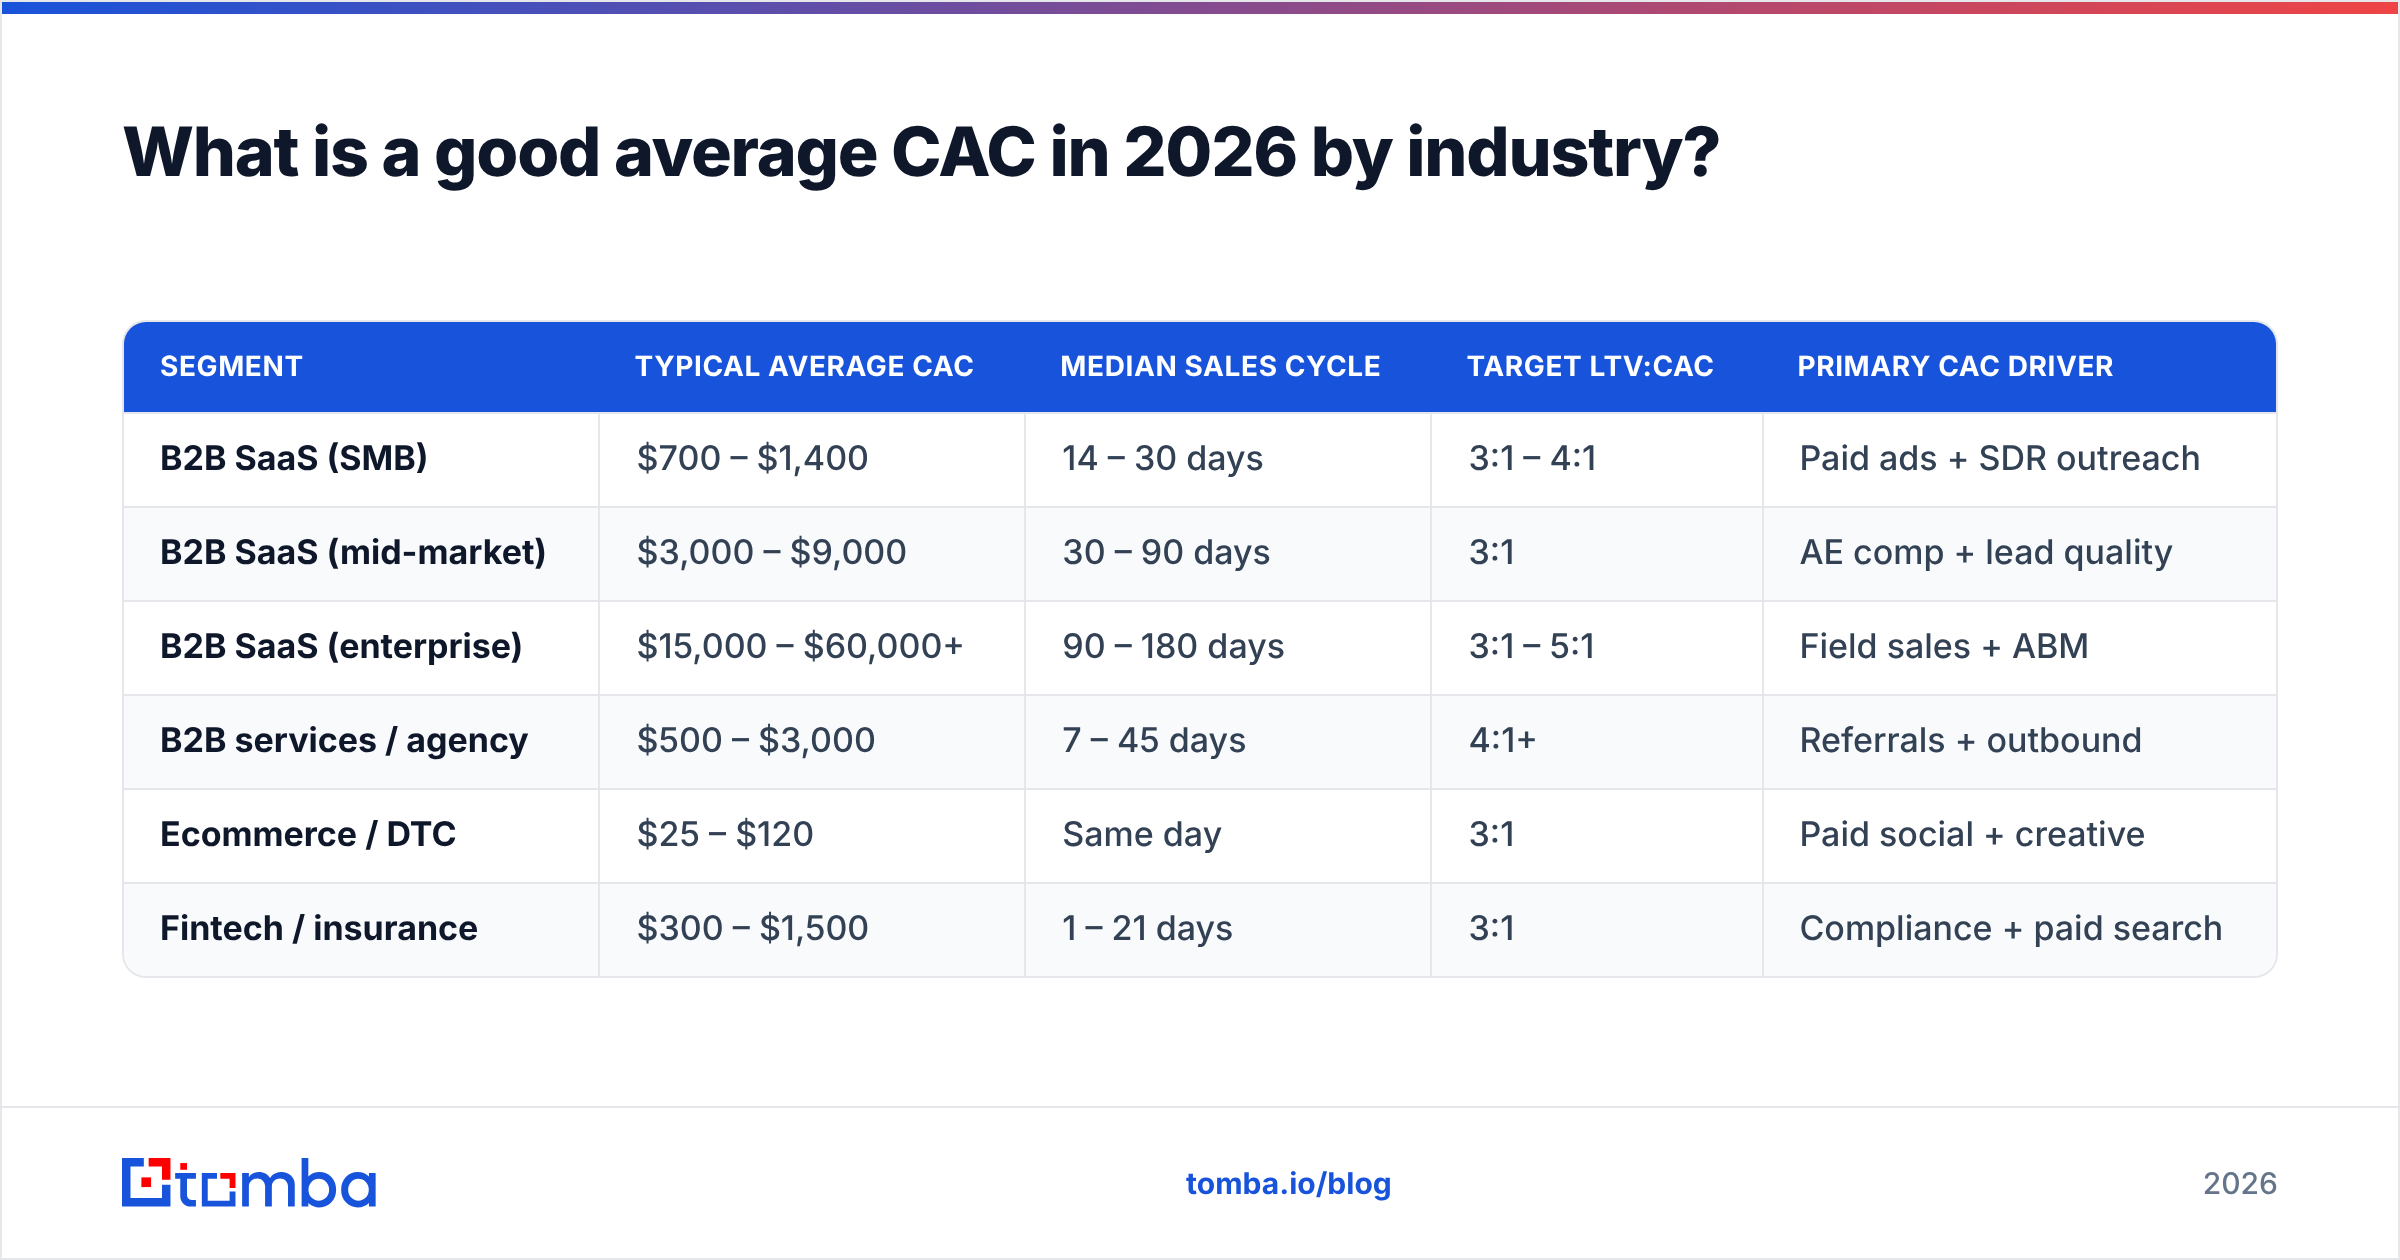
There is no universal "good" CAC — a $4,000 CAC is a triumph for a $60k enterprise contract and a disaster for a $300/year prosumer tool. Context is everything. Here's how typical 2026 averages stack up across common B2B segments.
| Segment | Typical average CAC | Median sales cycle | Target LTV:CAC | Primary CAC driver |
|---|---|---|---|---|
| B2B SaaS (SMB) | $700 – $1,400 | 14 – 30 days | 3:1 – 4:1 | Paid ads + SDR outreach |
| B2B SaaS (mid-market) | $3,000 – $9,000 | 30 – 90 days | 3:1 | AE comp + lead quality |
| B2B SaaS (enterprise) | $15,000 – $60,000+ | 90 – 180 days | 3:1 – 5:1 | Field sales + ABM |
| B2B services / agency | $500 – $3,000 | 7 – 45 days | 4:1+ | Referrals + outbound |
| Ecommerce / DTC | $25 – $120 | Same day | 3:1 | Paid social + creative |
| Fintech / insurance | $300 – $1,500 | 1 – 21 days | 3:1 | Compliance + paid search |
Treat these as guardrails, not gospel. Vertical, geography, and brand maturity move every row. The pattern that holds across all of them: higher contract value tolerates higher CAC, as long as the LTV:CAC ratio and payback period stay in range.
How does CAC differ by acquisition channel?#
Your blended average hides wildly different channel economics. Breaking CAC down by channel is where the real decisions live. Use these structured benchmarks to spot which channels are quietly subsidizing the others.
- Organic / SEO — Highest upfront effort, lowest marginal CAC. Once content ranks, incremental customers are nearly free, which is why content compounds.
- Referral / word-of-mouth — Usually the lowest CAC of any channel and the highest intent. The catch is you can't simply buy more of it.
- Outbound (cold email + calling) — Moderate CAC that lives or dies on data quality. Bad lists inflate cost-per-meeting fast; verified contacts pull it back down.
- Paid search — Predictable but rising. High-intent keywords are auctioned up every year, so CAC drifts upward without optimization.
- Paid social — Great for volume and retargeting, weakest for high-ticket B2B intent. Creative fatigue spikes CAC quickly.
- Events / field — Highest absolute CAC, but often the only motion that lands enterprise logos. Justify it on deal size, not volume.
When you map spend to each channel, you almost always find one or two channels carrying a CAC 3–5x the others. That's your optimization list.
What is the LTV:CAC ratio and why does it beat CAC alone?#
CAC on its own is a half-finished sentence. The ending is lifetime value. The LTV:CAC ratio tells you whether the customers you buy are worth what you pay.
- LTV:CAC of 3:1 is the widely cited healthy benchmark — every dollar acquired returns three over the customer's life.
- Below 1:1, you lose money on every customer and growth makes it worse.
- Above 5:1, you may be underinvesting — leaving growth on the table because you're too cautious with spend.
Pair the ratio with CAC payback period — how many months of gross margin it takes to recover CAC. Best-in-class B2B SaaS recovers CAC in under 12 months; under 18 is acceptable for enterprise. According to long-running benchmarks published by firms like Gartner and analyst surveys aggregated on G2, payback discipline separates efficient growers from the cash-burning kind. HubSpot's research on sales benchmarks tells the same story: efficiency, not raw lead volume, predicts durable growth.

Why is your average CAC higher than it should be?#
Most teams blame ad costs. The real culprit is usually upstream of the ad account. Here are the silent CAC inflators we see most often:
- Bad data. Bounced emails, wrong titles, and dead phone numbers mean reps work two leads to reach one. That doubles your effective cost-per-conversation.
- Wide targeting. Spraying a generic ICP wastes spend on prospects who will never buy. Narrow beats broad on CAC every time.
- Slow follow-up. Lead-to-first-touch lag tanks conversion, so you pay for clicks you never close.
- Channel monoculture. Over-relying on one paid channel means you ride its rising auction prices straight up.
- No verification step. Sending sequences to unverified addresses burns deliverability and sender reputation, which raises the cost of every future send.
Notice how many of these trace back to data, not creative. You can A/B test subject lines forever, but if 30% of your list is invalid, you've capped your CAC improvement before the first email goes out.
How do you lower your average CAC?#
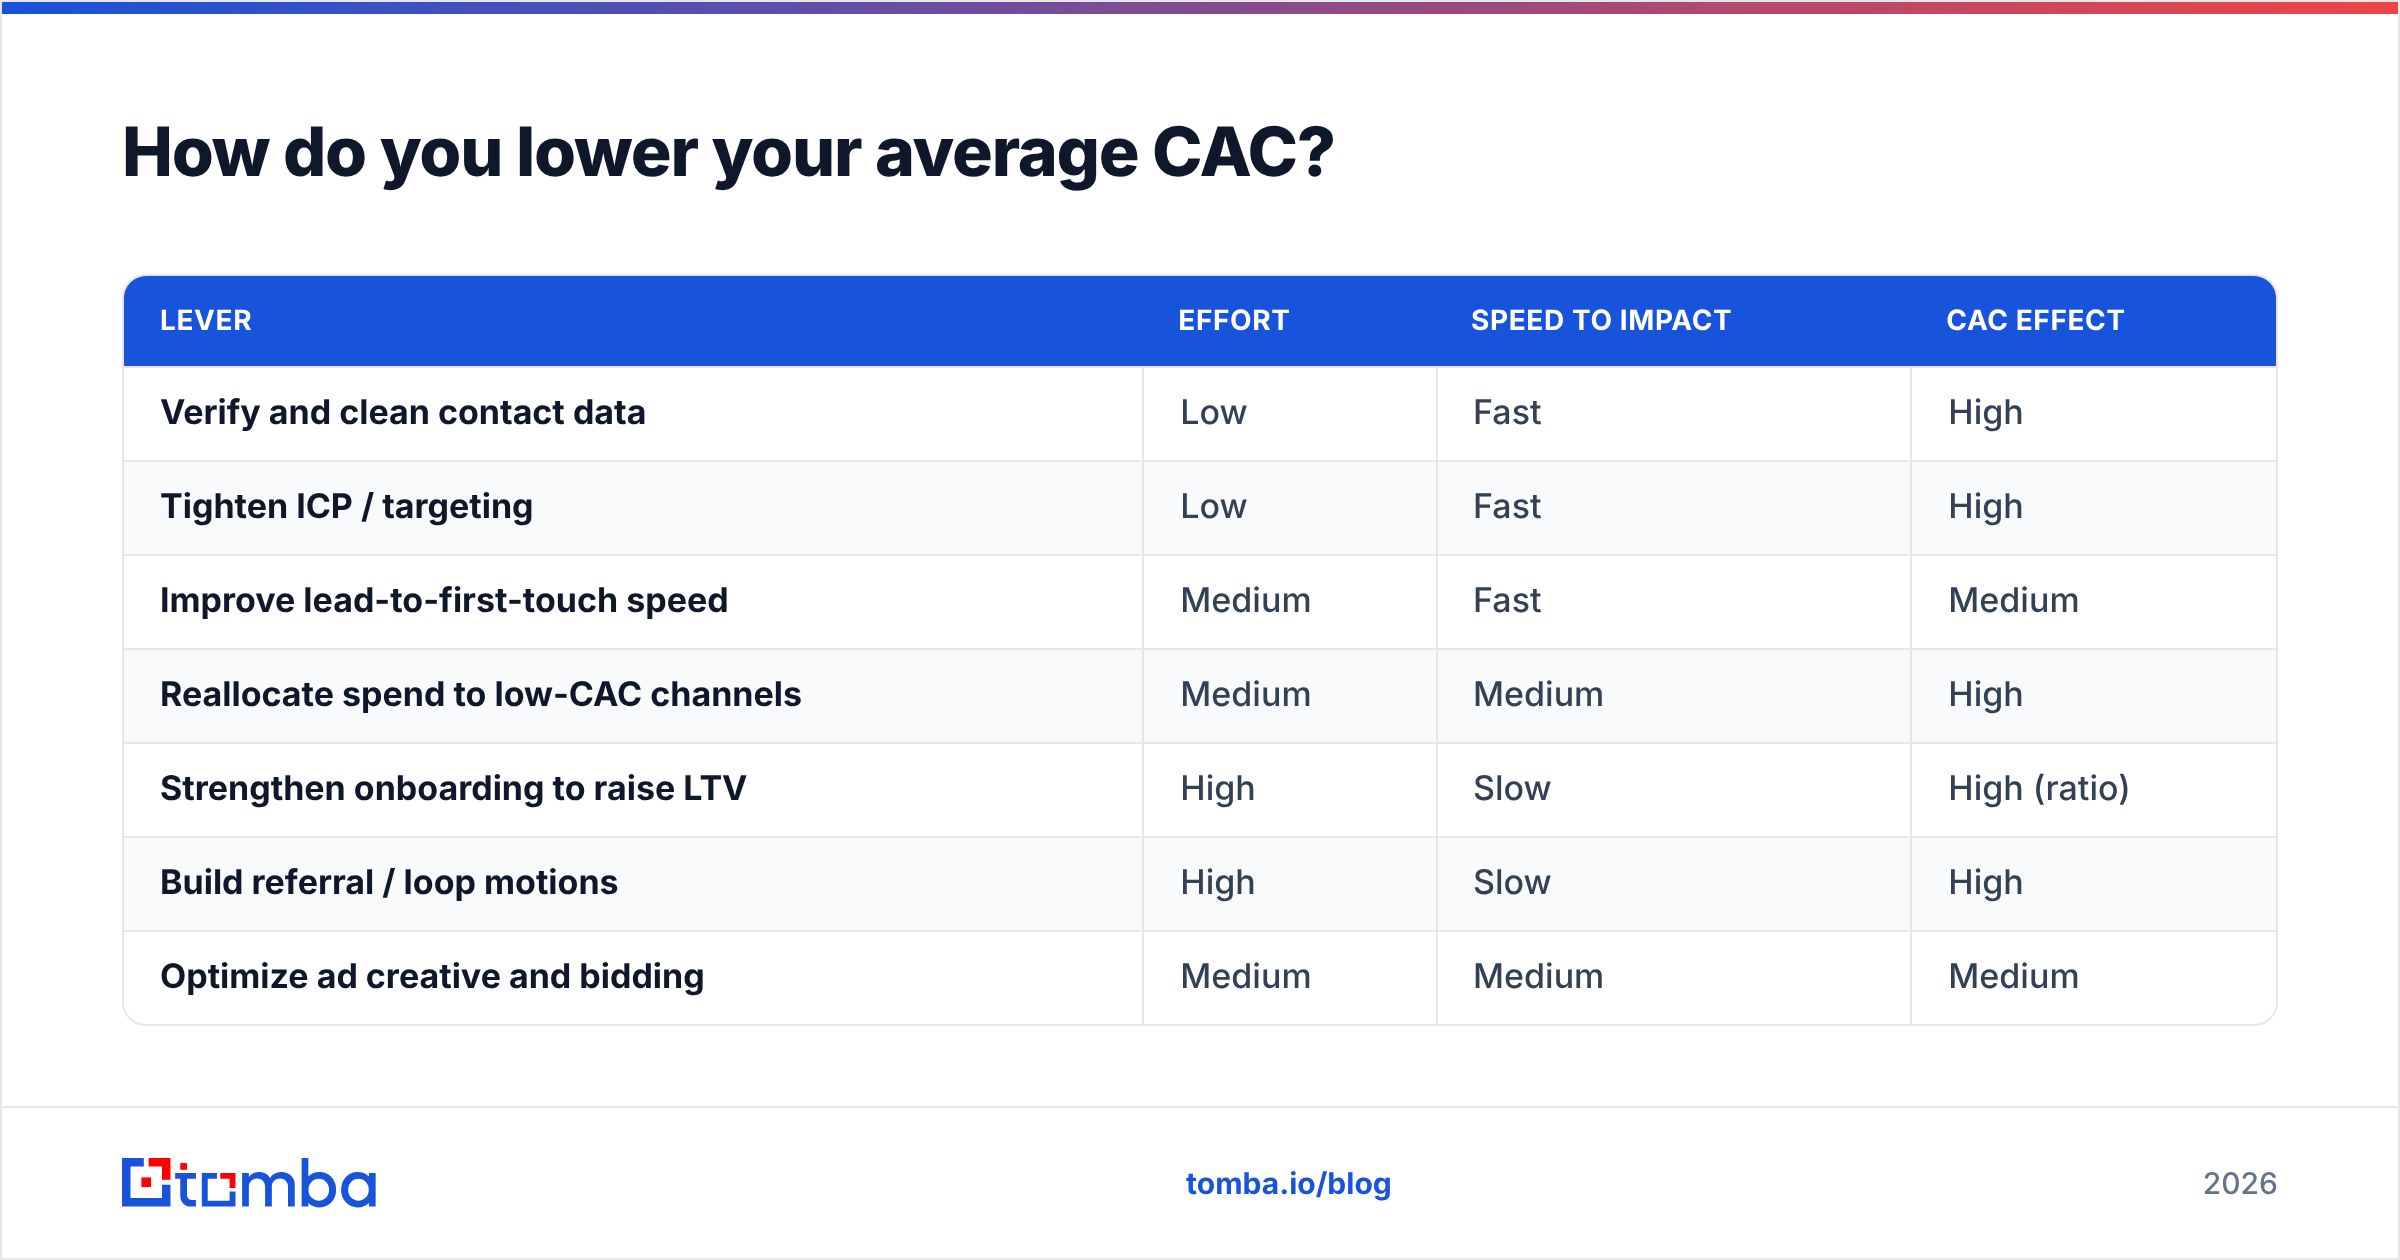
Bringing CAC down is mostly about removing waste, not spending more. The seven levers below are ordered by typical speed-to-impact.
| Lever | Effort | Speed to impact | CAC effect |
|---|---|---|---|
| Verify and clean contact data | Low | Fast | High |
| Tighten ICP / targeting | Low | Fast | High |
| Improve lead-to-first-touch speed | Medium | Fast | Medium |
| Reallocate spend to low-CAC channels | Medium | Medium | High |
| Strengthen onboarding to raise LTV | High | Slow | High (ratio) |
| Build referral / loop motions | High | Slow | High |
| Optimize ad creative and bidding | Medium | Medium | Medium |
A few of these deserve detail:
Fix data first. It's the cheapest, fastest win. When your reps reach the right person on the first try, cost-per-meeting drops and so does CAC. Running prospects through an email verifier before any sequence protects deliverability and stops you paying to email people who don't exist. Pairing a reliable email finder with verification means more of every dollar lands on a real, reachable buyer.
Narrow the ICP. If your average CAC is high, your targeting is probably loose. Use firmographic and data enrichment signals to score accounts before spend, then concentrate budget on the segments that actually convert.
Reallocate, don't just cut. Once you've split CAC by channel, move budget from your highest-CAC channel into your lowest-CAC channel that still has headroom. This single move often beats months of creative testing.
Raise LTV in parallel. Lowering CAC and raising LTV both improve the ratio. Better onboarding, expansion revenue, and retention widen the gap between what a customer costs and what they're worth — which is the whole game.
How does better prospecting data reduce CAC in practice?#
Here's the mechanics, made concrete. Imagine an outbound team sending 5,000 emails a month with a list that's 70% accurate. Roughly 1,500 messages hit dead addresses. Those bounces drag your domain reputation down, which lowers inbox placement for the good 3,500 — so your reply rate, meeting rate, and ultimately your customer count all shrink. Same spend, fewer customers, higher CAC.
Now flip it. Run the same list through verification, replace dead contacts with found-and-verified ones, and you mail 5,000 valid prospects. Deliverability climbs, replies rise, and the cost to book each meeting falls. You didn't increase budget — you removed the waste that was inflating CAC.
That's why data quality is the highest-leverage CAC input for outbound-led teams. It's also why blended CAC improvements often start in the data layer, not the ad account. If you want to model this for your own funnel, compare your Tomba pricing tier against the spend you currently lose to bounces and re-work — the math usually favors cleaner data quickly.
How often should you measure average CAC?#
Measure blended CAC monthly for trend-watching and quarterly for decisions, because monthly numbers are noisy in long sales cycles. Break it down by:
- Channel — to find and fix the expensive ones.
- Segment / ICP tier — to confirm your best-fit customers are also your cheapest to acquire.
- Cohort — to align spend with the customers it actually produced.
Set an alert if CAC rises two periods in a row while conversion holds flat — that's usually a data-quality or channel-saturation problem creeping in. Pair every CAC review with its LTV:CAC ratio and payback period so you never optimize one number at the expense of the business.
The bottom line#
Average CAC is a context-dependent number, not a leaderboard score. A healthy CAC is one that sits comfortably inside a 3:1-or-better LTV:CAC ratio with payback under a year — whatever the absolute figure. And the fastest, cheapest way to move it is almost always upstream: tighter targeting and cleaner contact data, not bigger ad budgets.
If your outbound CAC is bloated by bounced emails and dead-end leads, start where the leverage is highest. The Tomba Email Finder finds verified, professional email addresses by name, domain, or company — so your reps spend their hours on real buyers instead of bad rows in a spreadsheet. Lower the cost of every conversation, and your average CAC follows. Spin up the free tier (25 searches a month), then scale on the Starter plan at $49/mo when the math proves itself.
Ready to find emails that actually work?
Join 150,000+ professionals who stopped guessing and started sending. Free credits on signup — no credit card required.
Get the Tomba newsletter
Practical outbound tactics and product updates — once every two weeks.
About the author