Average Close Rate for Sales in 2026: Benchmarks & Tactics
Most teams have no idea if their close rate is good or terrible. Here are real 2026 benchmarks by industry, how to calculate the number correctly, and what actually moves it.
TL;DR
- The average close rate for sales lands around 20% across industries, but "good" ranges from ~15% in crowded SaaS markets to 30%+ in high-intent inbound and financial services.
- Close rate is deals won ÷ qualified opportunities — not deals won ÷ every contact you ever emailed. Picking the wrong denominator is the #1 reason teams misread their numbers.
- Your close rate is mostly decided before the demo: lead quality, fit, and data accuracy explain more variance than your closing "technique."
- A realistic improvement target is +3 to +7 percentage points per quarter through better qualification, faster follow-up, and clean contact data.
- Benchmarks are a compass, not a verdict. Track your own trend line month over month and compare against your own past, not a blog average.
What is the average close rate for sales?#
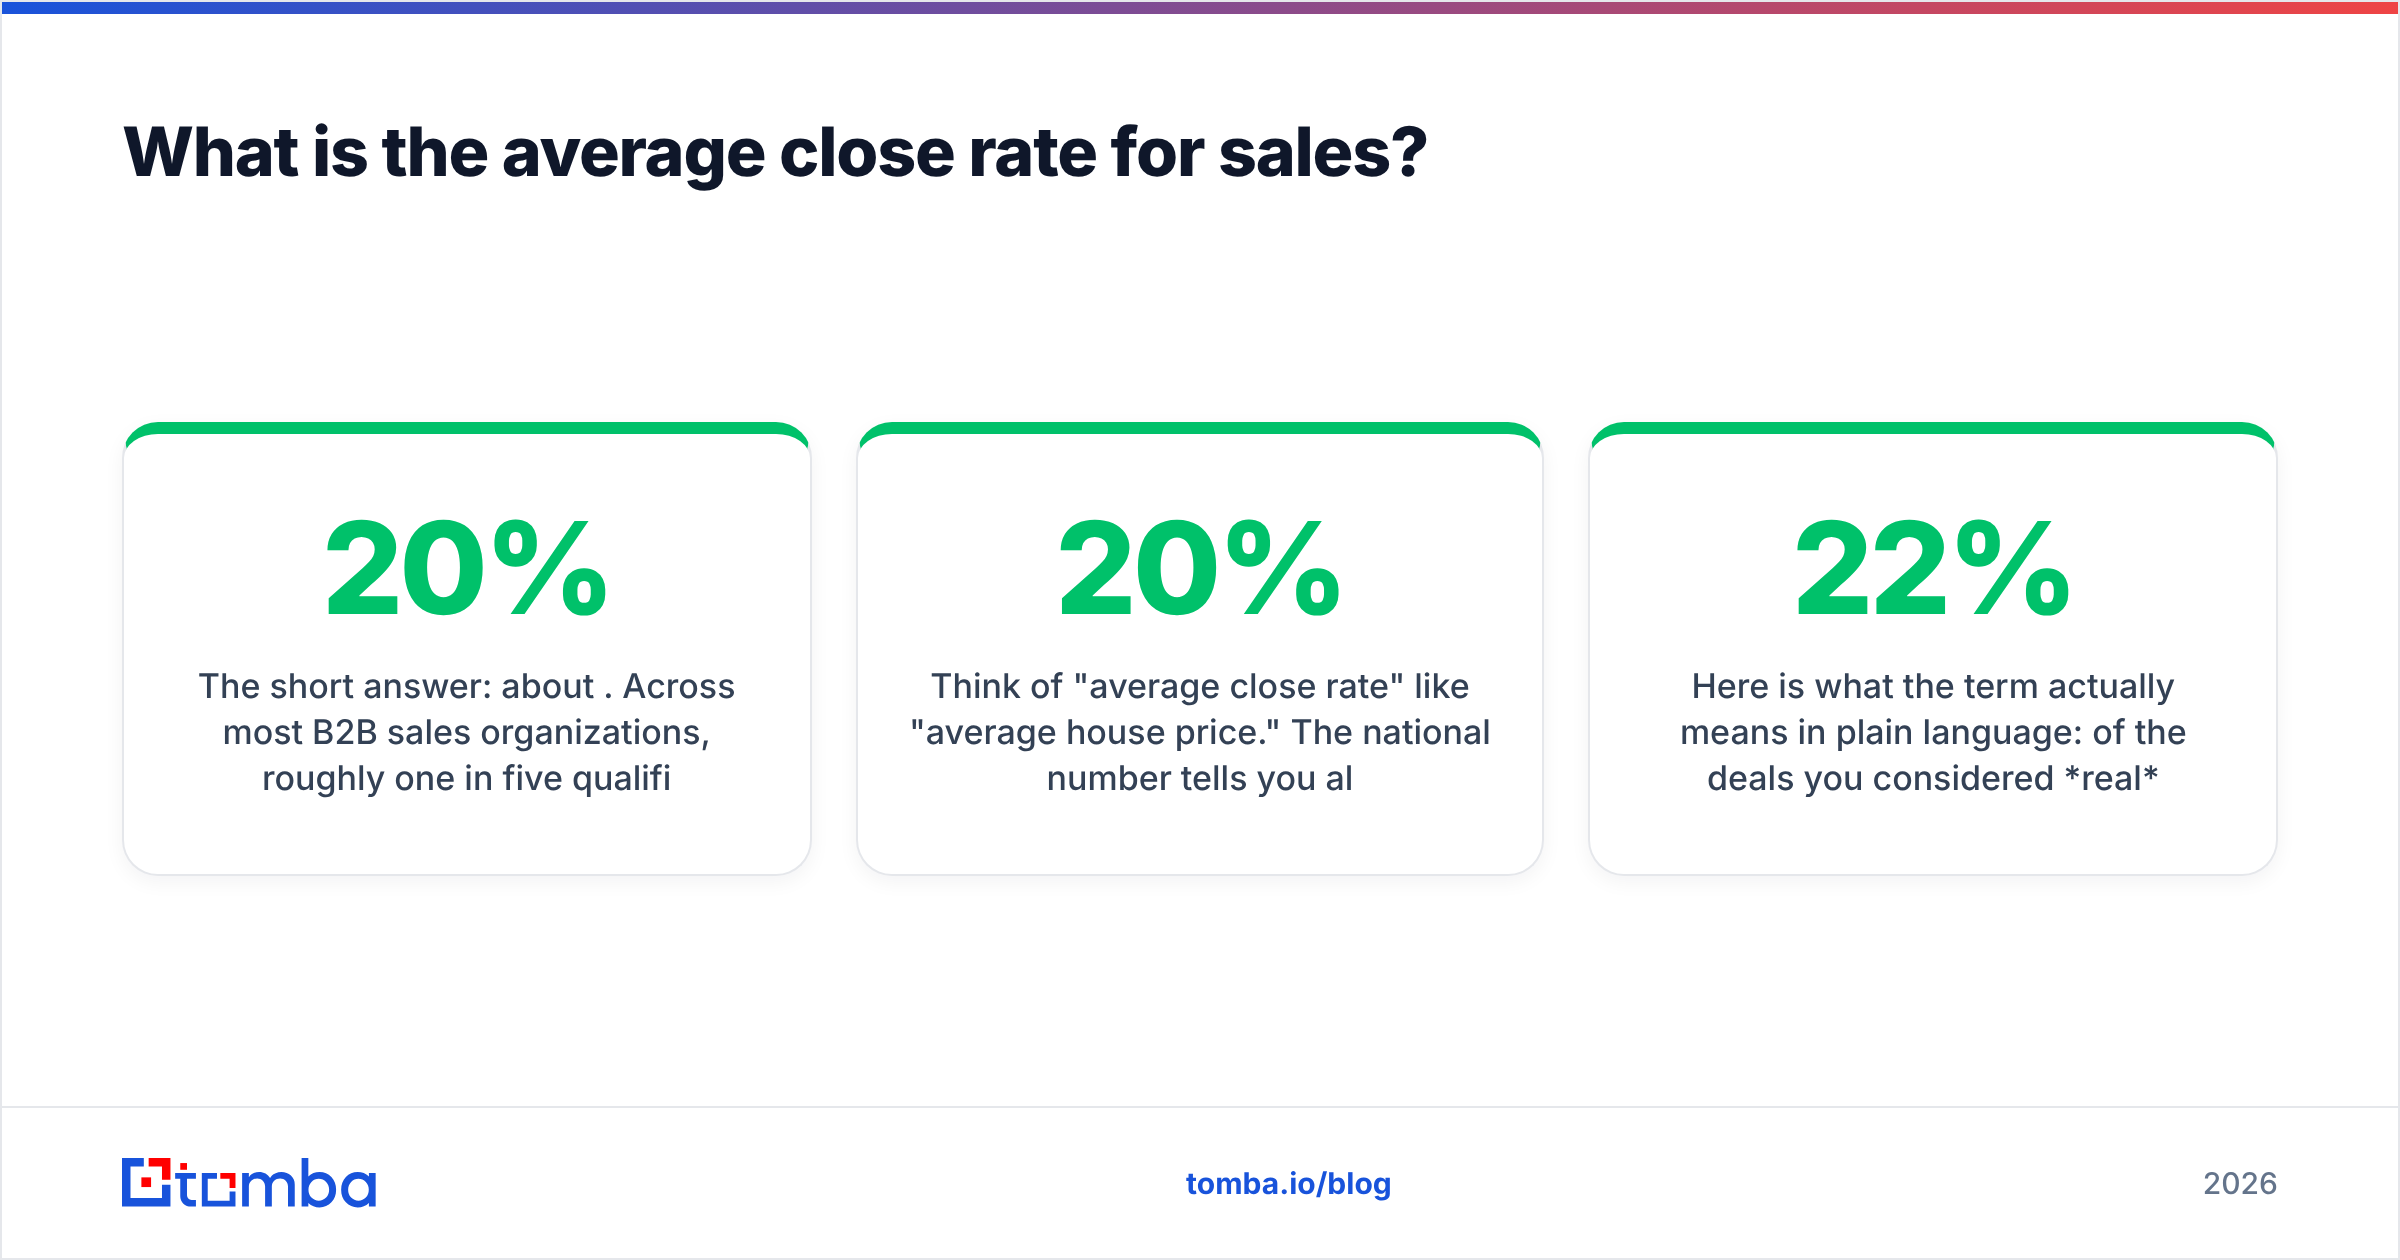
The short answer: about 20%. Across most B2B sales organizations, roughly one in five qualified opportunities turns into a closed-won deal. That figure is the rough center of gravity in widely cited industry data, but it hides enormous spread.
Think of "average close rate" like "average house price." The national number tells you almost nothing about the house you're trying to buy. A 20% average blends inbound demo requests that close at 35% with cold outbound sequences that close at 3%, enterprise cycles that take nine months with transactional deals that close on the first call. The headline number is a starting point, not a scorecard.
Here is what the term actually means in plain language: of the deals you considered real — qualified, scoped, worth your reps' time — what share did you win? If you worked 100 qualified opportunities last quarter and closed 22, your close rate is 22%. Simple math, but the inputs are where teams go wrong.
How do you calculate close rate correctly?#
Close rate = (Deals won ÷ Qualified opportunities) × 100.
The mistake almost everyone makes is using the wrong denominator. There are three common versions of "close rate," and they produce wildly different numbers:
- Lead-to-close rate — deals won ÷ all leads (including raw, unqualified ones). This is usually low single digits and is really a measure of your whole funnel, not your closers.
- Opportunity close rate — deals won ÷ qualified opportunities. This is the number most people mean when they say "close rate," and the one you should benchmark.
- Win rate — deals won ÷ (deals won + deals lost), excluding deals still open. Closely related but it ignores stalled/no-decision deals. See the difference between win rate and close rate before you report either to leadership.
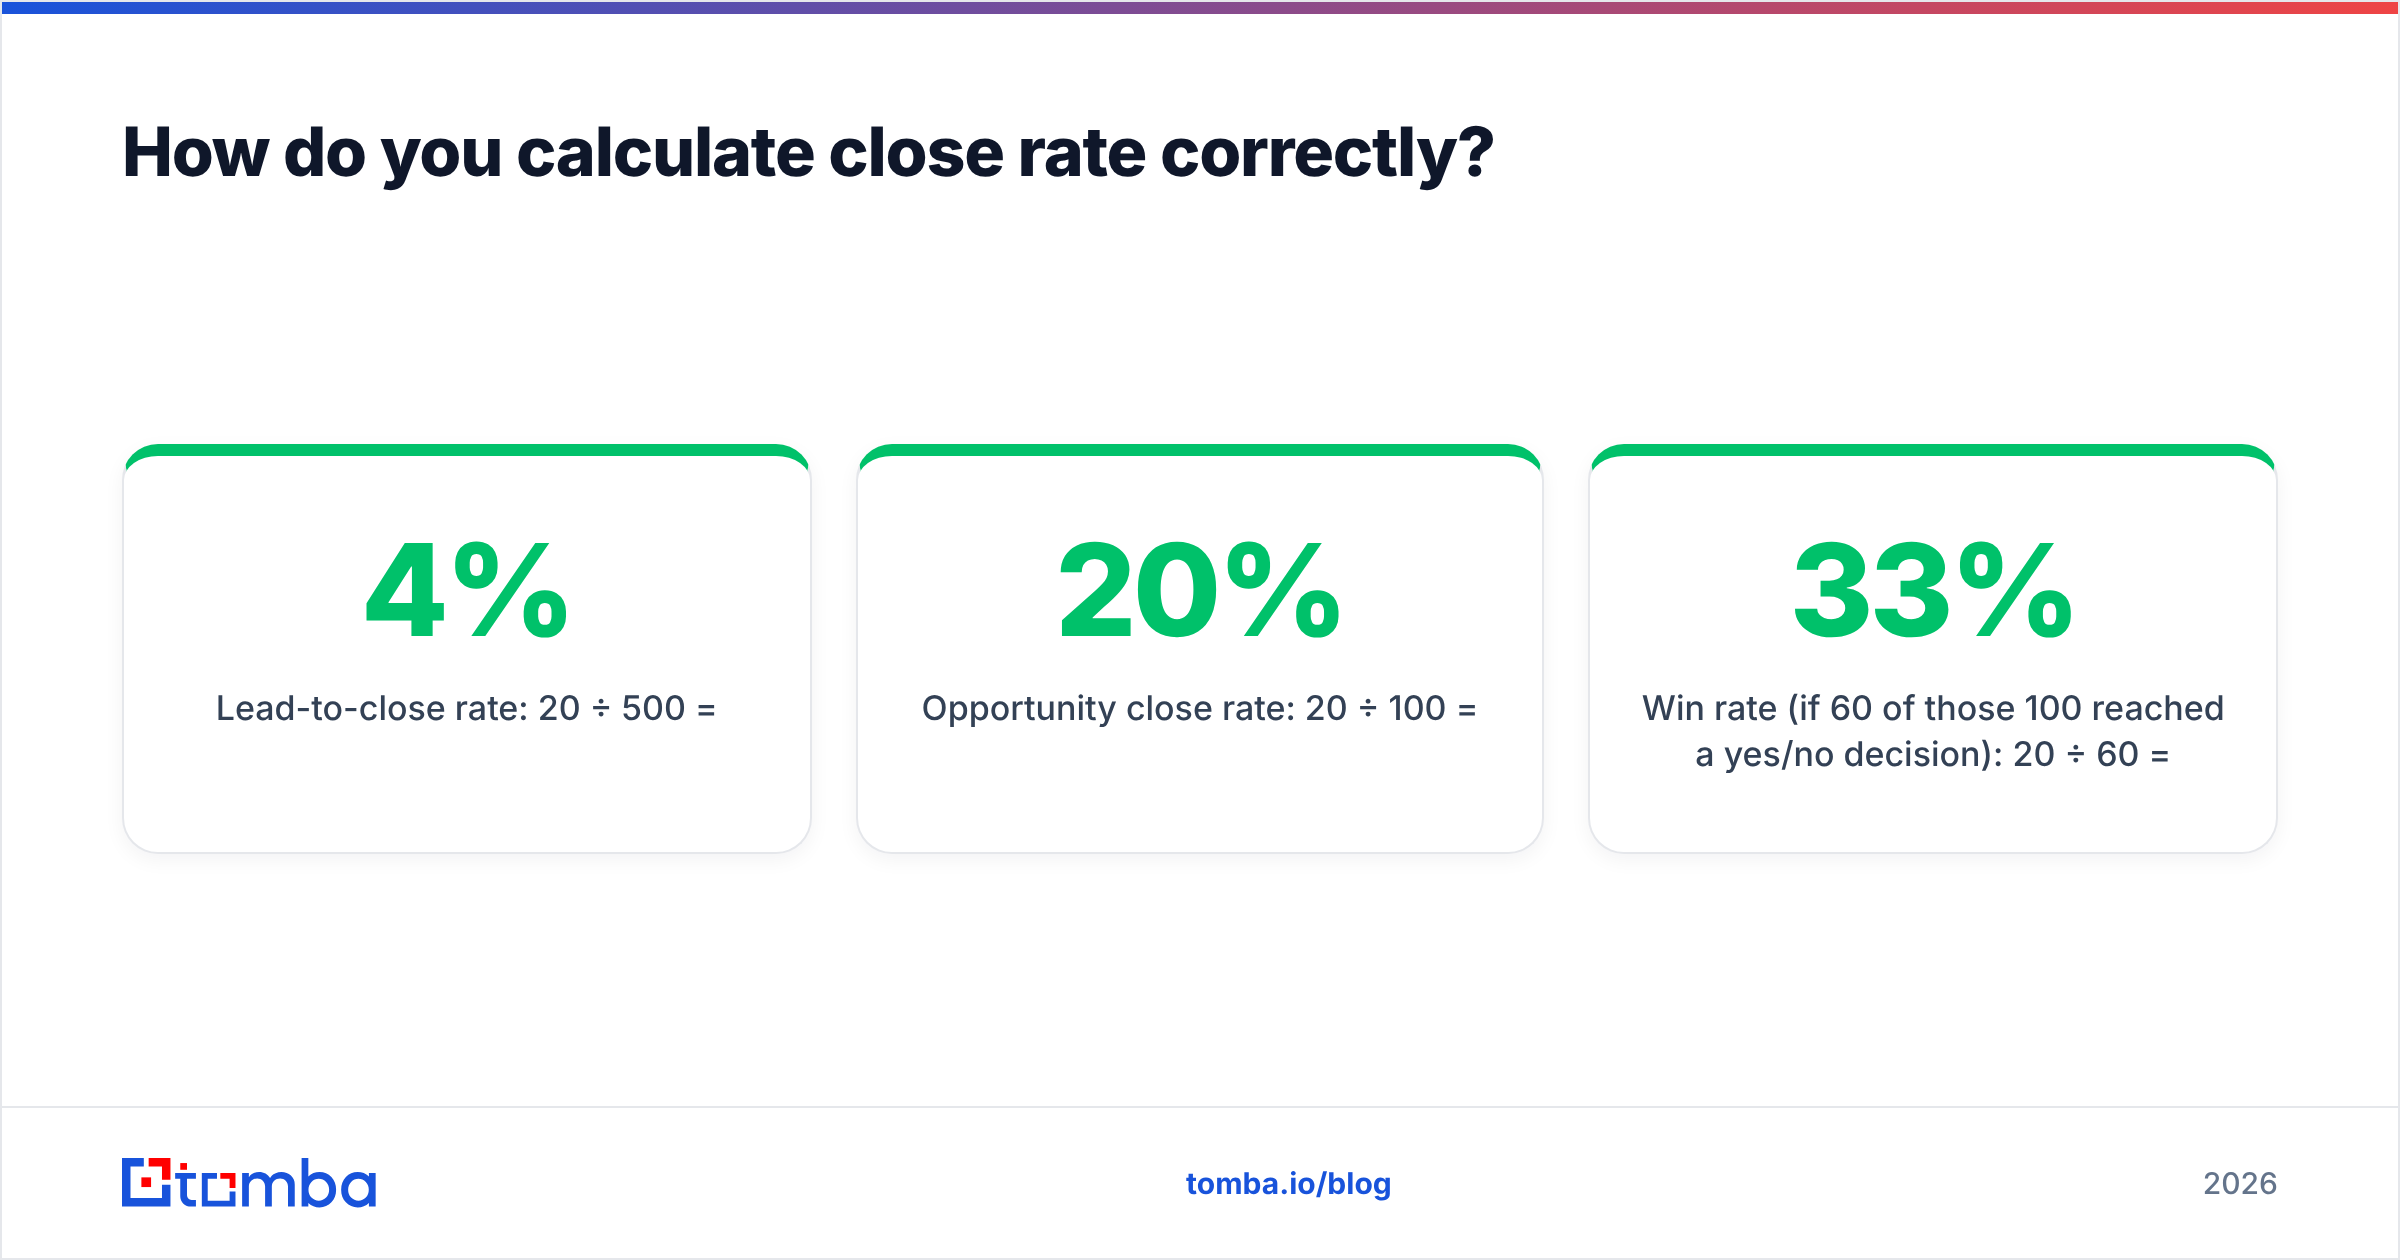
A quick example to make the gap obvious. Say you generated 500 leads, qualified 100 of them into opportunities, and closed 20:
- Lead-to-close rate: 20 ÷ 500 = 4%
- Opportunity close rate: 20 ÷ 100 = 20%
- Win rate (if 60 of those 100 reached a yes/no decision): 20 ÷ 60 = 33%
Same business, same quarter, three numbers that look like three different companies. Decide which one you're tracking, write the definition down, and never silently switch denominators between quarterly reviews. Most CRMs let you pin this; if yours doesn't make qualification stages explicit, fix that in your CRM before you trust any close-rate report.
What is a good close rate by industry in 2026?#
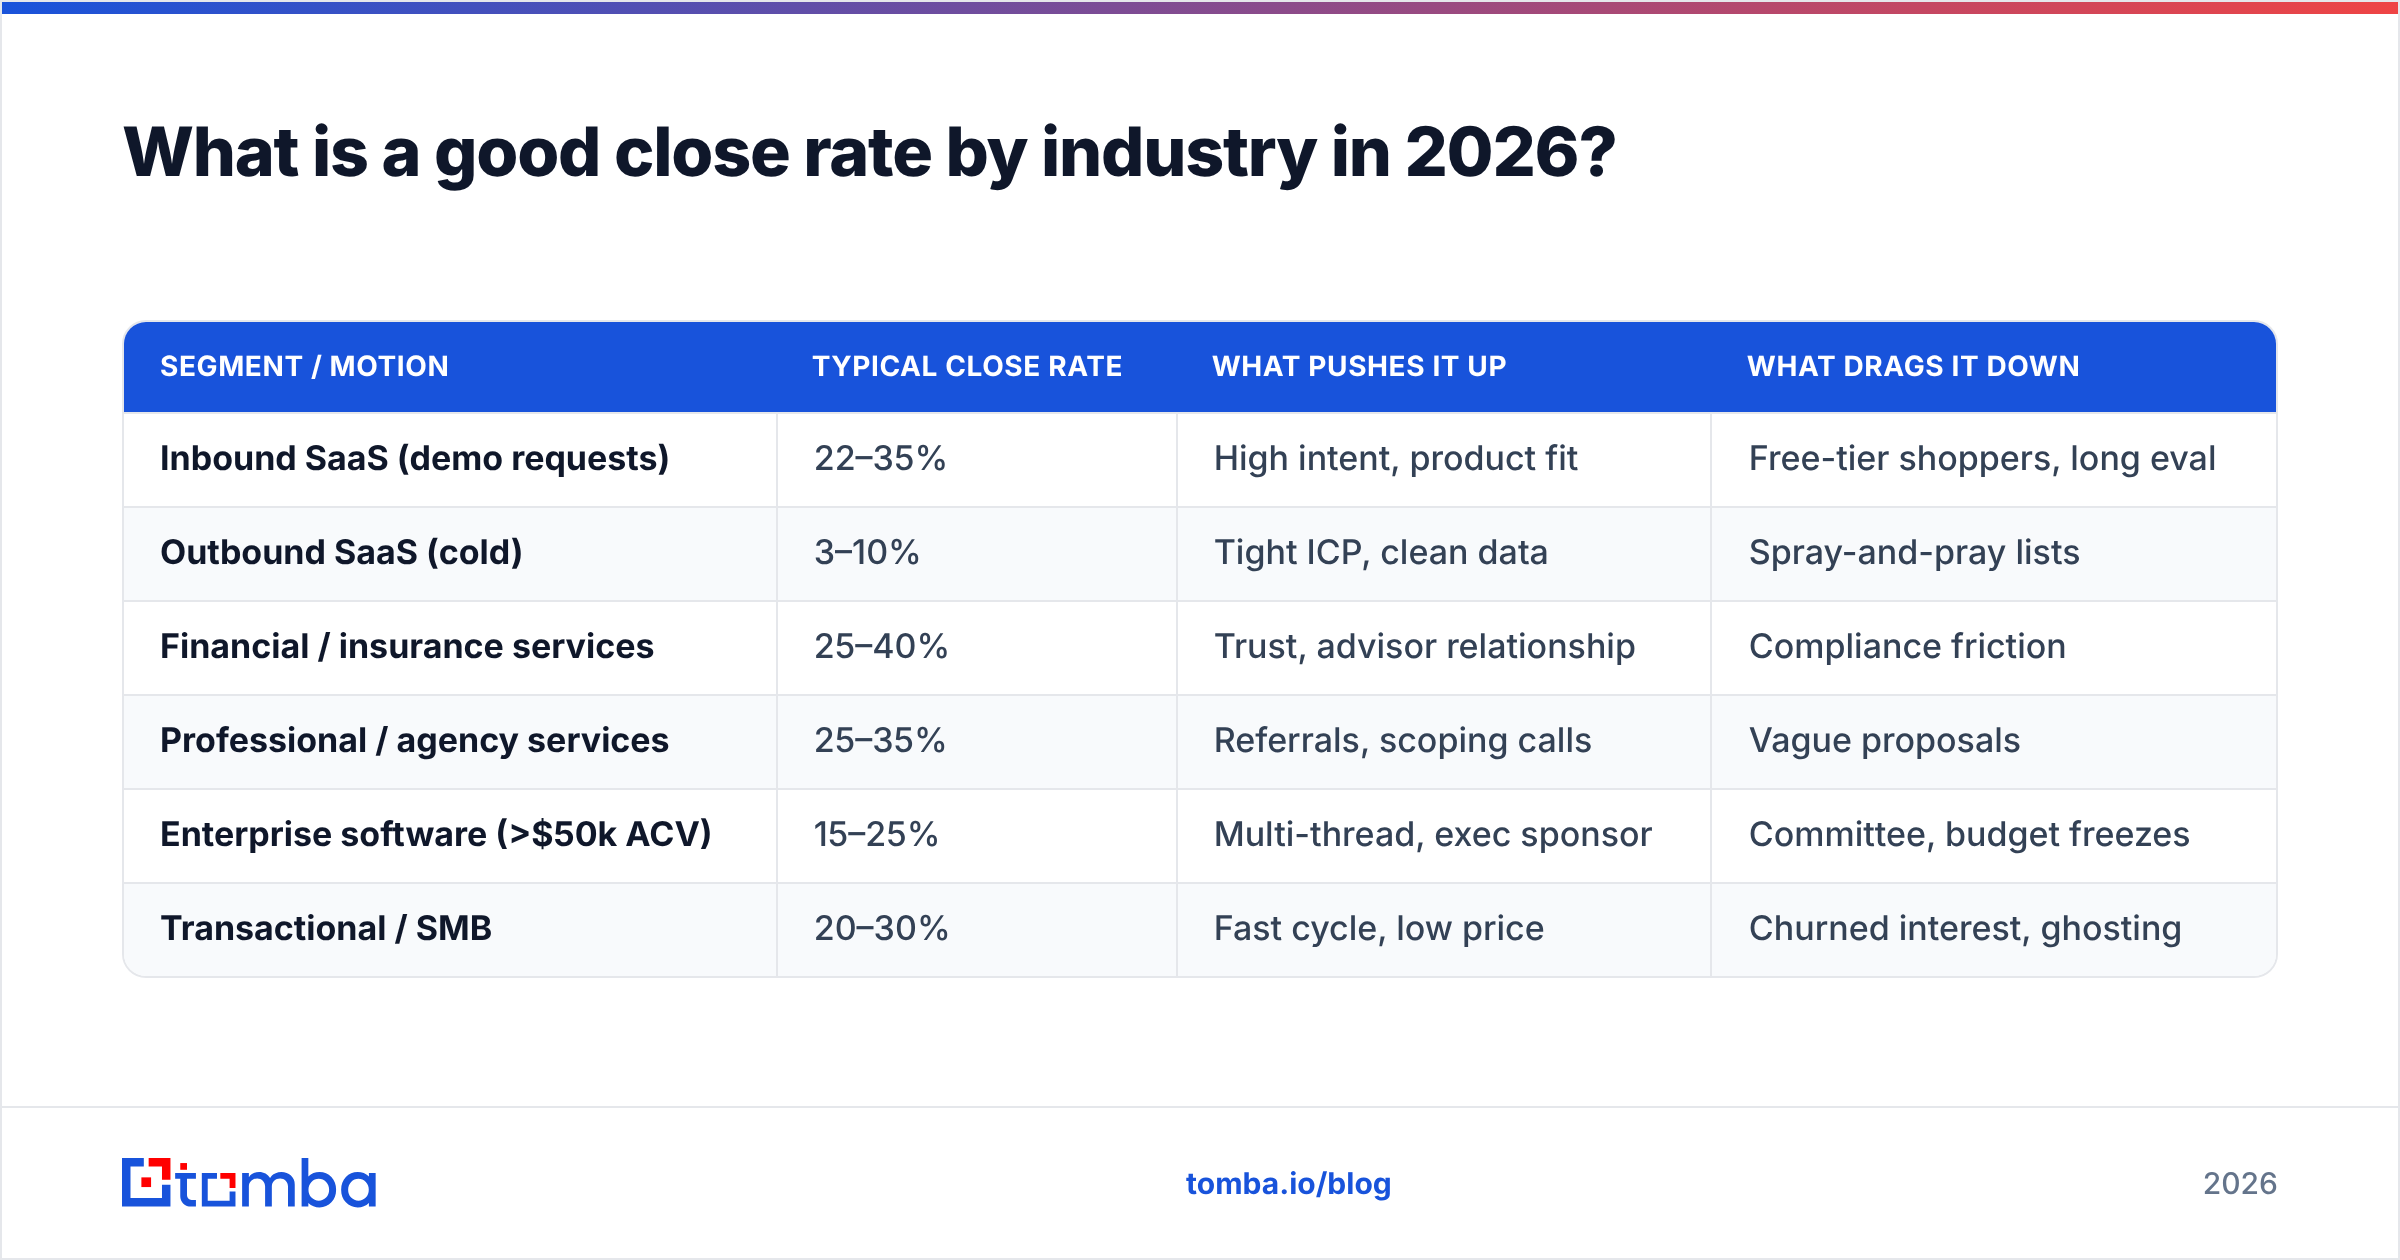
There is no single "good" number, but the table below gives realistic 2026 ranges for opportunity close rate by segment. Treat the midpoint as par for that course.
| Segment / motion | Typical close rate | What pushes it up | What drags it down |
|---|---|---|---|
| Inbound SaaS (demo requests) | 22–35% | High intent, product fit | Free-tier shoppers, long eval |
| Outbound SaaS (cold) | 3–10% | Tight ICP, clean data | Spray-and-pray lists |
| Financial / insurance services | 25–40% | Trust, advisor relationship | Compliance friction |
| Professional / agency services | 25–35% | Referrals, scoping calls | Vague proposals |
| Enterprise software (>$50k ACV) | 15–25% | Multi-thread, exec sponsor | Committee, budget freezes |
| Transactional / SMB | 20–30% | Fast cycle, low price | Churned interest, ghosting |
Two honest caveats. First, these are opportunity close rates — if you're measuring lead-to-close, divide expectations by three or four. Second, your motion matters more than your vertical. A disciplined outbound team in SaaS can beat a sloppy inbound team in financial services. Use the row that matches how you sell, not just what you sell.
For broader context on how these benchmarks are assembled, HubSpot's sales statistics and Salesforce's State of Sales reports are two of the most-cited public sources, and Gartner's sales research covers enterprise buying-committee dynamics in depth.
Why is your close rate lower than the benchmark?#
Because the deal was usually won or lost before the demo. The uncomfortable truth is that closing technique is the smallest lever. The biggest factors are upstream:
- Lead quality and fit. If half your "opportunities" were never going to buy, your close rate is mathematically capped no matter how good your reps are. Garbage in, garbage out.
- Bad contact data. Reps burn hours chasing wrong people, dead inboxes, and bounced emails. Time spent on bad data is time not spent closing real deals. This is where a data enrichment step before the deal enters the pipeline pays for itself.
- Slow follow-up. Response time decays response rate fast. A lead contacted in five minutes converts dramatically better than one contacted the next day.
- Single-threading. In deals with a buying committee, talking to one champion and no one else is how "we're excited!" becomes "we went another direction."
- No qualification discipline. Teams that mark everything an "opportunity" inflate their denominator and crush their close rate on paper.

Notice that four of those five are fixable with process and data, not charisma. That's good news — process is repeatable, charisma isn't.
How do you improve your average close rate for sales?#
Conclusion first: fix the inputs, then the conversation. Here's the order that actually moves the number.
1. Tighten qualification before counting an opportunity#
Define what "qualified" means in writing — budget, authority, need, timing, or whatever framework fits your motion — and enforce it. Counterintuitively, raising the bar usually raises your close rate, because you stop diluting the denominator with deals that were never real. Fewer, better opportunities beat a bloated pipeline every time.
2. Start with accurate, verified contact data#
You cannot close a buyer you can't reach. Before a deal enters the pipeline, make sure the contact details are real. Use an email finder to get the right professional address, then run it through an email verifier so your first touch doesn't bounce. A bounced opener doesn't just cost one email — it dents your sender reputation and the next ten land in spam.
3. Cut your speed-to-lead#
Build an alert so reps reach new qualified leads in minutes, not hours. The first vendor to a useful conversation wins a disproportionate share of deals. This is almost free to implement and one of the highest-ROI changes available.
4. Multi-thread every meaningful deal#
For anything with a committee, map the buying group and build relationships with at least two or three stakeholders. Single-threaded deals die when your one champion goes quiet, changes jobs, or gets overruled.
5. Run loss reviews, not just win celebrations#
Every quarter, read your closed-lost reasons. Patterns emerge fast: priced wrong, wrong persona, lost to a specific competitor, stalled at procurement. You'll learn more from ten honest loss reviews than from any generic "closing tips" article.
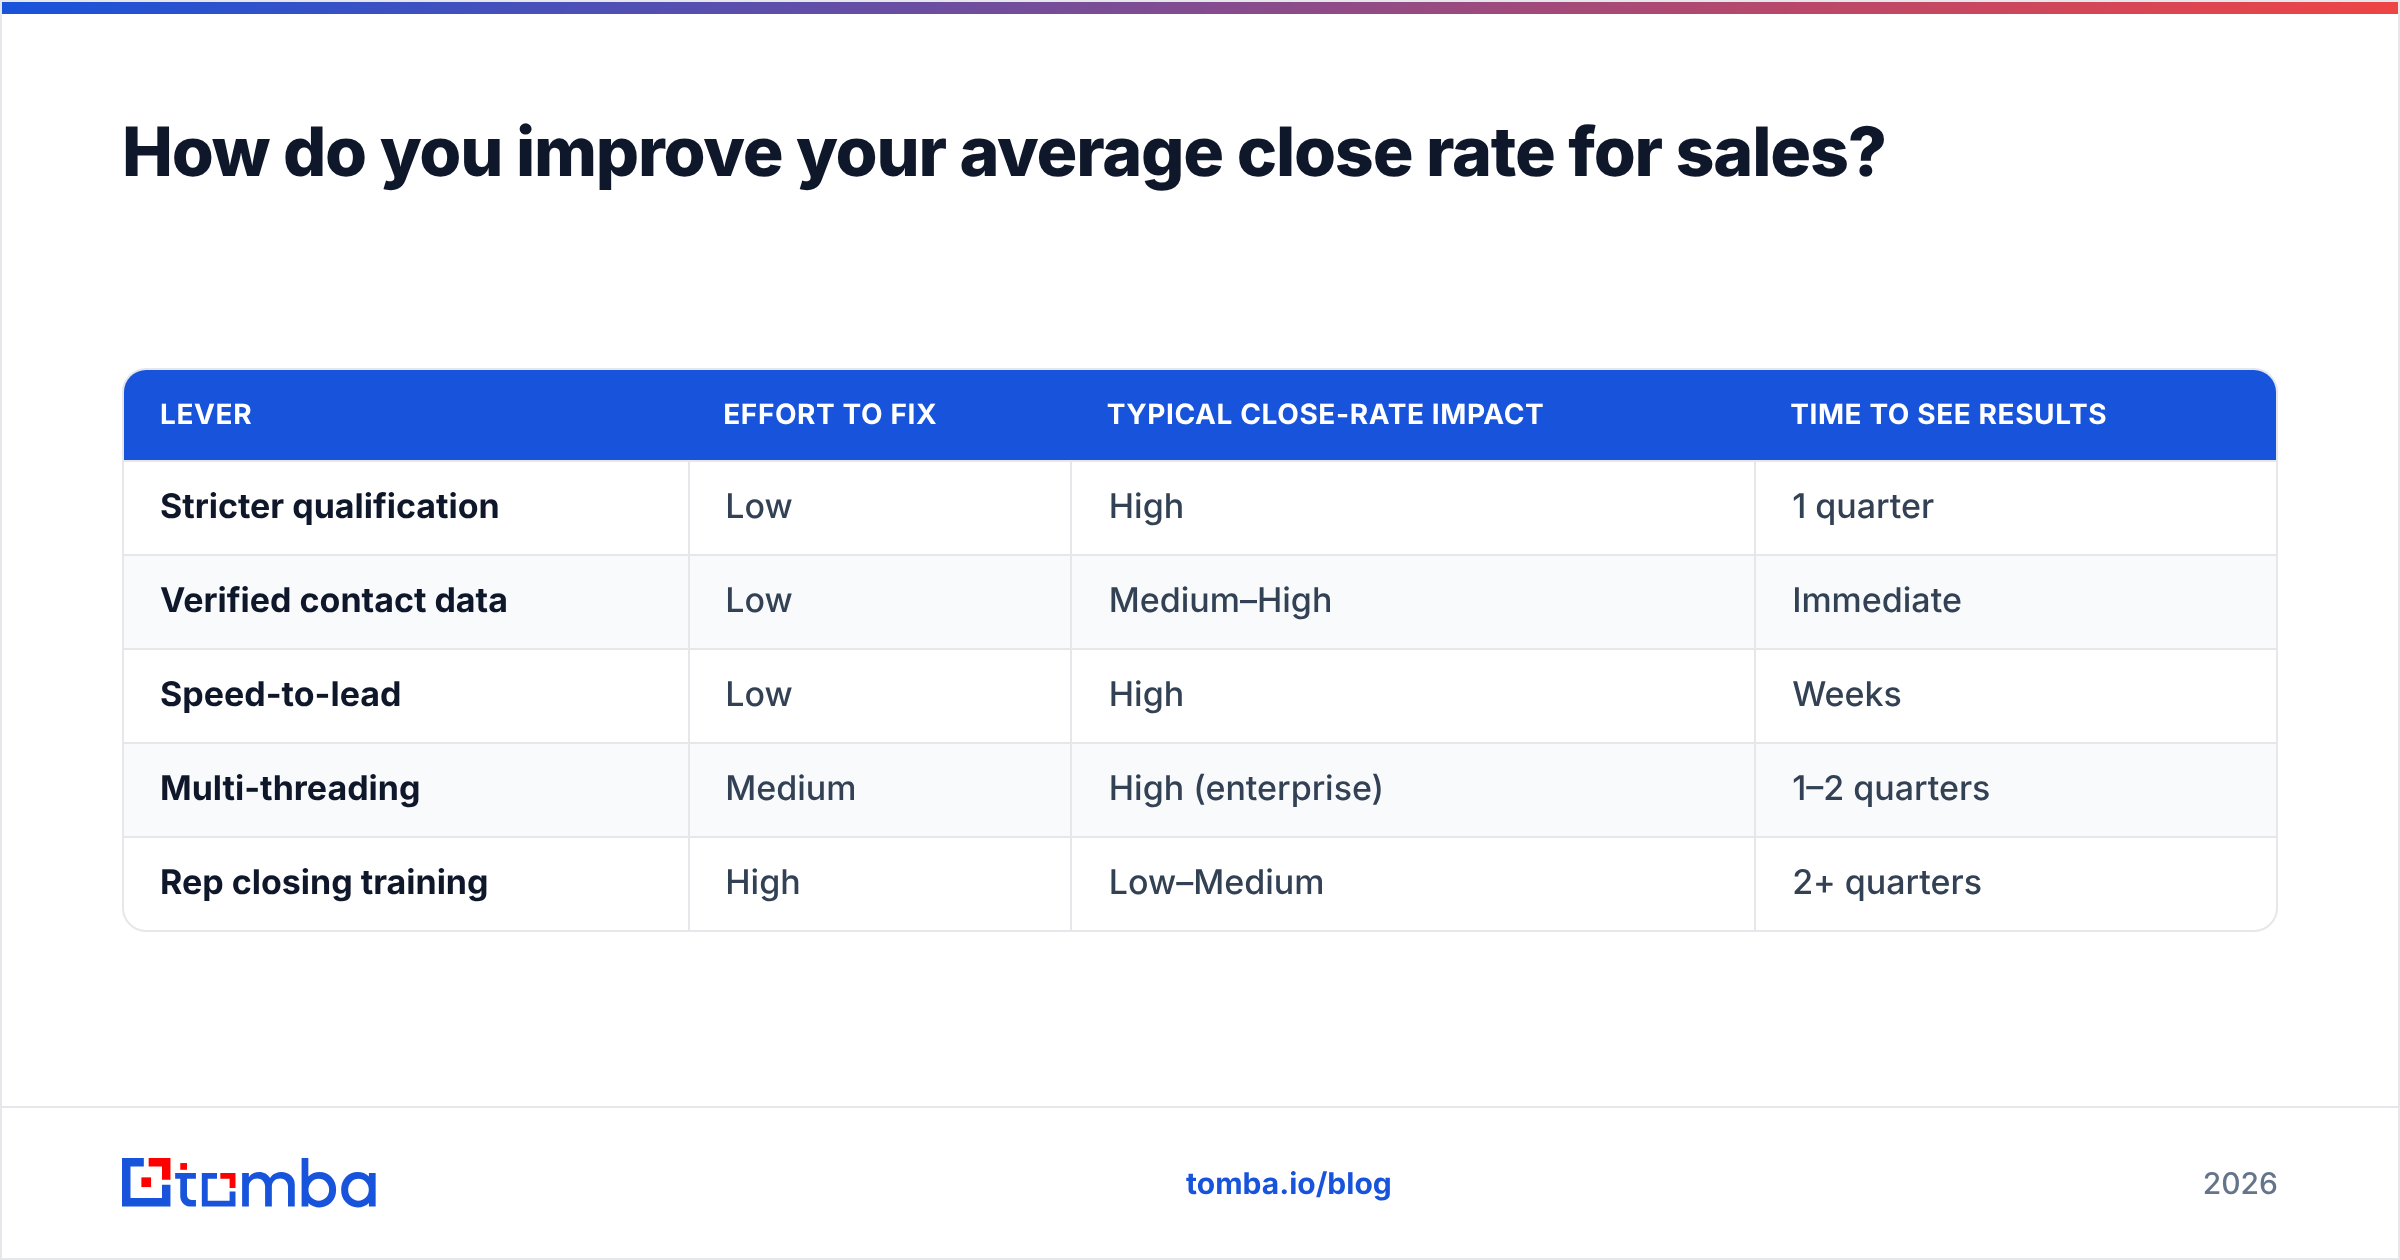
Quick comparison: where to spend your effort#
| Lever | Effort to fix | Typical close-rate impact | Time to see results |
|---|---|---|---|
| Stricter qualification | Low | High | 1 quarter |
| Verified contact data | Low | Medium–High | Immediate |
| Speed-to-lead | Low | High | Weeks |
| Multi-threading | Medium | High (enterprise) | 1–2 quarters |
| Rep closing training | High | Low–Medium | 2+ quarters |
The pattern is clear: the cheapest, fastest wins are upstream. Most teams do the opposite — they pour budget into closing coaching while feeding reps unqualified leads and stale data.
How often should you measure close rate?#
Monthly for the trend, quarterly for decisions. A single month is noisy — one big enterprise deal slipping into next quarter can swing a small team's number by ten points. What matters is the direction over time, segmented by lead source and rep.
Segment your close rate by source especially. If inbound closes at 30% and outbound at 5%, a blended "17%" tells you nothing actionable. Break it apart and you'll instantly see where to invest and where to cut. The same logic applies to response rate on your outreach — a low close rate often traces straight back to a low reply rate caused by bad data or weak targeting, not a weak pitch.
Set a realistic improvement goal. Adding 3 to 7 percentage points per quarter through qualification, speed, and data hygiene is achievable for most teams. Promising to "double our close rate next month" is how you set reps up to game the qualification stage instead of actually winning more deals.
Frequently asked questions#
What is the average close rate for sales? Around 20% of qualified opportunities across B2B, with a realistic range of roughly 15% to 30%+ depending on industry, deal size, and whether the lead came inbound or outbound.
Is a 30% close rate good? For most B2B teams, yes — 30% is above average and typically reflects strong lead qualification or high-intent inbound. For low-price transactional or inbound-heavy motions it's closer to par, so always compare against your own segment.
Why is my outbound close rate so low? Outbound close rates of 3–10% are normal because you're reaching colder, lower-intent buyers. The fastest fixes are tighter targeting and verified contact data so you reach the right person on the first try.
Close rate vs win rate — what's the difference? Close rate divides wins by all qualified opportunities (including stalled ones); win rate divides wins only by deals that reached a clear yes/no. Win rate is usually higher because it ignores no-decision deals.
Close more of the deals you already have#
Your close rate problem is usually a data and qualification problem wearing a closing costume. Before you spend another dollar on closing coaching, make sure every opportunity in your pipeline is a real person with a real, reachable inbox. Start free with the Tomba Email Finder — find verified professional emails by name, company, or domain so your reps spend their hours on conversations that can actually close, not on chasing dead contacts. Pair it with the email verifier to keep your deliverability and your numbers clean. Check the Tomba pricing — there's a free tier with 25 searches a month to test it on your own pipeline before you commit.
Ready to find emails that actually work?
Join 150,000+ professionals who stopped guessing and started sending. Free credits on signup — no credit card required.
Get the Tomba newsletter
Practical outbound tactics and product updates — once every two weeks.
About the author