Average Cost Per Acquisition: 2026 Benchmarks & Fixes
What counts as a healthy average cost per acquisition in 2026? Real benchmarks by channel and industry, the formula, and the levers that cut CPA without killing volume.
TL;DR
- Average cost per acquisition (CPA) is total acquisition spend divided by the number of customers (or conversions) you won — the single clearest read on whether growth is profitable.
- There is no universal "good" CPA. A healthy number depends on your average order value, gross margin, and LTV — a $400 CPA is great for enterprise SaaS and fatal for a $30 e-commerce order.
- 2026 benchmarks land roughly between $30 and $60 for paid social, $45 and $120 for paid search, and $150–$700+ for B2B SaaS, depending on industry and deal size.
- The fastest way to cut CPA is rarely "spend less on ads" — it's tighter targeting, better data, and higher conversion rates across the funnel.
- Outbound built on accurate contact data routinely beats paid channels on CPA because you skip the auction entirely.
If you only track one efficiency metric, average cost per acquisition is the one that tells you whether your growth engine makes money or just burns it. This guide breaks down the formula, what "average" actually looks like across channels and industries in 2026, and the specific levers that move the number — including the data-quality lever most teams ignore.
What is average cost per acquisition?#
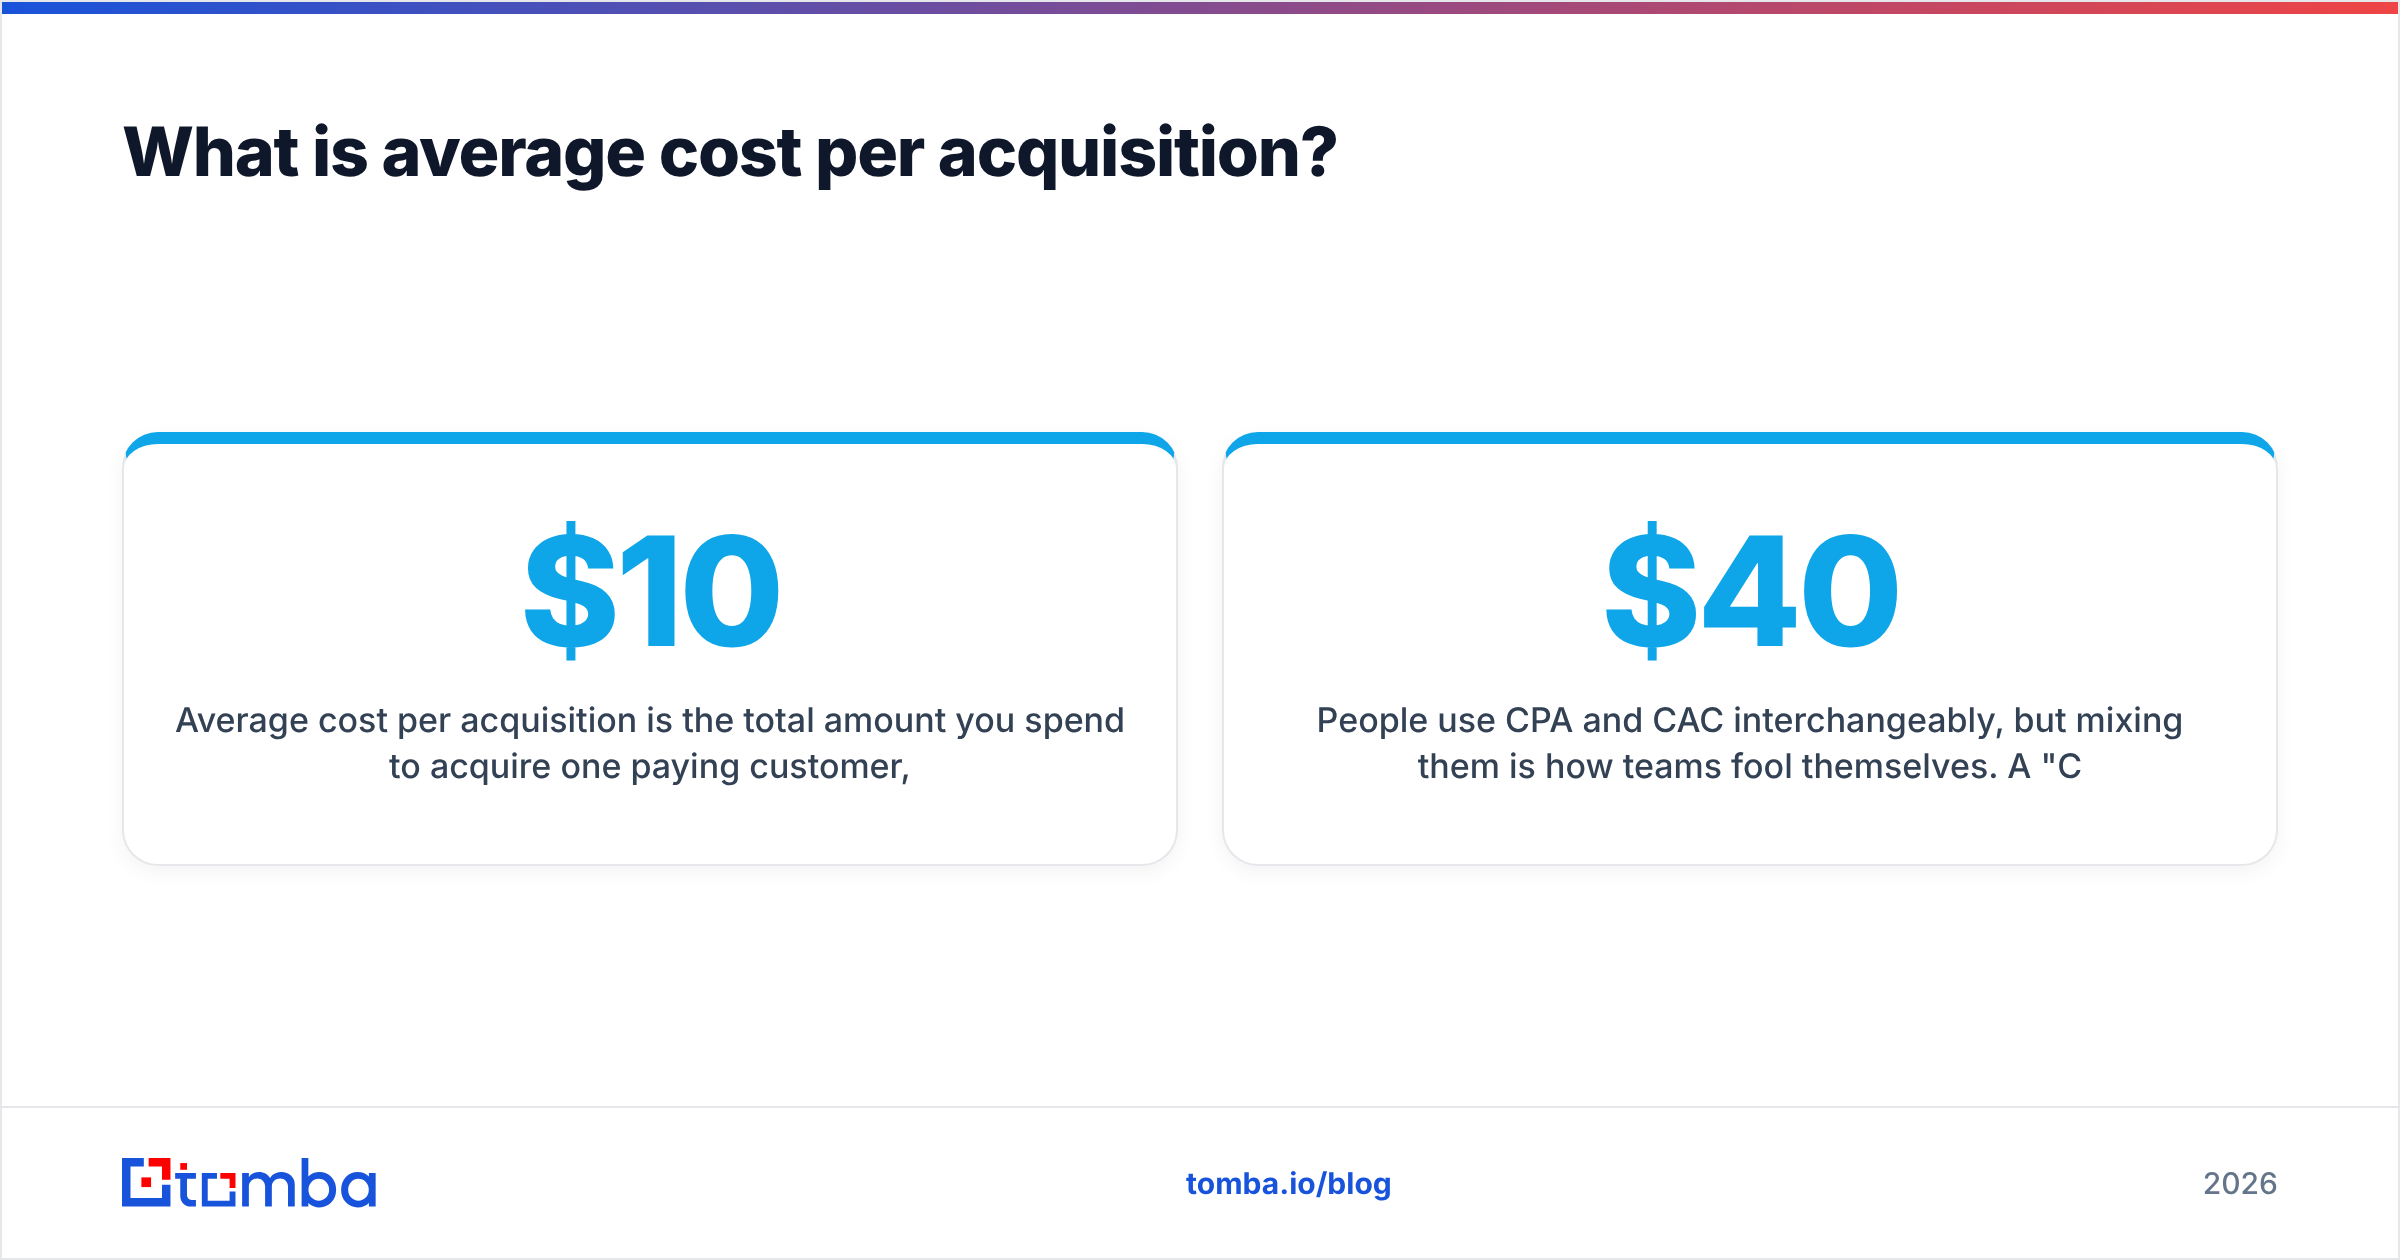
Average cost per acquisition is the total amount you spend to acquire one paying customer, averaged across all the customers you won in a period. Think of it like the price tag on a customer. If you spent $10,000 on marketing and sales last month and closed 100 customers, your average CPA is $100. Simple division, enormous consequences.
The metric goes by a few names, and the distinction matters:
- CPA (cost per acquisition) — usually the cost per conversion, where "conversion" might be a sale, a signup, or a qualified lead. Define the conversion before you quote the number.
- CAC (customer acquisition cost) — specifically the cost to win a paying customer, and almost always includes sales salaries, tooling, and overhead, not just ad spend.
- CPL (cost per lead) — the cost of a raw lead, several steps upstream of revenue.
People use CPA and CAC interchangeably, but mixing them is how teams fool themselves. A $40 "CPA" that only counts ad spend looks healthy until you fold in the sales team and discover real CAC is $260.
)
How do you calculate average cost per acquisition?#
The core formula is deliberately blunt:
Average CPA = Total acquisition cost ÷ Number of acquisitions
The argument is always about what goes in the numerator. A defensible "total acquisition cost" for a blended CPA includes:
- Paid media spend (ads, sponsorships, affiliates)
- Salaries for marketing and sales staff tied to acquisition
- Software and tooling (CRM, outreach, data enrichment, ad platforms)
- Creative and content production costs
- Agency or contractor fees
Say a SaaS team spends $50,000 on ads, $30,000 on salaries, and $10,000 on tooling in a quarter, and closes 300 customers. Blended CPA is $90,000 ÷ 300 = $300 per customer. Whether that's good depends entirely on what each customer is worth — which is why CPA is meaningless without two companions: LTV (lifetime value) and payback period.
The widely cited benchmark from sources like HubSpot and B2B finance playbooks is an LTV:CAC ratio of 3:1 — every dollar spent acquiring a customer should return roughly three over their lifetime. Below 3:1 and you're underpriced or overspending; far above it and you're probably under-investing in growth.
What is a good average cost per acquisition in 2026?#
Short answer: a good CPA is any CPA that keeps your LTV:CAC at or above 3:1 with a payback period under 12 months. The dollar figure is downstream of your economics, not a number you can copy from a competitor.
That said, benchmarks help you sanity-check. Here is a realistic 2026 picture of average cost per acquisition by channel for typical B2B and DTC programs:
| Channel | Typical 2026 CPA range | Best fit | Speed to results |
|---|---|---|---|
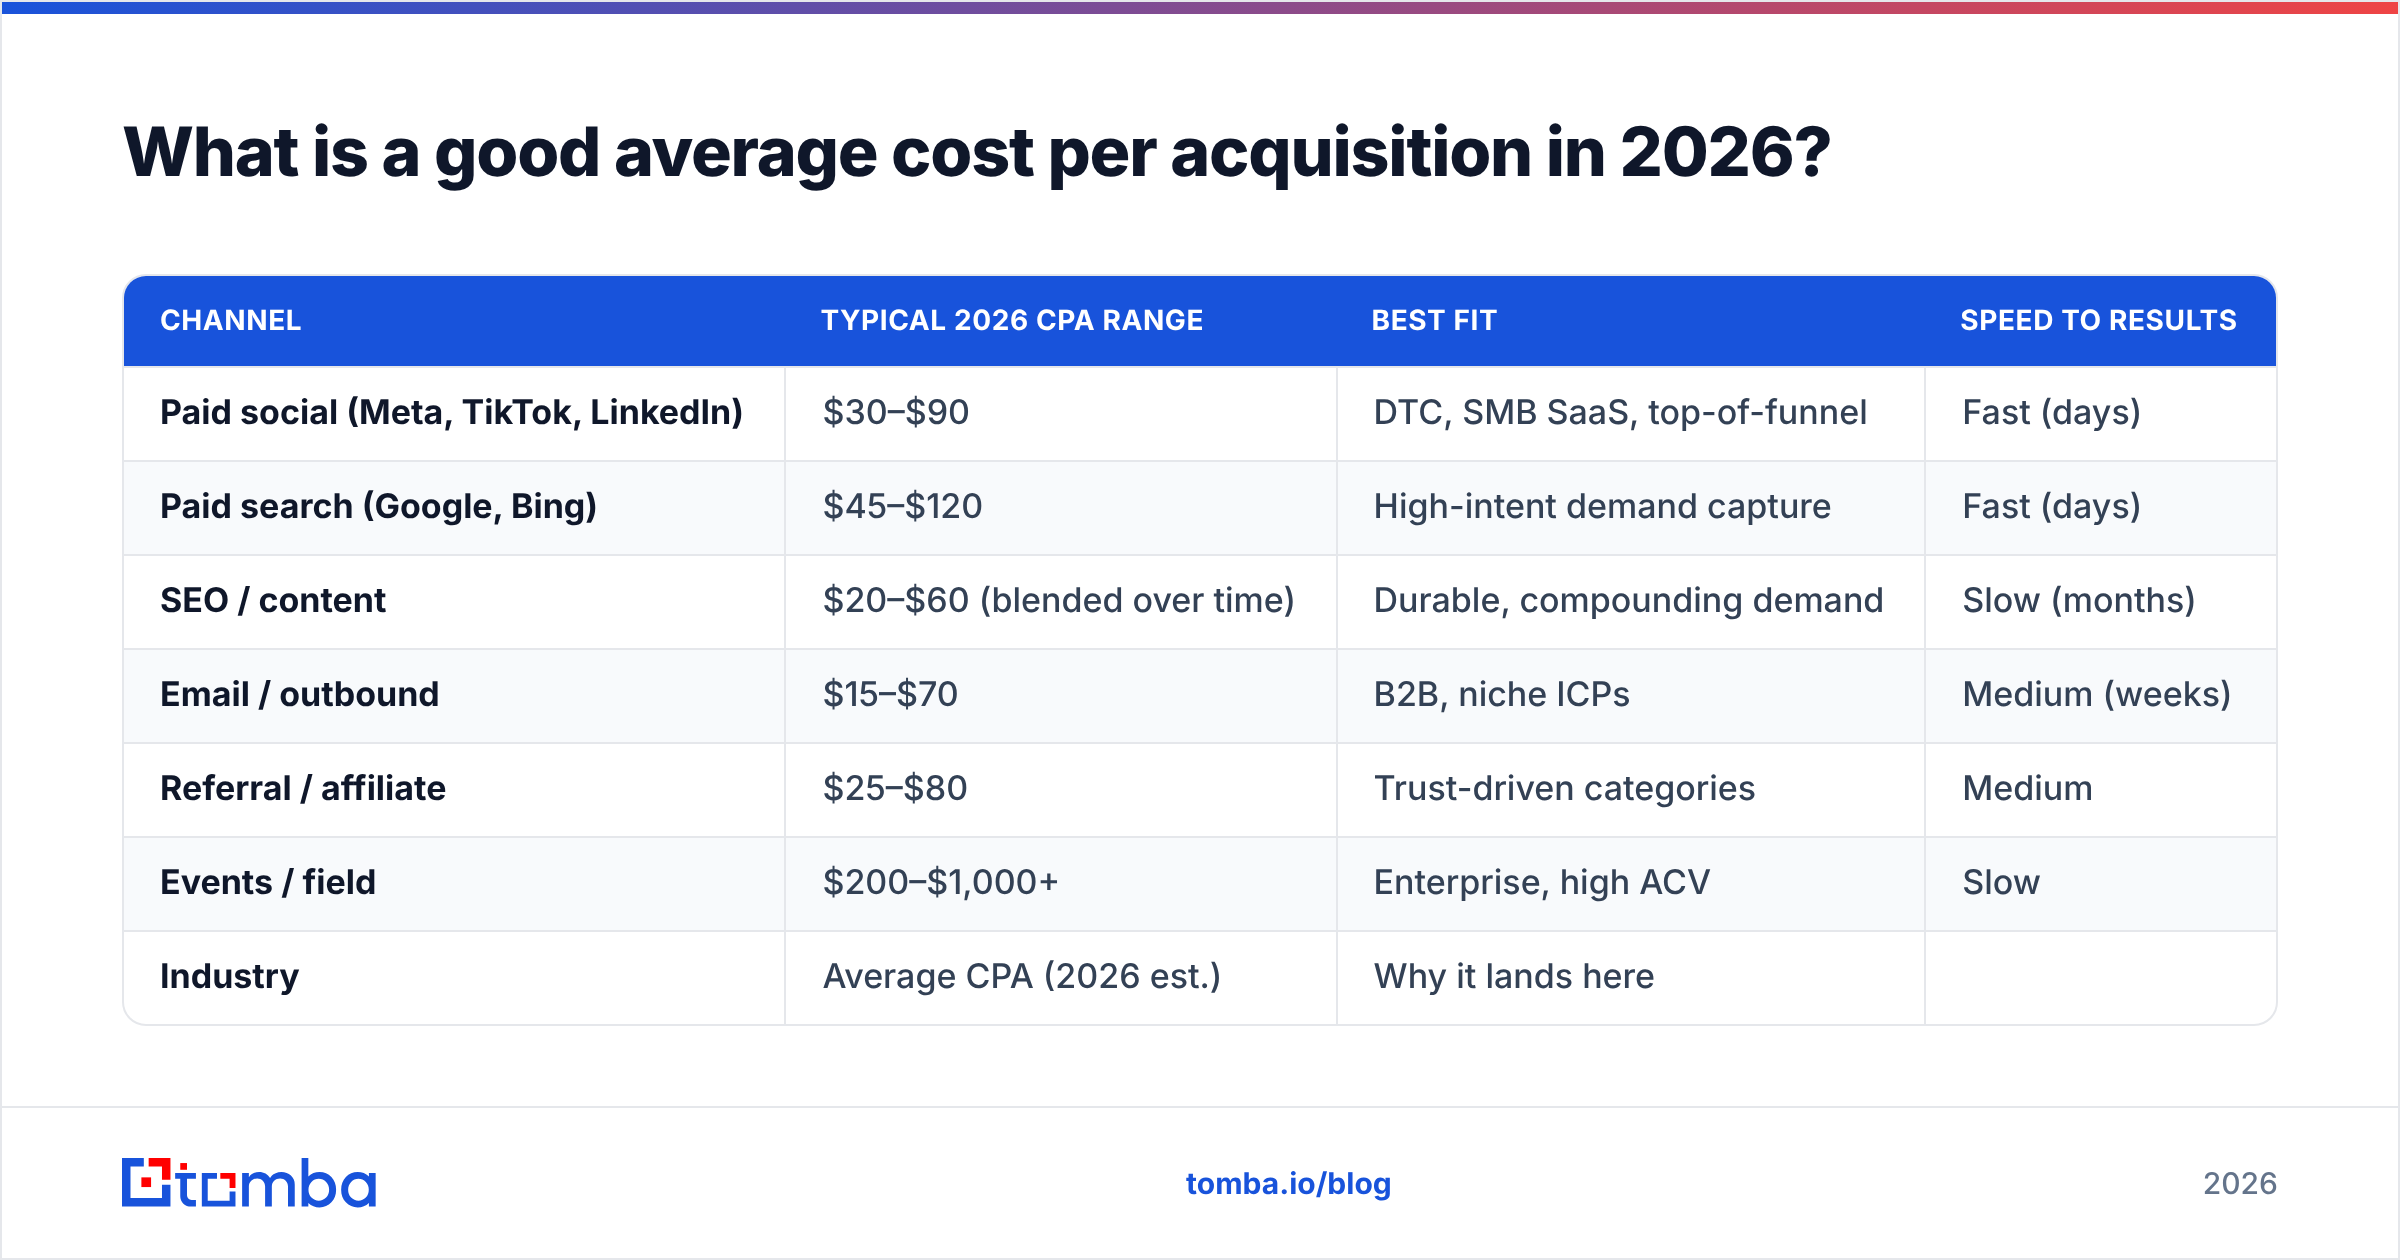
| Paid social (Meta, TikTok, LinkedIn) | $30–$90 | DTC, SMB SaaS, top-of-funnel | Fast (days) |
| Paid search (Google, Bing) | $45–$120 | High-intent demand capture | Fast (days) |
| SEO / content | $20–$60 (blended over time) | Durable, compounding demand | Slow (months) |
| Email / outbound | $15–$70 | B2B, niche ICPs | Medium (weeks) |
| Referral / affiliate | $25–$80 | Trust-driven categories | Medium |
| Events / field | $200–$1,000+ | Enterprise, high ACV | Slow |
And by industry, blended CPA varies even more widely:
| Industry | Average CPA (2026 est.) | Why it lands here |
|---|---|---|
| E-commerce / DTC | $30–$70 | Low AOV forces tight efficiency |
| B2B SaaS (SMB) | $150–$450 | Longer cycles, sales involvement |
| B2B SaaS (enterprise) | $700–$5,000+ | Multi-stakeholder, long deals |
| Financial services | $250–$900 | Regulation, high LTV, fierce auctions |
| Local services | $60–$200 | Geo-limited demand |
| Education / e-learning | $40–$130 | Mixed intent, seasonal |
Treat these as orientation, not targets. Your AOV and margin decide whether the same $120 CPA is a win or a slow bleed.
Why is your average cost per acquisition rising?#
If your CPA has crept up over the last few cycles, you're not alone — and the causes are usually structural, not just "the algorithm changed":
- Auction inflation. More advertisers chasing the same keywords and audiences pushes CPCs up every year. Paid channels get more expensive by default.
- Signal loss. Privacy changes (iOS, cookie deprecation, stricter consent) degrade targeting and attribution, so platforms spend more of your budget learning.
- Funnel leakage. A rising CPA often hides a conversion problem, not a traffic problem. If your landing page or sales follow-up leaks, every channel looks expensive.
- Bad data. Bounced emails, wrong contacts, and duplicate records mean you pay to reach people who can never convert. This is the silent CPA killer — and the most fixable.
- Mismatched targeting. Broad audiences inflate volume and CPA simultaneously. Narrow, well-defined ICPs cost less per qualified outcome.
The pattern across all of these: you're paying for waste. Cutting CPA is largely the work of removing waste, not slashing budget.
How do you lower your average cost per acquisition?#
You move CPA with two big levers: pay less to reach the right people, or convert more of the people you reach. The highest-ROI work usually sits in the second bucket. Here are the moves that consistently work, roughly in order of impact-to-effort.
- Fix conversion rate first. A landing page going from 2% to 3% cuts CPA by a third with zero extra spend. Test headlines, proof, and form length before you touch budget.
- Tighten your ICP and targeting. Define the accounts and roles that actually buy, then exclude everyone else. A smaller, sharper audience almost always lowers cost per qualified acquisition.
- Clean and verify your data. Stop paying to contact dead addresses. Running lists through an email verifier before a campaign removes bounces that tank deliverability and waste spend.
- Shift mix toward owned and outbound channels. SEO and targeted outbound have no per-click auction, so their blended CPA compounds downward over time while paid stays flat or rises.
- Improve follow-up speed and sequencing. Most leads die from slow or thin follow-up. A disciplined multi-touch sequence raises conversion on leads you already paid for.
- Match offer to intent. High-intent search traffic deserves a demo CTA; cold social traffic needs a low-friction lead magnet. Mismatched offers torch CPA.
)
Notice that four of those six levers have nothing to do with ad budget. CPA is a full-funnel metric, and the cheapest wins are usually in conversion and data quality.
Why does data quality move CPA more than budget?#
Because you can't lower the cost of reaching the right person if you don't have the right person's contact details. This is the lever most teams underweight, and it's where outbound quietly outperforms paid.
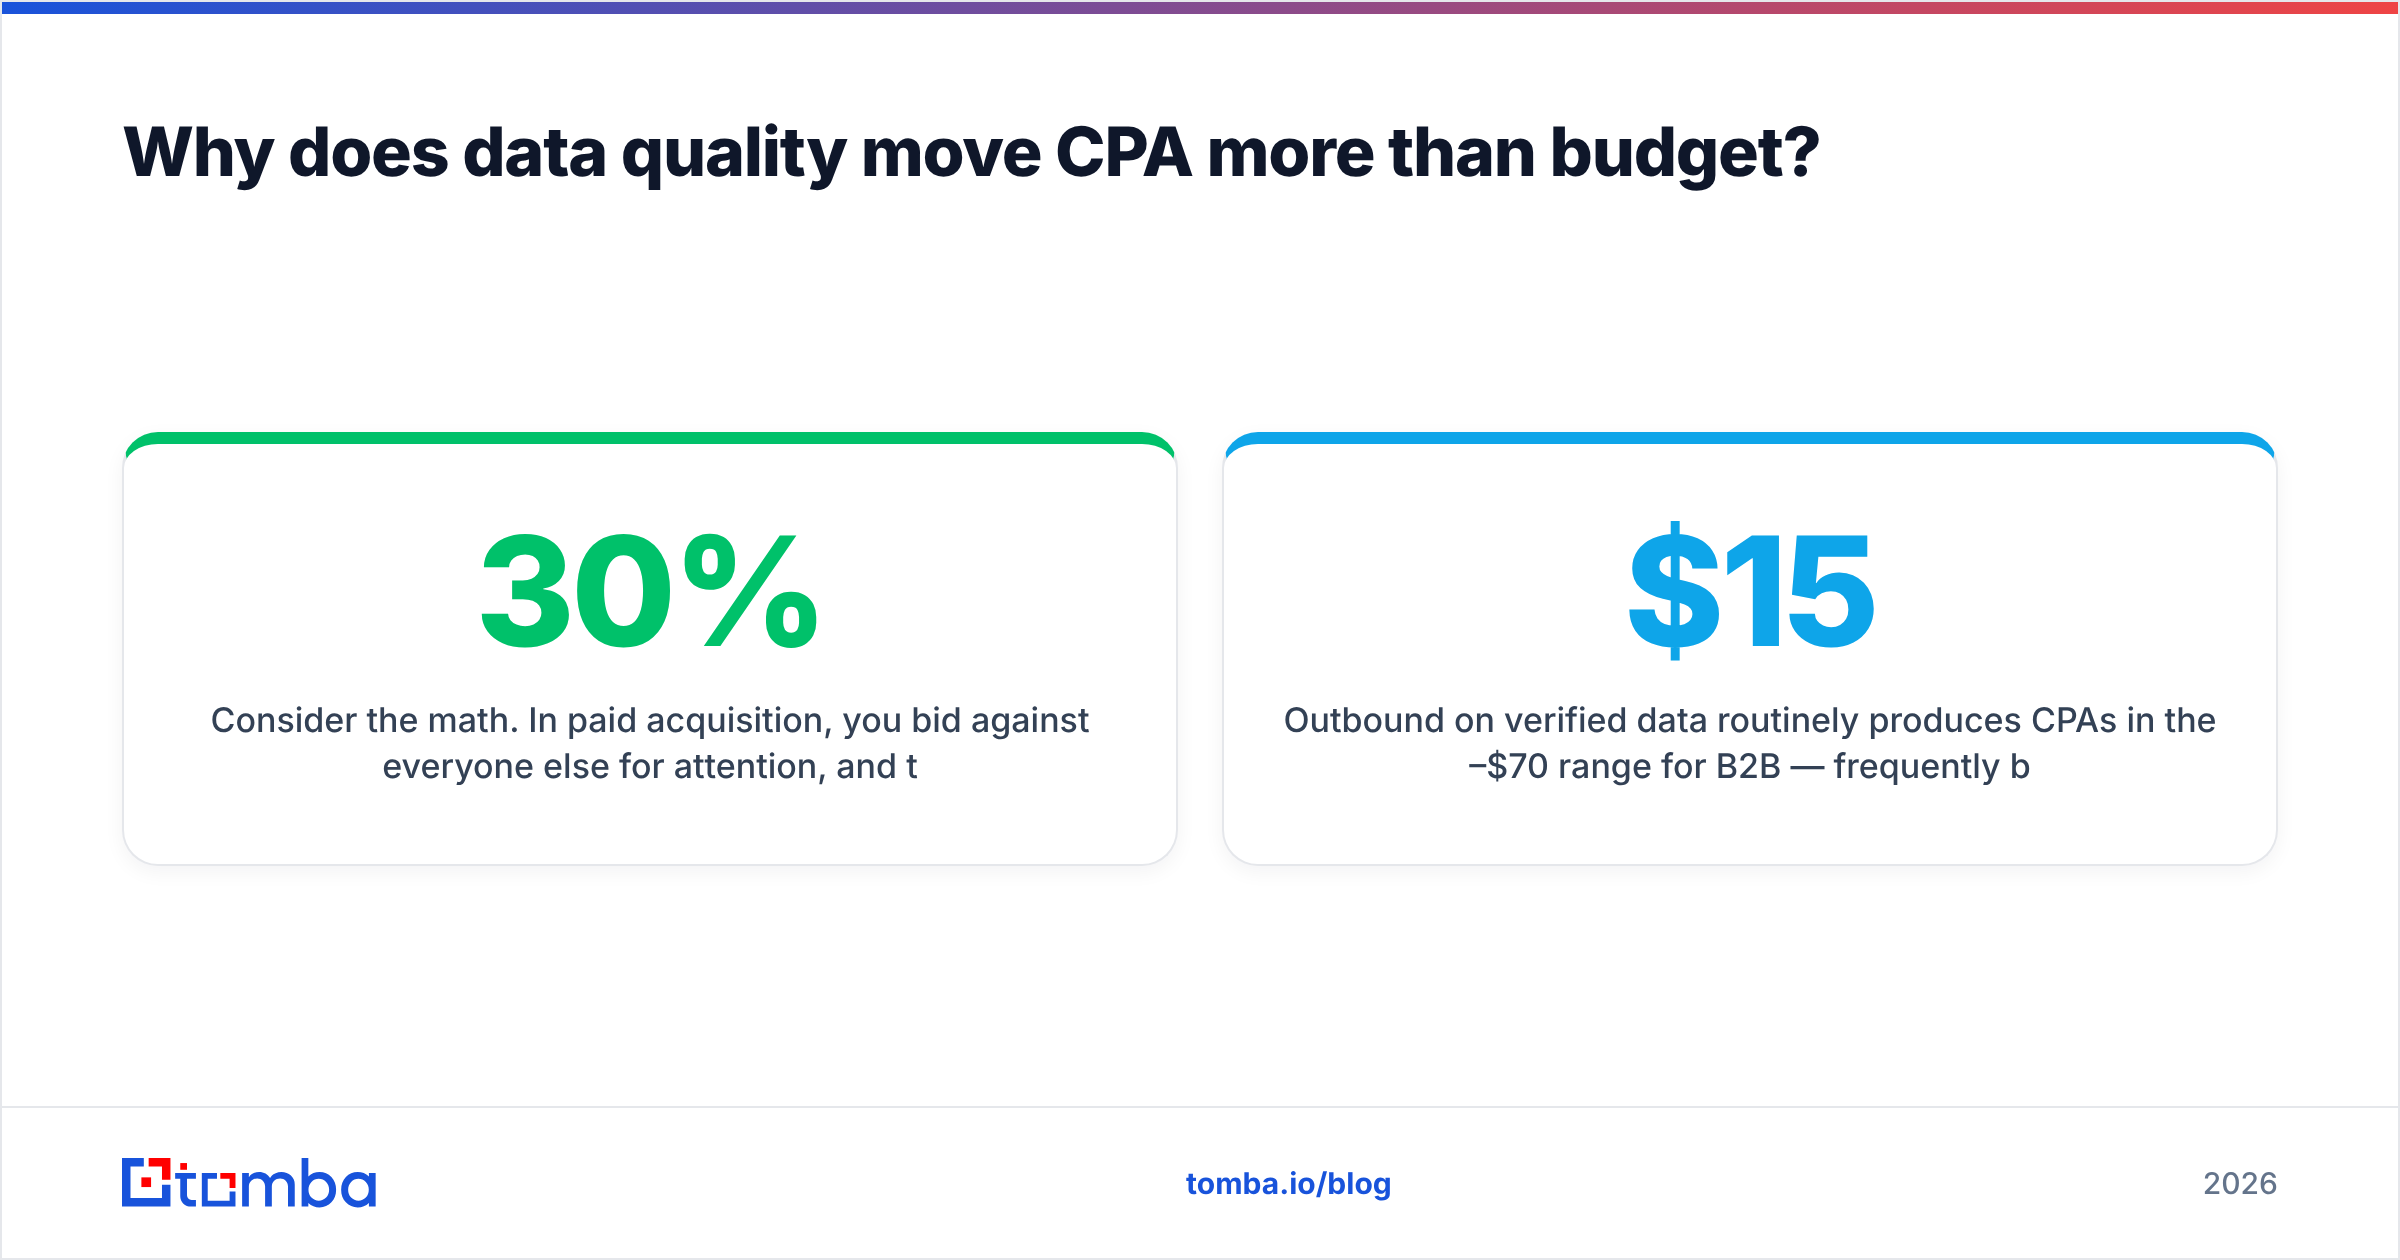
Consider the math. In paid acquisition, you bid against everyone else for attention, and the platform takes a margin on every impression. In outbound, your cost is essentially your tooling plus the time to build and work a list. If that list is accurate, your effective CPA can sit well below paid benchmarks — but if 30% of your contacts bounce, you've burned a third of your effort and damaged sender reputation, which raises the cost of every future send.
This is why a precise email finder and verification step is a CPA tool, not just a prospecting convenience. Accurate, deduplicated, verified contact data means:
- Fewer wasted touches (lower cost per real conversation)
- Better deliverability (more of your sends actually land)
- Cleaner attribution (you know which segments convert)
- Higher reply rates from reaching the right person directly
Outbound on verified data routinely produces CPAs in the $15–$70 range for B2B — frequently beating paid search and social, because you never enter the auction in the first place. Pair that with a B2B database and you're building pipeline at a cost structure paid channels can't match.
CPA vs CAC vs ROAS: which should you optimize?#
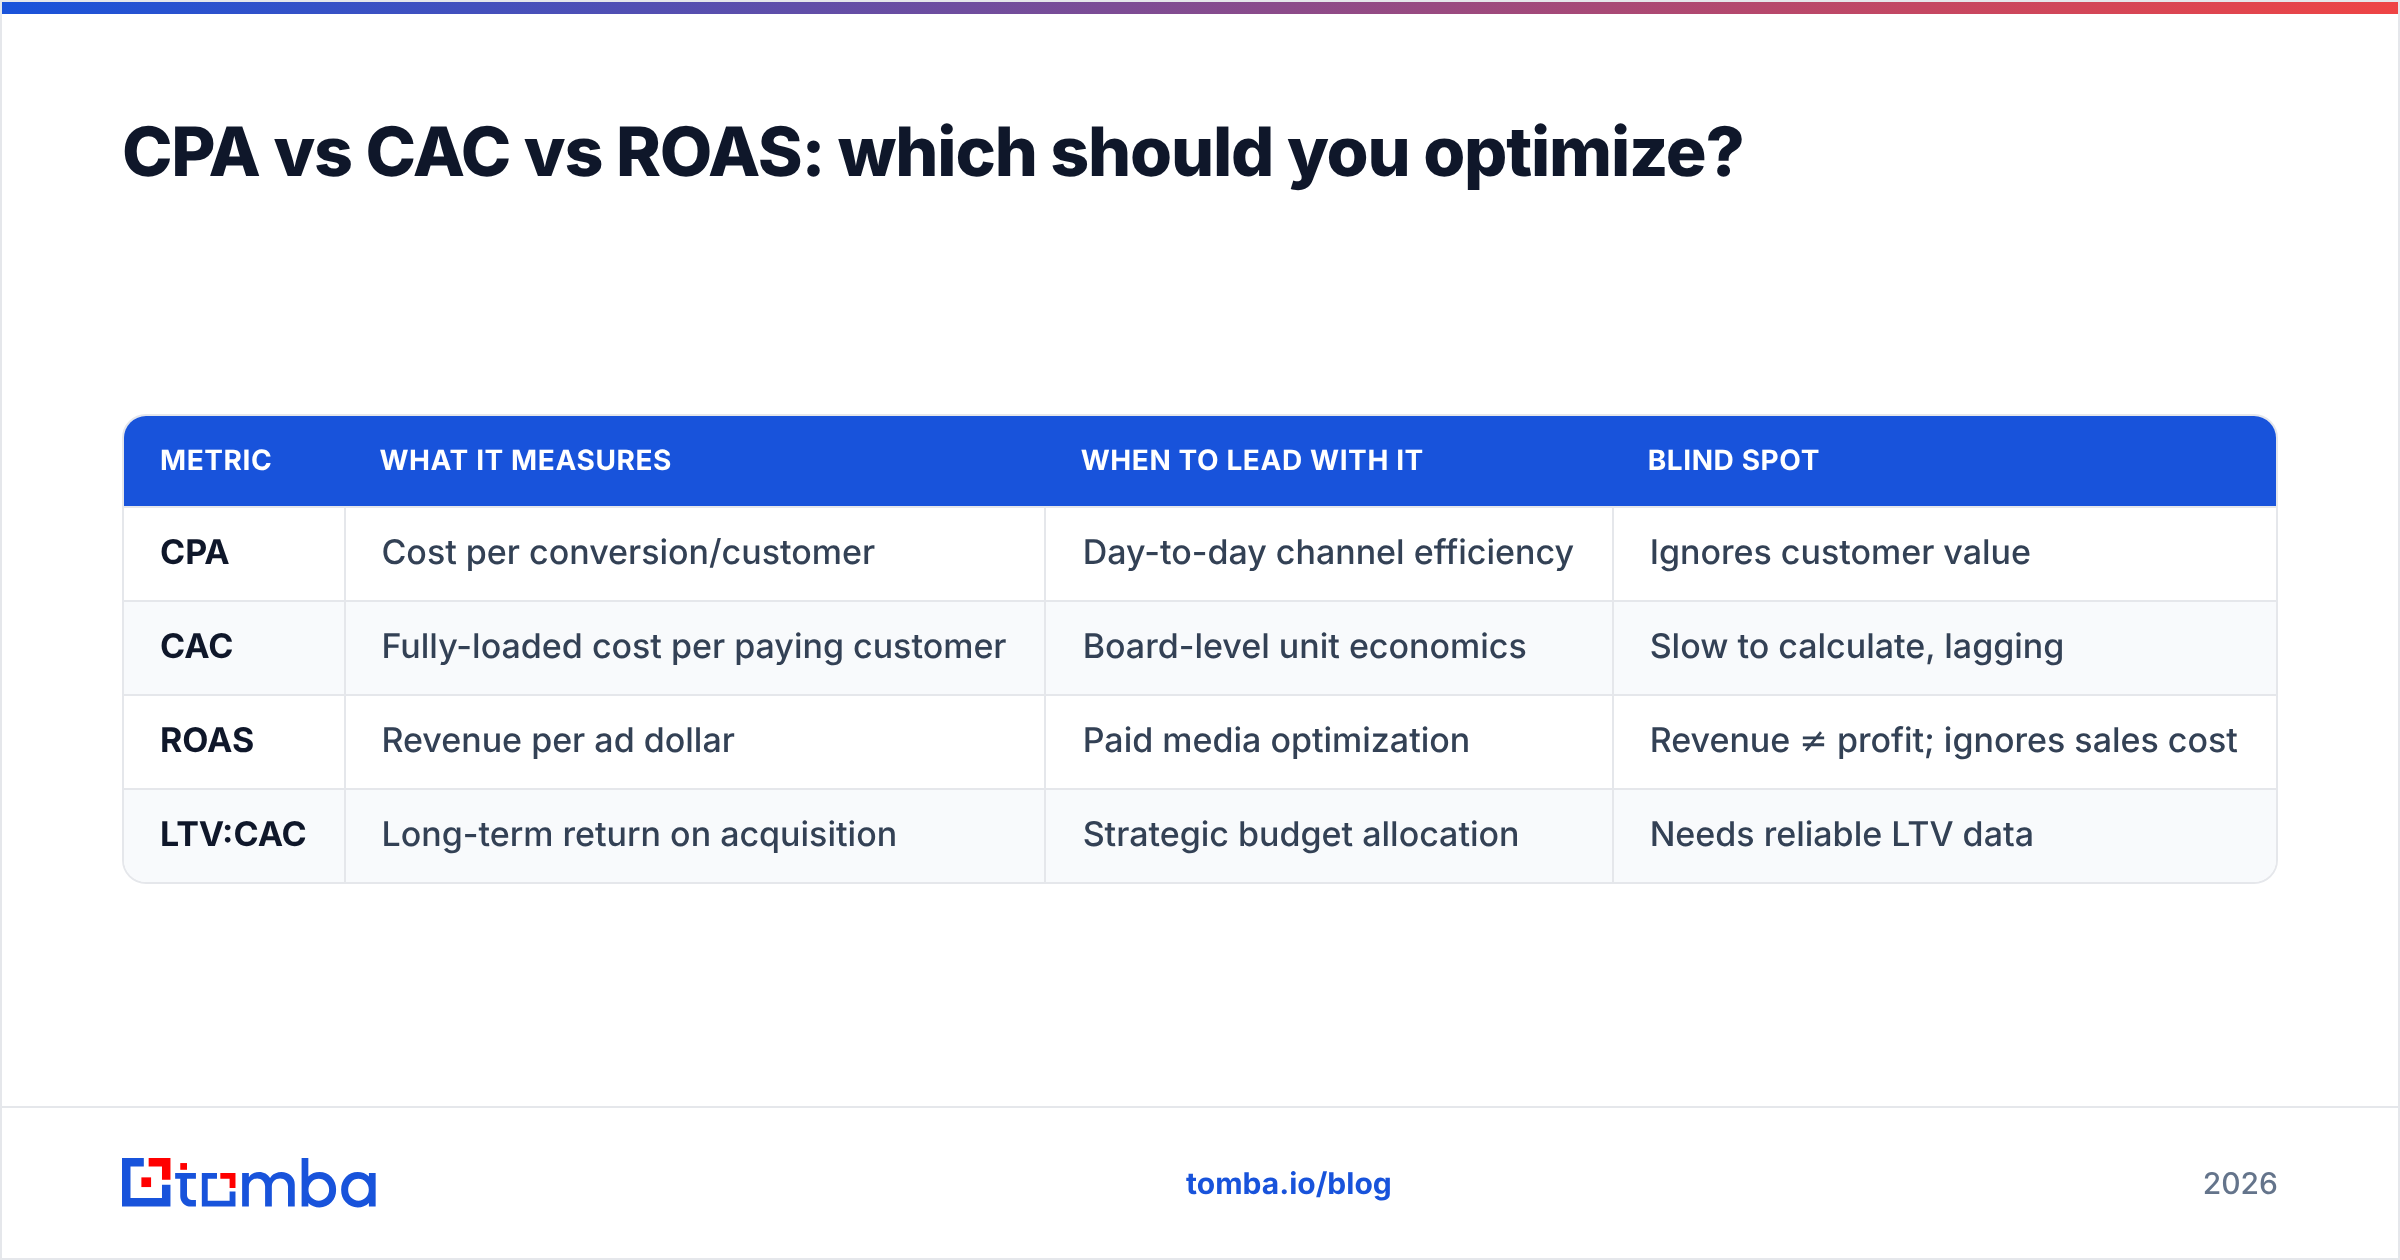
These three metrics measure overlapping but distinct things, and optimizing the wrong one leads to bad decisions. Here's how they compare:
| Metric | What it measures | When to lead with it | Blind spot |
|---|---|---|---|
| CPA | Cost per conversion/customer | Day-to-day channel efficiency | Ignores customer value |
| CAC | Fully-loaded cost per paying customer | Board-level unit economics | Slow to calculate, lagging |
| ROAS | Revenue per ad dollar | Paid media optimization | Revenue ≠ profit; ignores sales cost |
| LTV:CAC | Long-term return on acquisition | Strategic budget allocation | Needs reliable LTV data |
The practical hierarchy: use CPA and ROAS for in-channel tuning week to week, but make budget and strategy decisions on CAC and LTV:CAC. A campaign can have a beautiful ROAS and still lose money once you load in sales salaries — which is exactly why a paid-only view of "CPA" is dangerous. The metric you report up should always be the fully-loaded one.
How should you track average cost per acquisition over time?#
Track CPA as a trend, segmented, never as a single blended number in isolation. A blended CPA of $200 can hide a $40 channel subsidizing a $900 one. Best practices:
- Segment by channel, campaign, and ICP segment so you can kill losers and scale winners.
- Compare against a rolling 90-day baseline, not last month — short windows are noisy.
- Pair every CPA with its conversion rate and LTV so you catch when a "cheaper" channel is actually bringing worse customers.
- Watch payback period. A low CPA with a 24-month payback can still strangle cash flow.
- Annotate for data changes. When you clean a list or change targeting, mark it — you want to attribute CPA shifts to the right cause.
Most teams already have the spend data in their ad platforms and the conversion data in their CRM. The gap is usually connecting the two cleanly, which is again a data-hygiene problem. Deduplicated, enriched records in your CRM make CPA reporting trustworthy instead of a monthly argument about whose numbers are right.
What's a realistic CPA-reduction roadmap?#
If you want a concrete sequence, run it in this order over a quarter:
- Weeks 1–2: Audit and clean your contact data; verify every list before use. Establish a fully-loaded CAC baseline.
- Weeks 3–4: Fix the single worst-converting step in your funnel (usually the landing page or the first follow-up touch).
- Weeks 5–8: Tighten targeting to your proven ICP; cut or pause the worst-performing audiences and keywords.
- Weeks 9–12: Shift budget toward your lowest-CPA channels and stand up a verified-data outbound motion to reduce reliance on the paid auction.
Each step removes waste rather than just cutting spend, which is why CPA falls without volume collapsing.
The bottom line#
Average cost per acquisition is the price you pay for growth, and the number only means something next to LTV and payback. In 2026, paid channels keep getting more expensive thanks to auction inflation and signal loss — so the durable wins come from converting more of the traffic you already pay for and from building acquisition on accurate, verified data instead of bidding against the entire market.
If you want to attack CPA at the source, start where the waste is biggest: the data. Use Tomba's Email Finder to build targeted, verified contact lists that let you reach the right buyers directly — skipping the ad auction, slashing bounces, and driving a blended CPA that paid channels struggle to touch. You can test it on the free tier (25 searches/month), and review Tomba pricing — Starter at $49/mo — when you're ready to scale outbound that pays for itself.
Ready to find emails that actually work?
Join 150,000+ professionals who stopped guessing and started sending. Free credits on signup — no credit card required.
Get the Tomba newsletter
Practical outbound tactics and product updates — once every two weeks.
About the author