Average Deal Size: How to Calculate and Grow It in 2026
Learn what average deal size means, how to calculate it correctly, and seven proven levers to grow ADS without chasing more leads in 2026.
TL;DR
- Average deal size (ADS) is total closed revenue divided by the number of closed deals over a period — the single fastest lever for revenue growth that doesn't require more leads.
- The honest formula is simple, but most teams pollute it by mixing renewals, multi-year contracts, and one-off discounts into the same bucket.
- A 20% lift in average deal size compounds across your whole pipeline — often cheaper than a 20% lift in win rate or volume.
- You grow ADS through targeting, packaging, multi-threading, and discipline on discounting — not by hoping bigger logos show up.
- Clean contact data is the unglamorous foundation: you can't sell up-market if you can't reach the economic buyer.
What is average deal size?#
Average deal size is the average revenue you collect per closed-won deal over a given period. Think of it like the average check size at a restaurant: two restaurants can serve the same number of tables a night, but the one with a $90 average check prints money while the one at $30 fights to make rent. Same traffic, wildly different outcomes.
Technically, average deal size (ADS) is a sales efficiency metric that tells you how much revenue each closed deal contributes on average. It sits next to win rate, sales cycle length, and sales win rate as one of the four numbers that actually move a forecast. Ignore it and you'll keep adding headcount and ad spend to grow revenue that a packaging change could have delivered for free.
The reason ADS matters so much: it's a multiplier, not an additive. Revenue ≈ leads × win rate × average deal size. Push any single factor up 20% and revenue moves 20%. But average deal size is usually the cheapest of the three to move, because it lives in your pricing, targeting, and negotiation — levers you already own.
How do you calculate average deal size?#
The base formula is one line:
Average Deal Size = Total Revenue from Closed-Won Deals ÷ Number of Closed-Won Deals
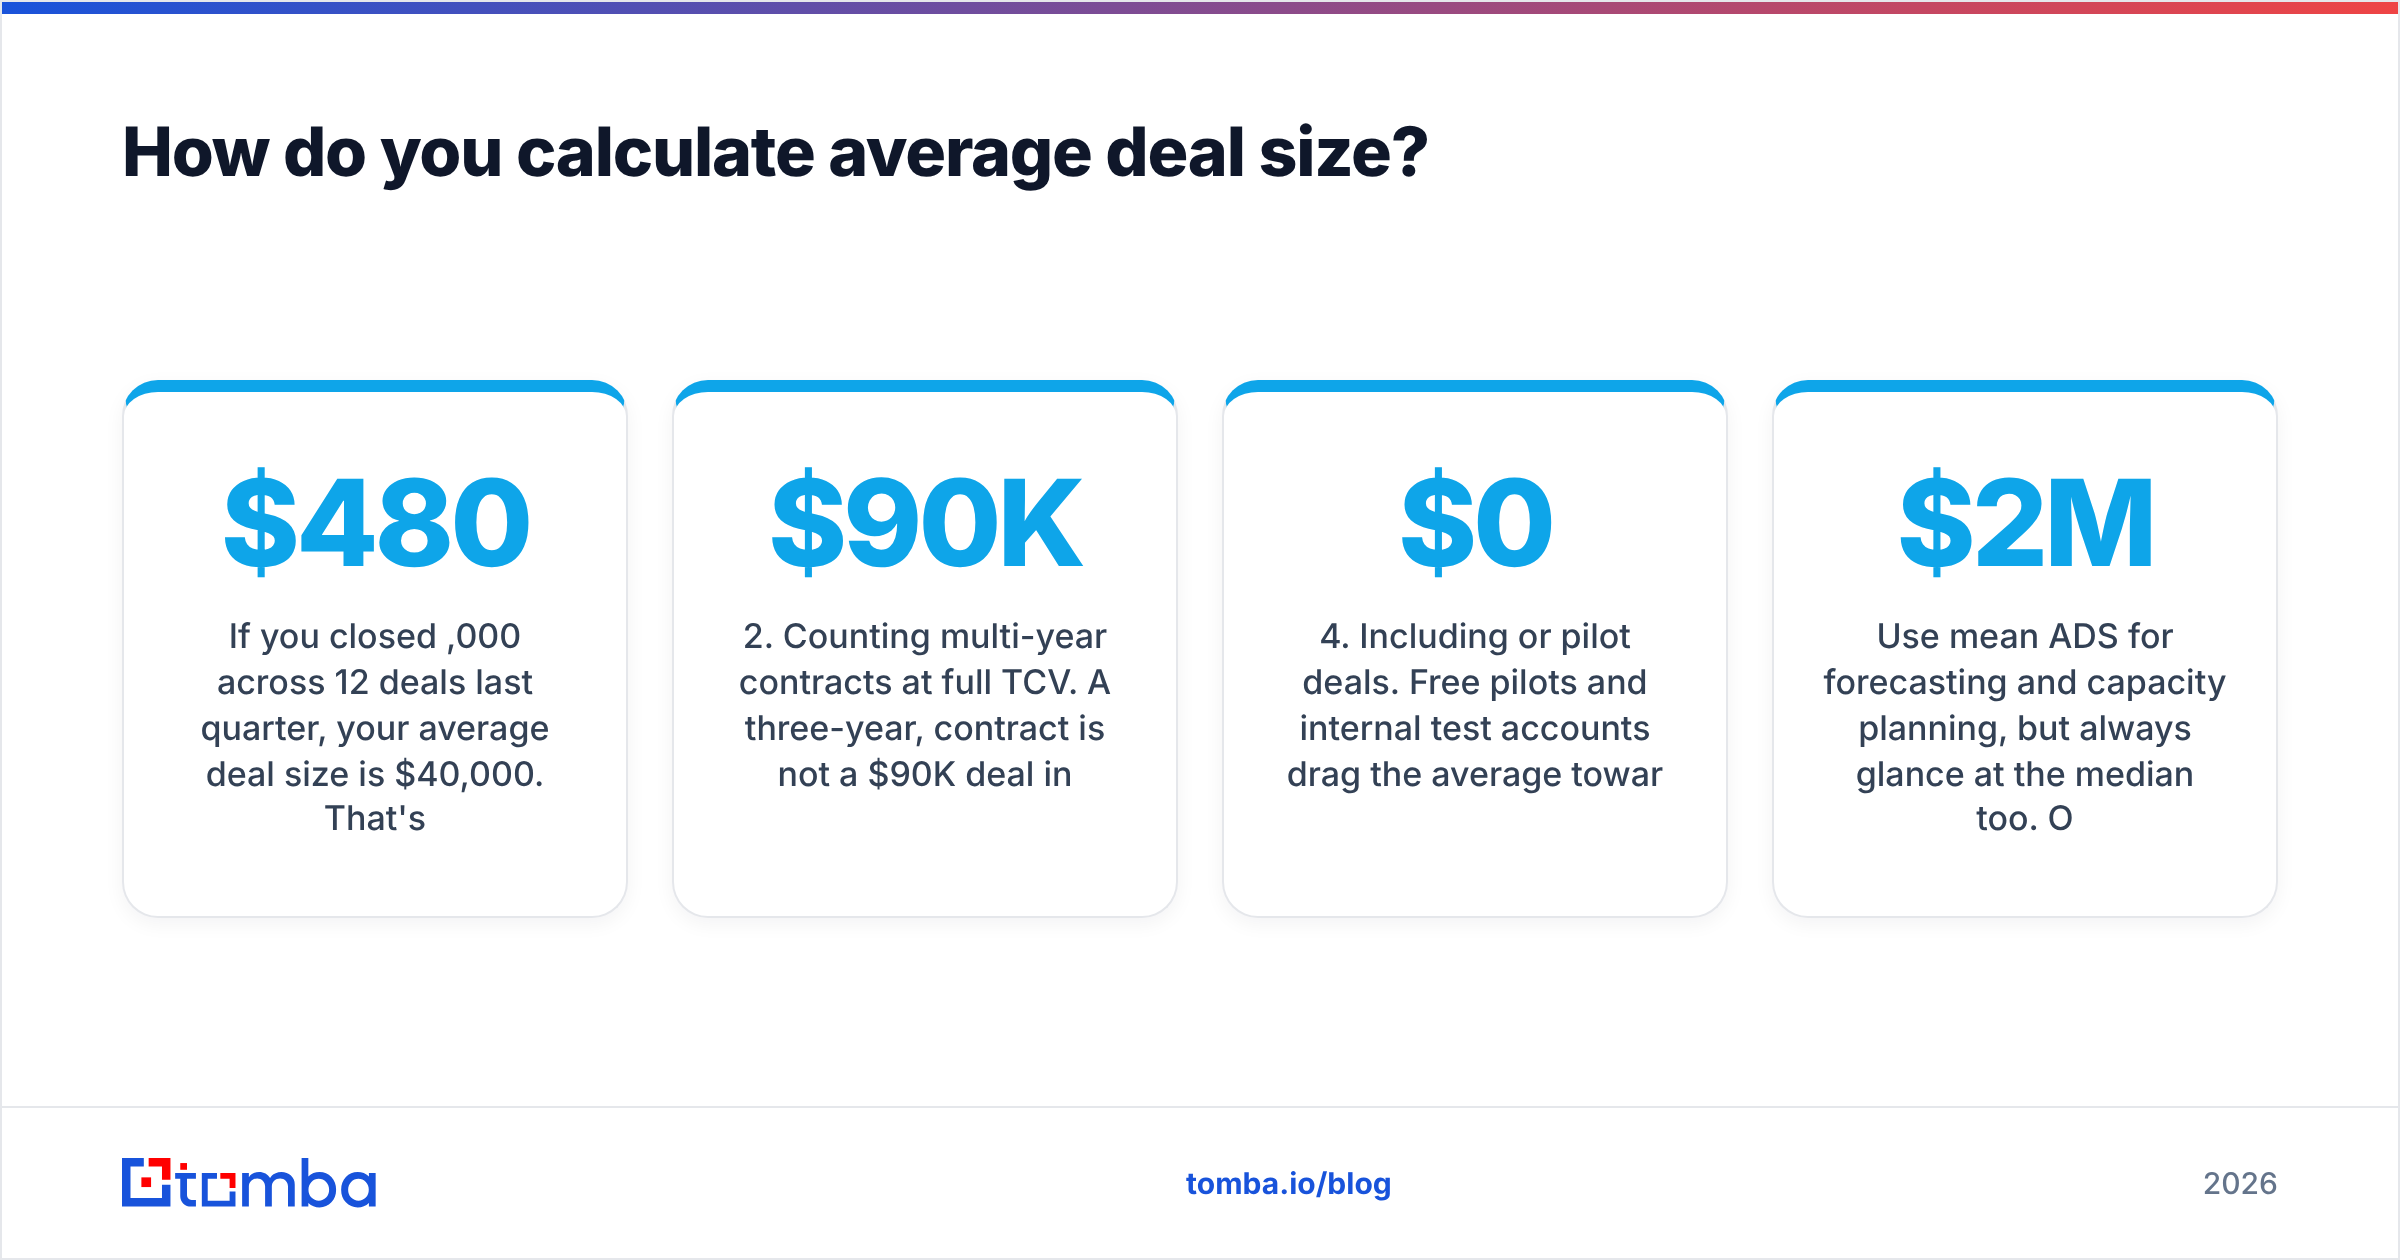
If you closed $480,000 across 12 deals last quarter, your average deal size is $40,000. That's it. The arithmetic is trivial; the discipline is in what you count.
Here's where teams quietly lie to themselves:
- Mixing new business with renewals. A renewal is not a new deal. Blend them and your ADS looks healthier than your acquisition engine actually is. Track them in separate buckets.
- Counting multi-year contracts at full TCV. A three-year, $90K contract is not a $90K deal in a quarter where you measure everything else in annual terms. Normalize to annual contract value (ACV) or you'll distort every downstream ratio.
- Ignoring discounts. Use booked revenue (post-discount), not list price. List-price ADS is a vanity number.
- Including $0 or pilot deals. Free pilots and internal test accounts drag the average toward zero and hide your real selling motion.

Use mean ADS for forecasting and capacity planning, but always glance at the median too. One $2M whale among forty $15K deals makes your mean lie about a typical deal. If mean and median are far apart, segment before you draw conclusions.
What is a good average deal size benchmark?#
There is no universal "good" number — a good average deal size is entirely relative to your motion. A transactional SMB SaaS tool living on a self-serve plan might run a healthy ADS of $1,200 ACV. An enterprise platform sold by field reps might consider anything under $75K a failure. The benchmark that matters is your own trend line over time and how ADS maps to your cost of acquisition.
A useful sanity check: your average deal size should comfortably clear your fully-loaded customer acquisition cost within an acceptable payback window. If a deal costs you $9,000 to win and your ADS is $7,000 ACV, the motion is underwater before you account for churn.
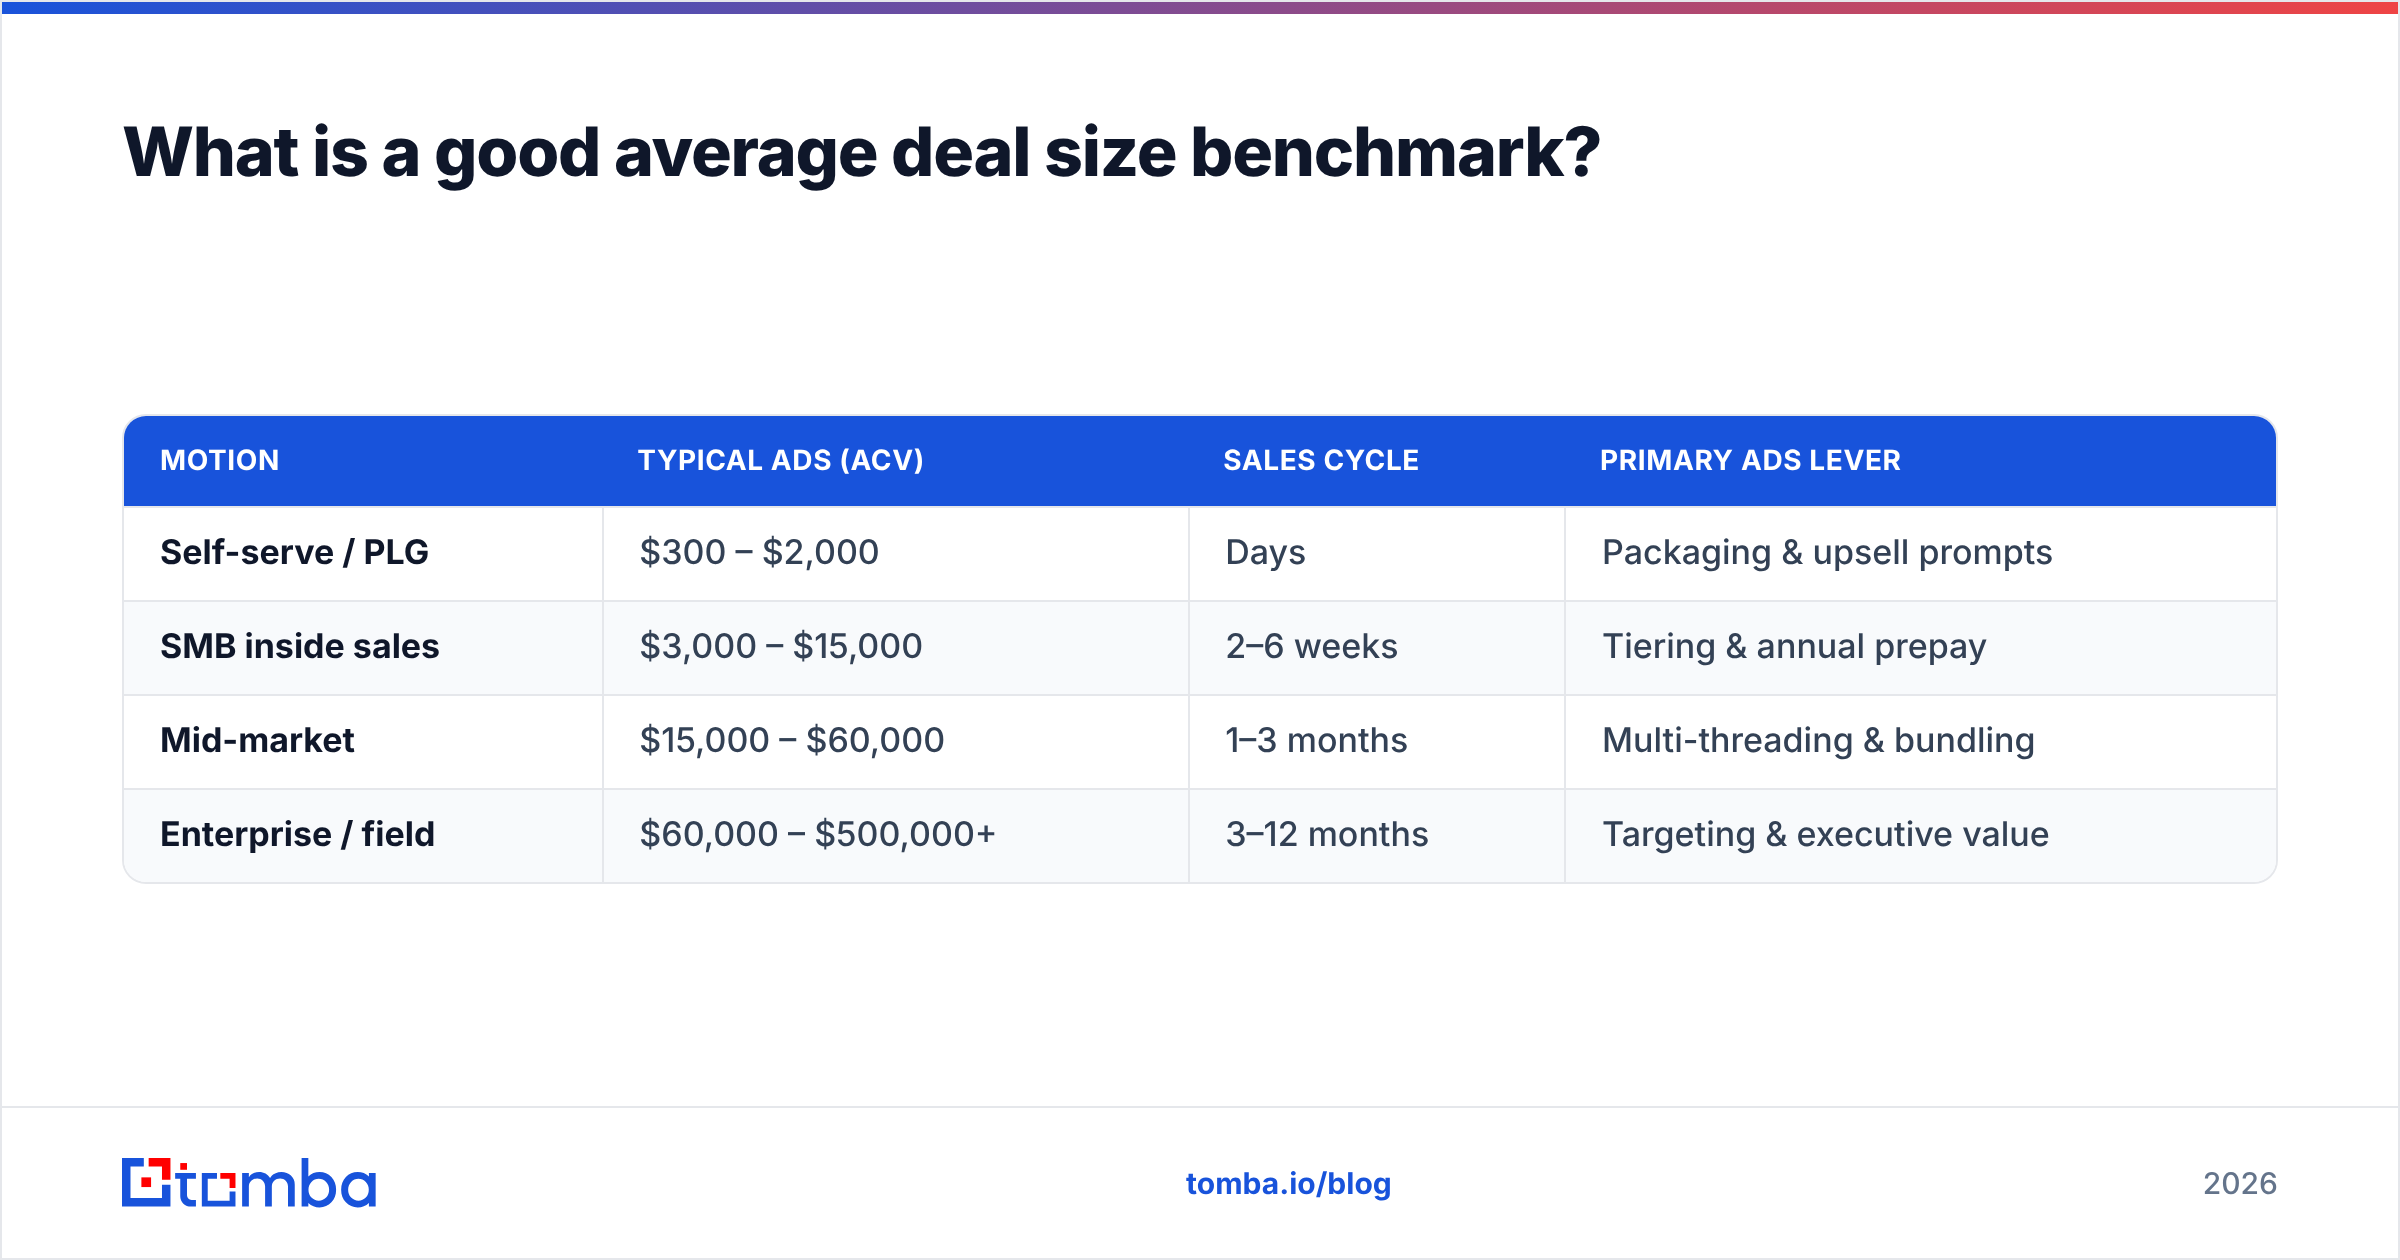
| Motion | Typical ADS (ACV) | Sales cycle | Primary ADS lever |
|---|---|---|---|
| Self-serve / PLG | $300 – $2,000 | Days | Packaging & upsell prompts |
| SMB inside sales | $3,000 – $15,000 | 2–6 weeks | Tiering & annual prepay |
| Mid-market | $15,000 – $60,000 | 1–3 months | Multi-threading & bundling |
| Enterprise / field | $60,000 – $500,000+ | 3–12 months | Targeting & executive value |
Industry comparison data is widely published — vendor benchmark reports from sources like HubSpot and analyst firms such as Gartner are reasonable directional references — but treat any external benchmark as a loose guardrail, not a target. Your sales motion, geography, and segment matter more than someone else's median.
Why does average deal size matter more than volume?#
Because volume is expensive and ADS is leverage. Conclusion first: raising average deal size is usually the highest-ROI revenue move available to a B2B team, because it requires no new lead flow and no new headcount — just better targeting and discipline.
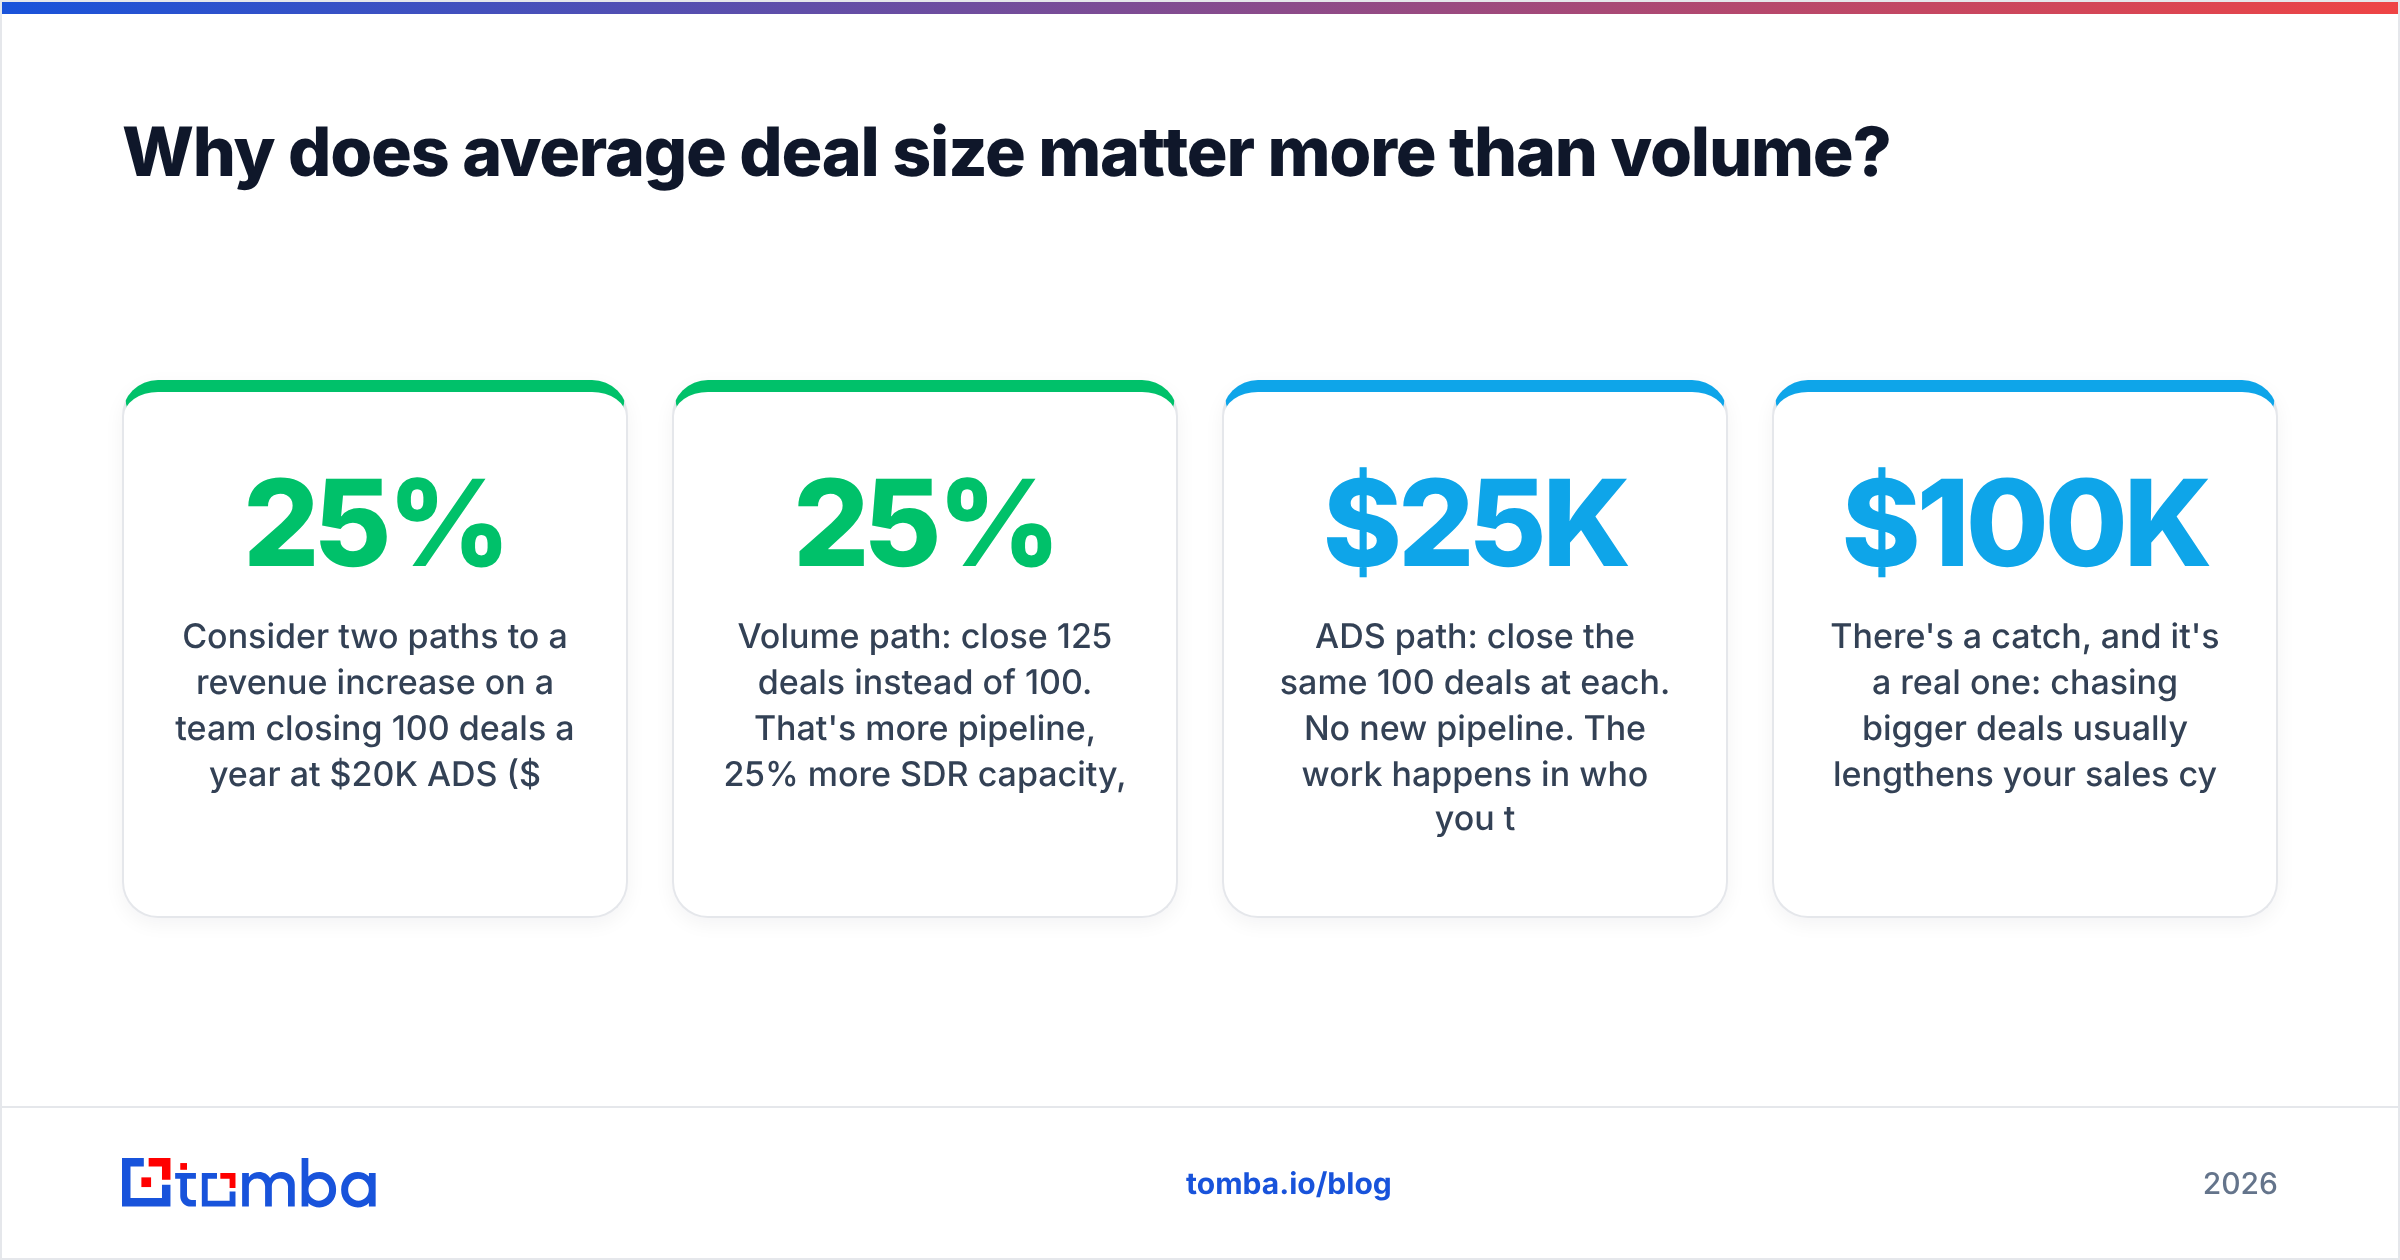
Consider two paths to a 25% revenue increase on a team closing 100 deals a year at $20K ADS ($2M):
- Volume path: close 125 deals instead of 100. That's 25% more pipeline, 25% more SDR capacity, 25% more ad spend — and the same win rate has to hold under strain.
- ADS path: close the same 100 deals at $25K each. No new pipeline. The work happens in who you target and how you package.
The ADS path is almost always cheaper to execute. It's also compounding: a higher average deal size lifts your LTV, improves payback period, and gives you margin to invest back into the motion. This is why mature revenue operations teams obsess over ADS segmentation — it's the quiet engine behind efficient growth.
There's a catch, and it's a real one: chasing bigger deals usually lengthens your sales cycle and lowers win rate. A $100K deal involves more stakeholders, more procurement, and more ways to stall. So the goal isn't "biggest deals possible" — it's the highest ADS your motion can close efficiently. Track ADS, win rate, and cycle length together, never in isolation.
How do you increase average deal size? (7 levers)#
Here are the seven levers that actually move average deal size, ordered roughly from fastest to most structural:
- Target up-market accounts deliberately. The single biggest ADS driver is who you sell to. Bigger companies have bigger budgets and more seats. Build an ICP weighted toward accounts with the headcount and revenue to support a larger contract, then feed reps a list that matches it — not a random scrape.
- Multi-thread every opportunity. Single-threaded deals close small or die. When you engage the economic buyer plus two or three influencers, deal size grows because more use cases enter the conversation. This is why reaching the right people — not just any inbox — is foundational.
- Package into tiers with an obvious "good-better-best." Anchoring works. A visible enterprise tier makes the mid-tier feel reasonable and pulls the average up. Most buyers land one notch above where they'd self-select.
- Bundle complementary products. Attach an add-on, a premium support SLA, or a second module. Bundles raise ADS while feeling like value to the buyer, not a price hike.
- Sell annual (or multi-year) prepay. Shifting from monthly to annual billing instantly multiplies booked deal value and improves cash flow and retention at the same time.
- Defend price with disciplined discounting. Every reflexive 20% discount is a permanent ADS tax. Require approval thresholds, trade discounts for concessions (case study, longer term, faster close), and your average climbs without a single new prospect.
- Quantify ROI in the buyer's terms. Reps who frame value as "this saves your team $180K/year" close larger than reps who pitch features. Bigger perceived value supports bigger price.

Notice that five of the seven levers depend on reaching the right people inside the right accounts. That's the unglamorous prerequisite no playbook mentions: you cannot multi-thread an enterprise deal or target up-market if your contact data is stale, generic, or missing the decision-makers entirely.
How does contact data quality affect average deal size?#
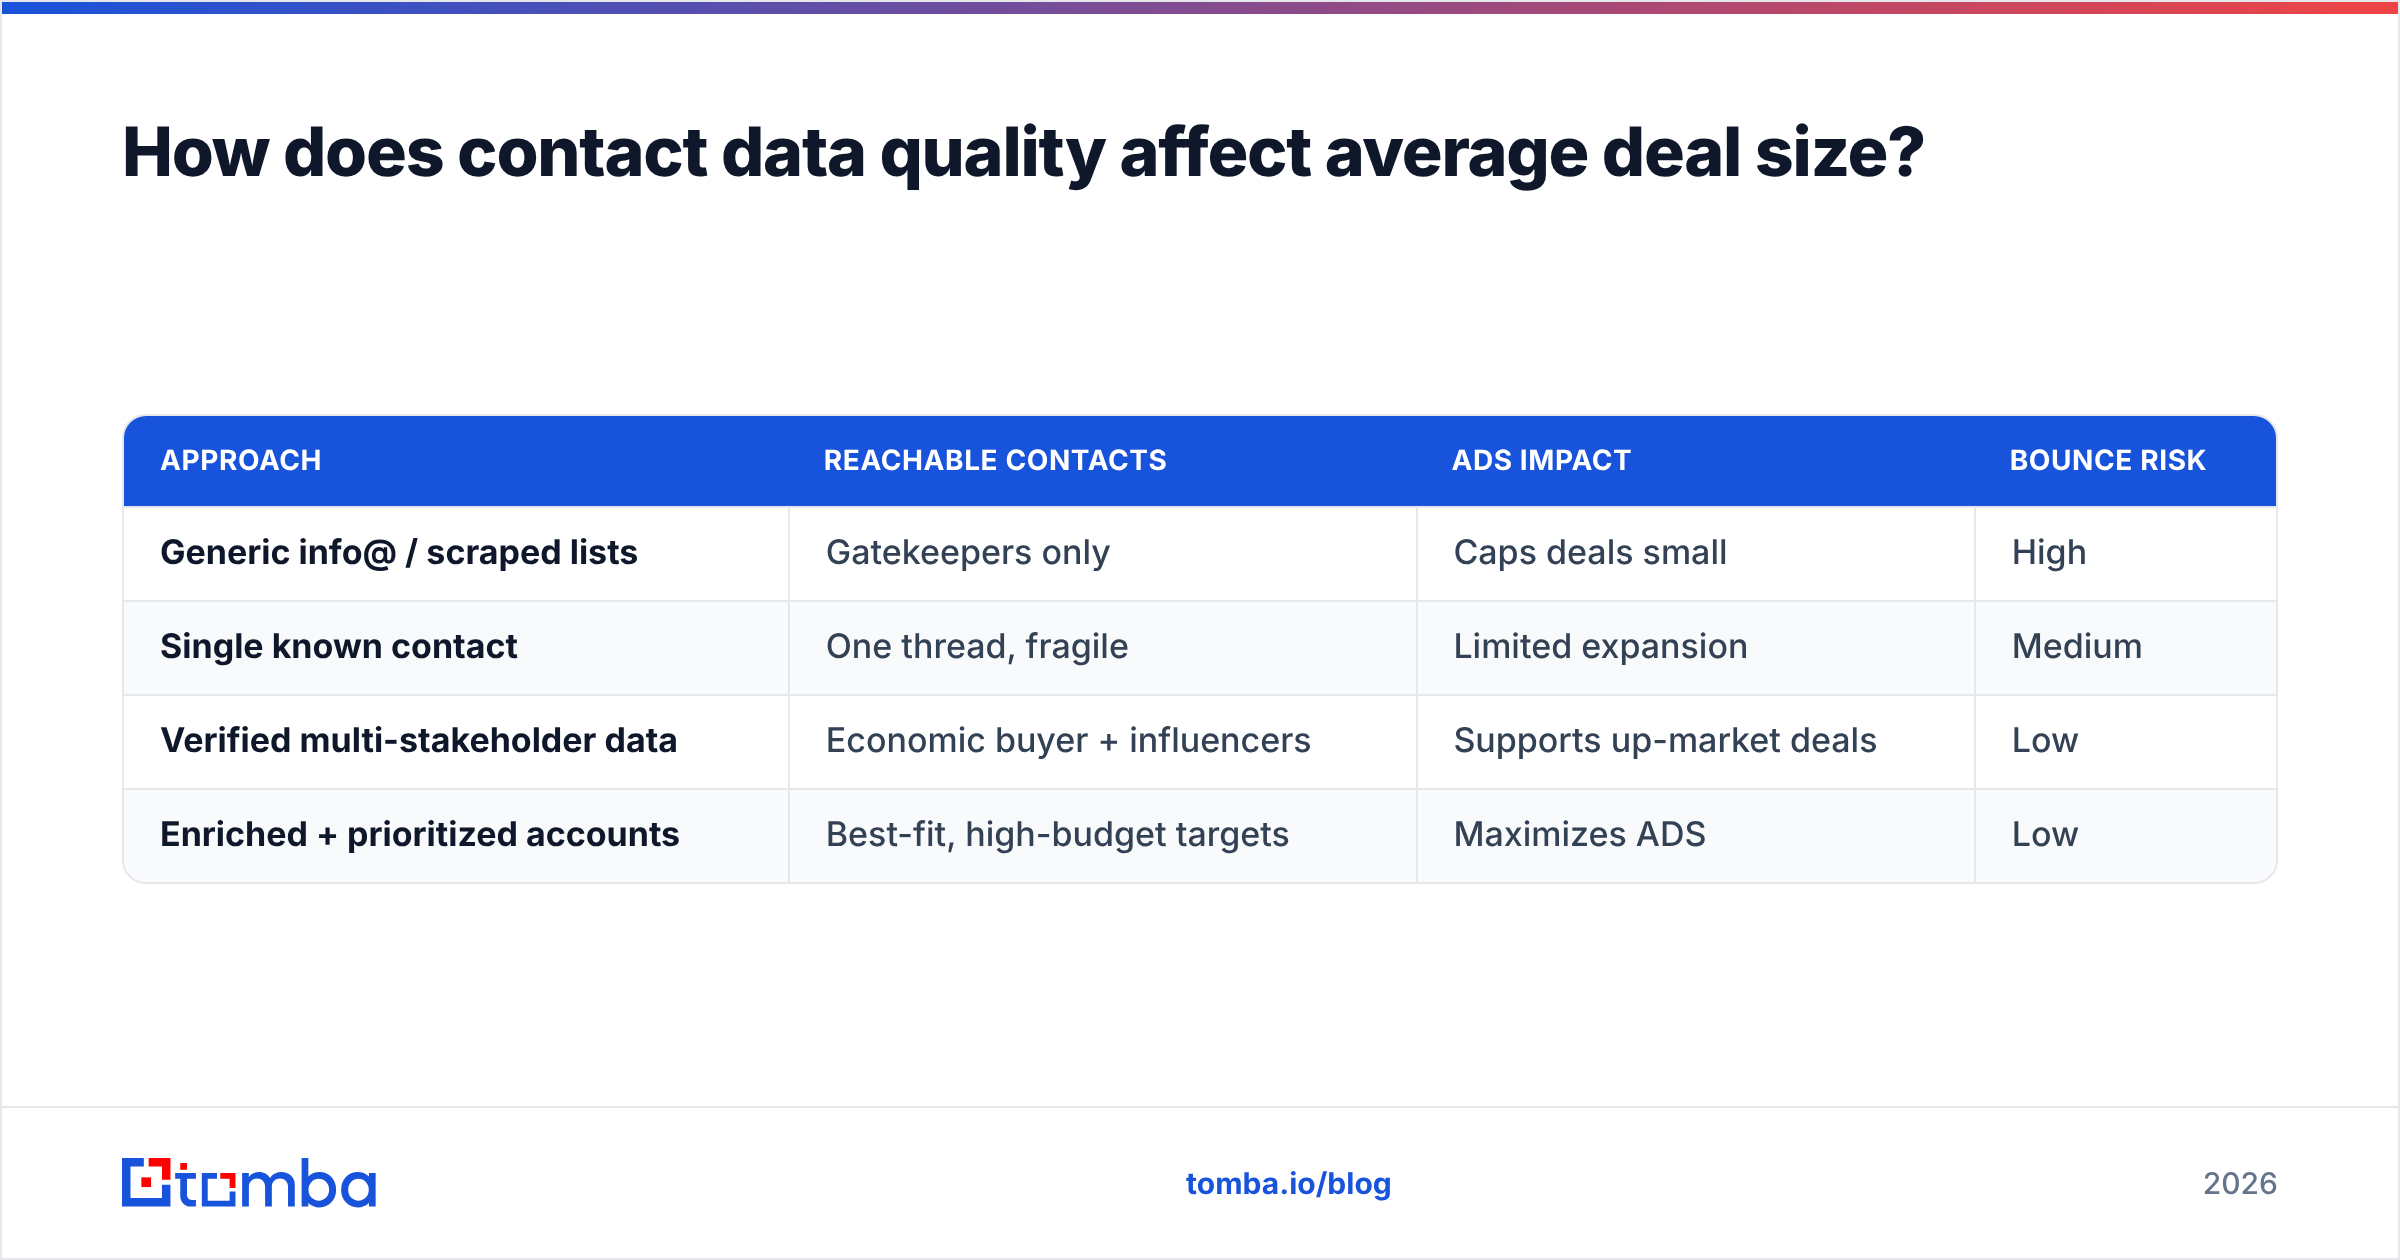
Directly and underrated-ly. Conclusion first: bad contact data caps your average deal size because it forces reps to sell to whoever they can reach — usually a low-level contact who can't authorize a large purchase — instead of the economic buyer who can.
Think of it like fishing. If your net only reaches the shallow water near the dock, you'll catch small fish no matter how good your technique is. The decision-makers with real budget are in deeper water, and you need accurate, verified contact details to get there. A junior analyst will champion a $5K pilot; a VP of Operations will sign a $75K platform deal. Reaching the VP is a data problem before it's a selling problem.
This is where a precise email finder earns its keep. When your reps can reliably find and verify the email of a specific senior stakeholder — by name, role, and company — they multi-thread into the accounts that support larger deals. Pair that with data enrichment to prioritize accounts by size and fit, and your pipeline naturally skews toward higher ADS opportunities. Verified data also keeps your outreach landing: every bounce to a guessed address is a stakeholder you never reached and a deal that stays small.
| Approach | Reachable contacts | ADS impact | Bounce risk |
|---|---|---|---|
| Generic info@ / scraped lists | Gatekeepers only | Caps deals small | High |
| Single known contact | One thread, fragile | Limited expansion | Medium |
| Verified multi-stakeholder data | Economic buyer + influencers | Supports up-market deals | Low |
| Enriched + prioritized accounts | Best-fit, high-budget targets | Maximizes ADS | Low |
The teams with the highest average deal size are rarely the ones with the slickest demos. They're the ones who consistently get in front of the people who can say yes to a big number — and that starts with knowing exactly who those people are and how to reach them.
How often should you review average deal size?#
Review average deal size at the same cadence you review your forecast — monthly at minimum, quarterly for trend analysis. The number is noisy week to week (one whale skews it), so look at rolling 90-day windows for stability and segment by source, rep, segment, and product line.
A few diagnostic questions worth asking every quarter:
- Is ADS rising or falling, and is that movement intentional?
- Which lead source produces the highest average deal size? (Often it's not the cheapest one.)
- Are specific reps consistently closing larger deals — and what are they doing differently?
- Is discounting eroding ADS faster than win rate justifies?
Wire these into a dashboard rather than a spreadsheet you update by hand. When ADS is a live metric in your CRM, broken into segments, you stop guessing and start steering. For the data side of that equation, the Tomba API and integrations like HubSpot let you enrich and verify contacts inside the systems your reps already live in, so account prioritization happens automatically rather than as a manual chore. G2's category data and reviews on platforms like G2 are also a useful way to benchmark which tools your higher-ADS competitors rely on.
The bottom line#
Average deal size is the lever most B2B teams underuse because it hides in plain sight. You don't need more leads to grow it — you need to sell to better-fit accounts, reach the people who control budget, package value clearly, and stop discounting reflexively. Calculate it honestly, segment it, and review it on the same schedule as your forecast.
Every one of those moves depends on getting in front of the right decision-makers, and that's a contact-data problem first. Start with the Tomba Email Finder to find and verify the senior stakeholders inside your best-fit accounts — by name, role, and domain — so your reps multi-thread into the deals that actually move your average deal size up. The free tier gives you 25 searches a month to test it; see full Tomba pricing when you're ready to scale the motion across your whole pipeline.
Ready to find emails that actually work?
Join 150,000+ professionals who stopped guessing and started sending. Free credits on signup — no credit card required.
Get the Tomba newsletter
Practical outbound tactics and product updates — once every two weeks.
About the author