Average Email Click Through Rate by Industry (2026 Data)
What counts as a good email click-through rate in 2026? See fresh CTR benchmarks across 12 industries, why they differ, and the levers that actually move the number.
TL;DR
- The average email click through rate by industry in 2026 sits between roughly 1.4% and 4.5%, with most sectors landing near a 2.6% blended average.
- Click-through rate (CTR) measures clicks against all delivered emails; click-to-open rate (CTOR) measures clicks against opens — confusing the two wrecks your benchmarking.
- Hobbies, media, and education see the highest clicks; legal, finance, and restaurant emails see the lowest.
- List quality is the most underrated CTR lever: dead and mistyped addresses inflate your denominator and drag every percentage down.
- You improve CTR with one relevant CTA, segmented sends, mobile-first design, and a clean, verified list — not with more sending.
What is email click-through rate (CTR)?#
Click-through rate is the percentage of delivered emails that produced at least one link click. The formula is simple:
CTR = (unique clicks ÷ delivered emails) × 100
Think of it like a store flyer. Open rate is how many people glanced at the flyer; click-through rate is how many actually walked through the door because of it. A pile of flyers in mailboxes means nothing if no one acts — CTR is the metric that tells you the message did its job.
CTR matters more than open rate for one practical reason: Apple Mail Privacy Protection and similar features now pre-load images, which inflates open rates with phantom "opens." Clicks are a deliberate action, so they remain the most honest signal of whether your copy, offer, and audience actually line up.
)
What is the average email click through rate by industry in 2026?#
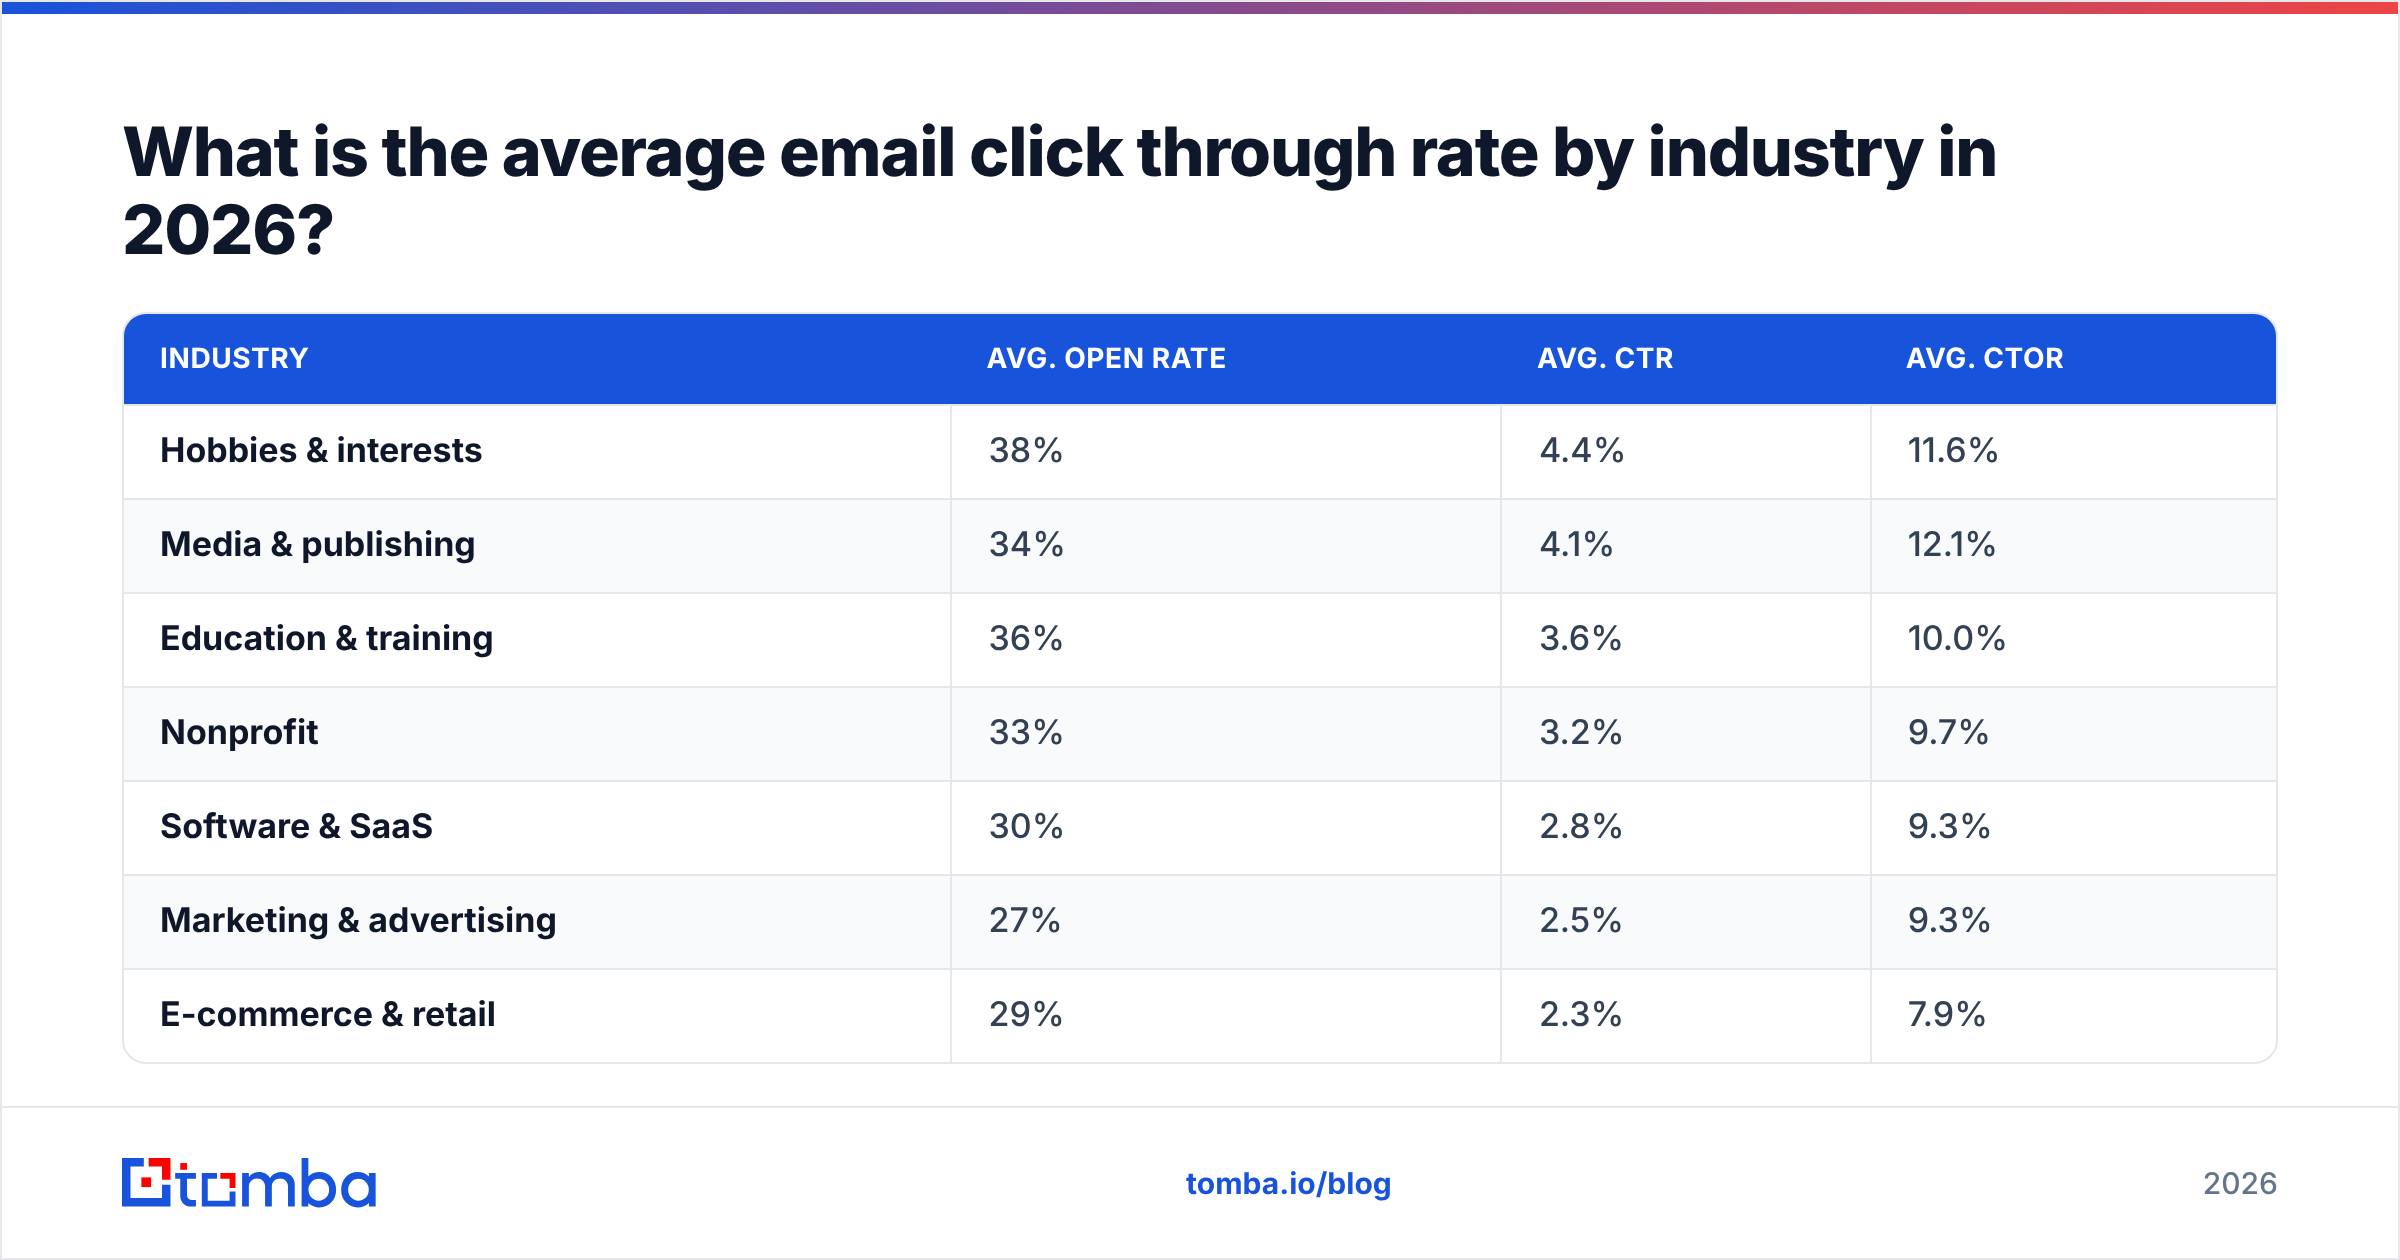
The short answer: a healthy CTR is 2–3% for most B2B and B2C senders, but the average email click through rate by industry varies by more than 3x depending on your sector. Below are blended 2026 benchmarks drawn from aggregated marketing-platform reporting. Treat them as a directional baseline, not a hard target — your segment, geography, and list age all shift the numbers.
| Industry | Avg. open rate | Avg. CTR | Avg. CTOR |
|---|---|---|---|
| Hobbies & interests | 38% | 4.4% | 11.6% |
| Media & publishing | 34% | 4.1% | 12.1% |
| Education & training | 36% | 3.6% | 10.0% |
| Nonprofit | 33% | 3.2% | 9.7% |
| Software & SaaS | 30% | 2.8% | 9.3% |
| Marketing & advertising | 27% | 2.5% | 9.3% |
| E-commerce & retail | 29% | 2.3% | 7.9% |
| Healthcare | 31% | 2.2% | 7.1% |
| Real estate | 28% | 1.9% | 6.8% |
| Finance & insurance | 30% | 1.7% | 5.7% |
| Restaurants & hospitality | 26% | 1.5% | 5.8% |
| Legal services | 27% | 1.4% | 5.2% |
A few patterns jump out. Sectors built around passion and discovery — hobbies, media, education — clear 3.5%+ because subscribers want the next thing to click. Highly regulated, low-frequency industries like legal and finance sit under 2%, partly because their emails are transactional or compliance-driven rather than exciting. If you want the textbook definition behind these numbers, see the email deliverability glossary entry, since deliverability sets the ceiling on every click metric.
CTR vs CTOR: what's the difference?#
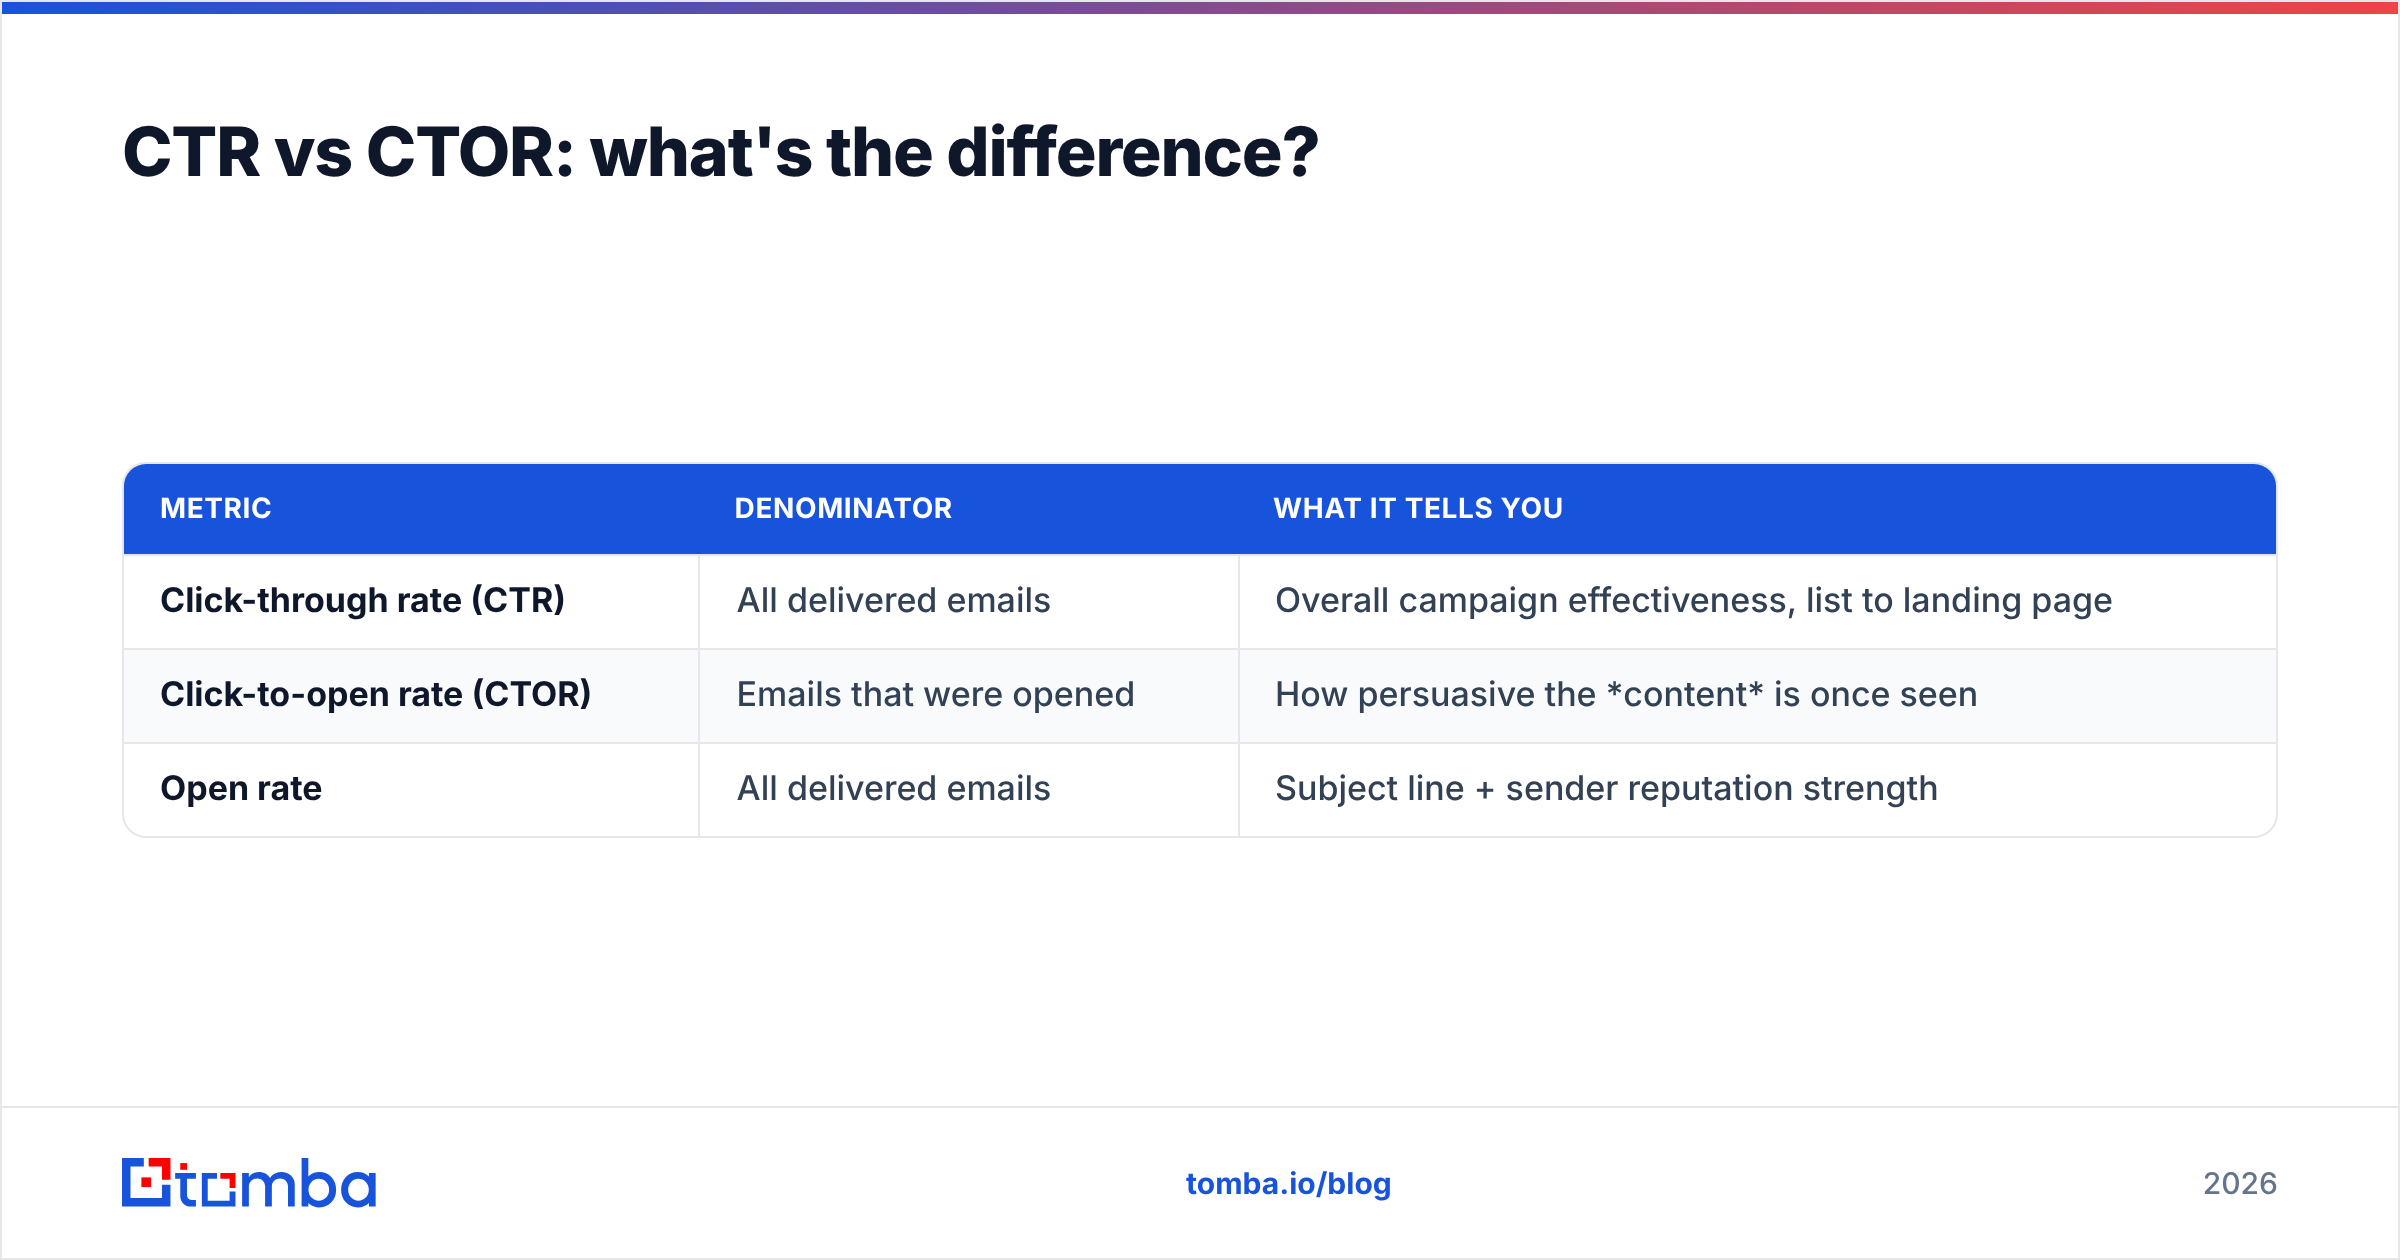
These two get mixed up constantly, and the confusion makes benchmarks meaningless. Here is the clean distinction:
| Metric | Denominator | What it tells you |
|---|---|---|
| Click-through rate (CTR) | All delivered emails | Overall campaign effectiveness, list to landing page |
| Click-to-open rate (CTOR) | Emails that were opened | How persuasive the content is once seen |
| Open rate | All delivered emails | Subject line + sender reputation strength |
If your CTR is low but your CTOR is healthy, your subject lines and deliverability are the bottleneck — people who open do click. If both are low, the message itself (offer, copy, CTA) needs work. Always confirm which number a benchmark report is quoting before you panic; a "3.5% click rate" might be CTR for one vendor and CTOR for another. For a deeper look at the related metric, the response rate definition is worth a read if you run outbound campaigns where replies, not clicks, are the goal.
Why does CTR vary so much between industries?#
Five structural factors explain most of the spread in the average email click through rate by industry:
- Purchase intent and frequency. A hobbyist who subscribed to a model-railway newsletter is primed to click. Someone on a law firm's quarterly update is not shopping — they are being informed. Intent drives clicks more than copy quality.
- List acquisition method. Double opt-in lists built from genuine interest outperform purchased or scraped lists by a wide margin. The acquisition channel is baked into the ceiling of your CTR.
- Email type. Triggered and transactional emails (order confirmations, password resets) routinely hit 5%+ CTR, while bulk newsletters average far less. Industry mix of these email types skews the averages.
- Send frequency and fatigue. Retail and restaurant lists get hit daily, so subscribers tune out. Lower-frequency sectors enjoy fresher attention per send.
- List hygiene. Every dead, mistyped, or abandoned address counts in your "delivered" denominator (or bounces and damages sender reputation), quietly dragging CTR down across the board.
That last factor is the one most teams ignore — and the one you can fix fastest.
How do you improve your email click-through rate?#
You do not raise CTR by sending more. You raise it by sending better to a cleaner list. Here are the highest-leverage moves, roughly in order of impact:
- Clean and verify your list first. Remove invalid, role-based, and risky addresses before every major send. A list that is 15% dead doesn't just waste sends — it caps your achievable CTR and erodes sender reputation. Run addresses through an email verifier so your denominator reflects real, reachable humans.
- Use one clear, relevant call to action. Multiple competing CTAs split attention. Pick the single most valuable next step and make it unmissable.
- Segment ruthlessly. A message tailored to behavior, lifecycle stage, or past purchases beats a blast to everyone. Segmented campaigns consistently double the CTR of non-segmented ones.
- Design mobile-first. More than half of opens happen on phones. Single-column layouts, tappable buttons (44px+), and short copy convert better on small screens.
- Test subject lines and preview text. These drive opens, and opens are the pool clicks come from. A free subject line generator helps you spin variants fast for A/B testing.
- Send at the right cadence. Re-engage dormant subscribers and suppress chronic non-openers. A smaller, engaged list almost always out-clicks a bloated one.
)
Does list quality really affect CTR that much?#
Yes — more than almost any copy tweak. Here is the math that gets overlooked.
Imagine two SaaS companies, each sending to 10,000 contacts and generating 250 genuine clicks.
- Company A has a clean, verified list. 9,500 emails are delivered. CTR = 250 ÷ 9,500 = 2.6% — right at the SaaS benchmark.
- Company B never verifies. 1,800 addresses are dead or invalid. Those bounce or land in spam folders, tanking deliverability, and the surviving inbox placement is weaker. Even if 250 people would have clicked, far fewer see the email, and CTR drops well below 2% while the sender reputation slides further with each send.
Same content. Same audience intent. The only variable is hygiene. This is why teams chasing benchmarks should start with their data, not their design. Building the list correctly in the first place matters too: pulling verified, role-appropriate contacts with a dependable email finder beats scraping and hoping.
If you want to see how the major platforms report these numbers, Mailchimp's email benchmarks and HubSpot's marketing statistics are two of the most widely cited public sources, and reviews on G2 can help you compare the verification tools that keep your list clean.
What is a "good" email click-through rate in 2026?#
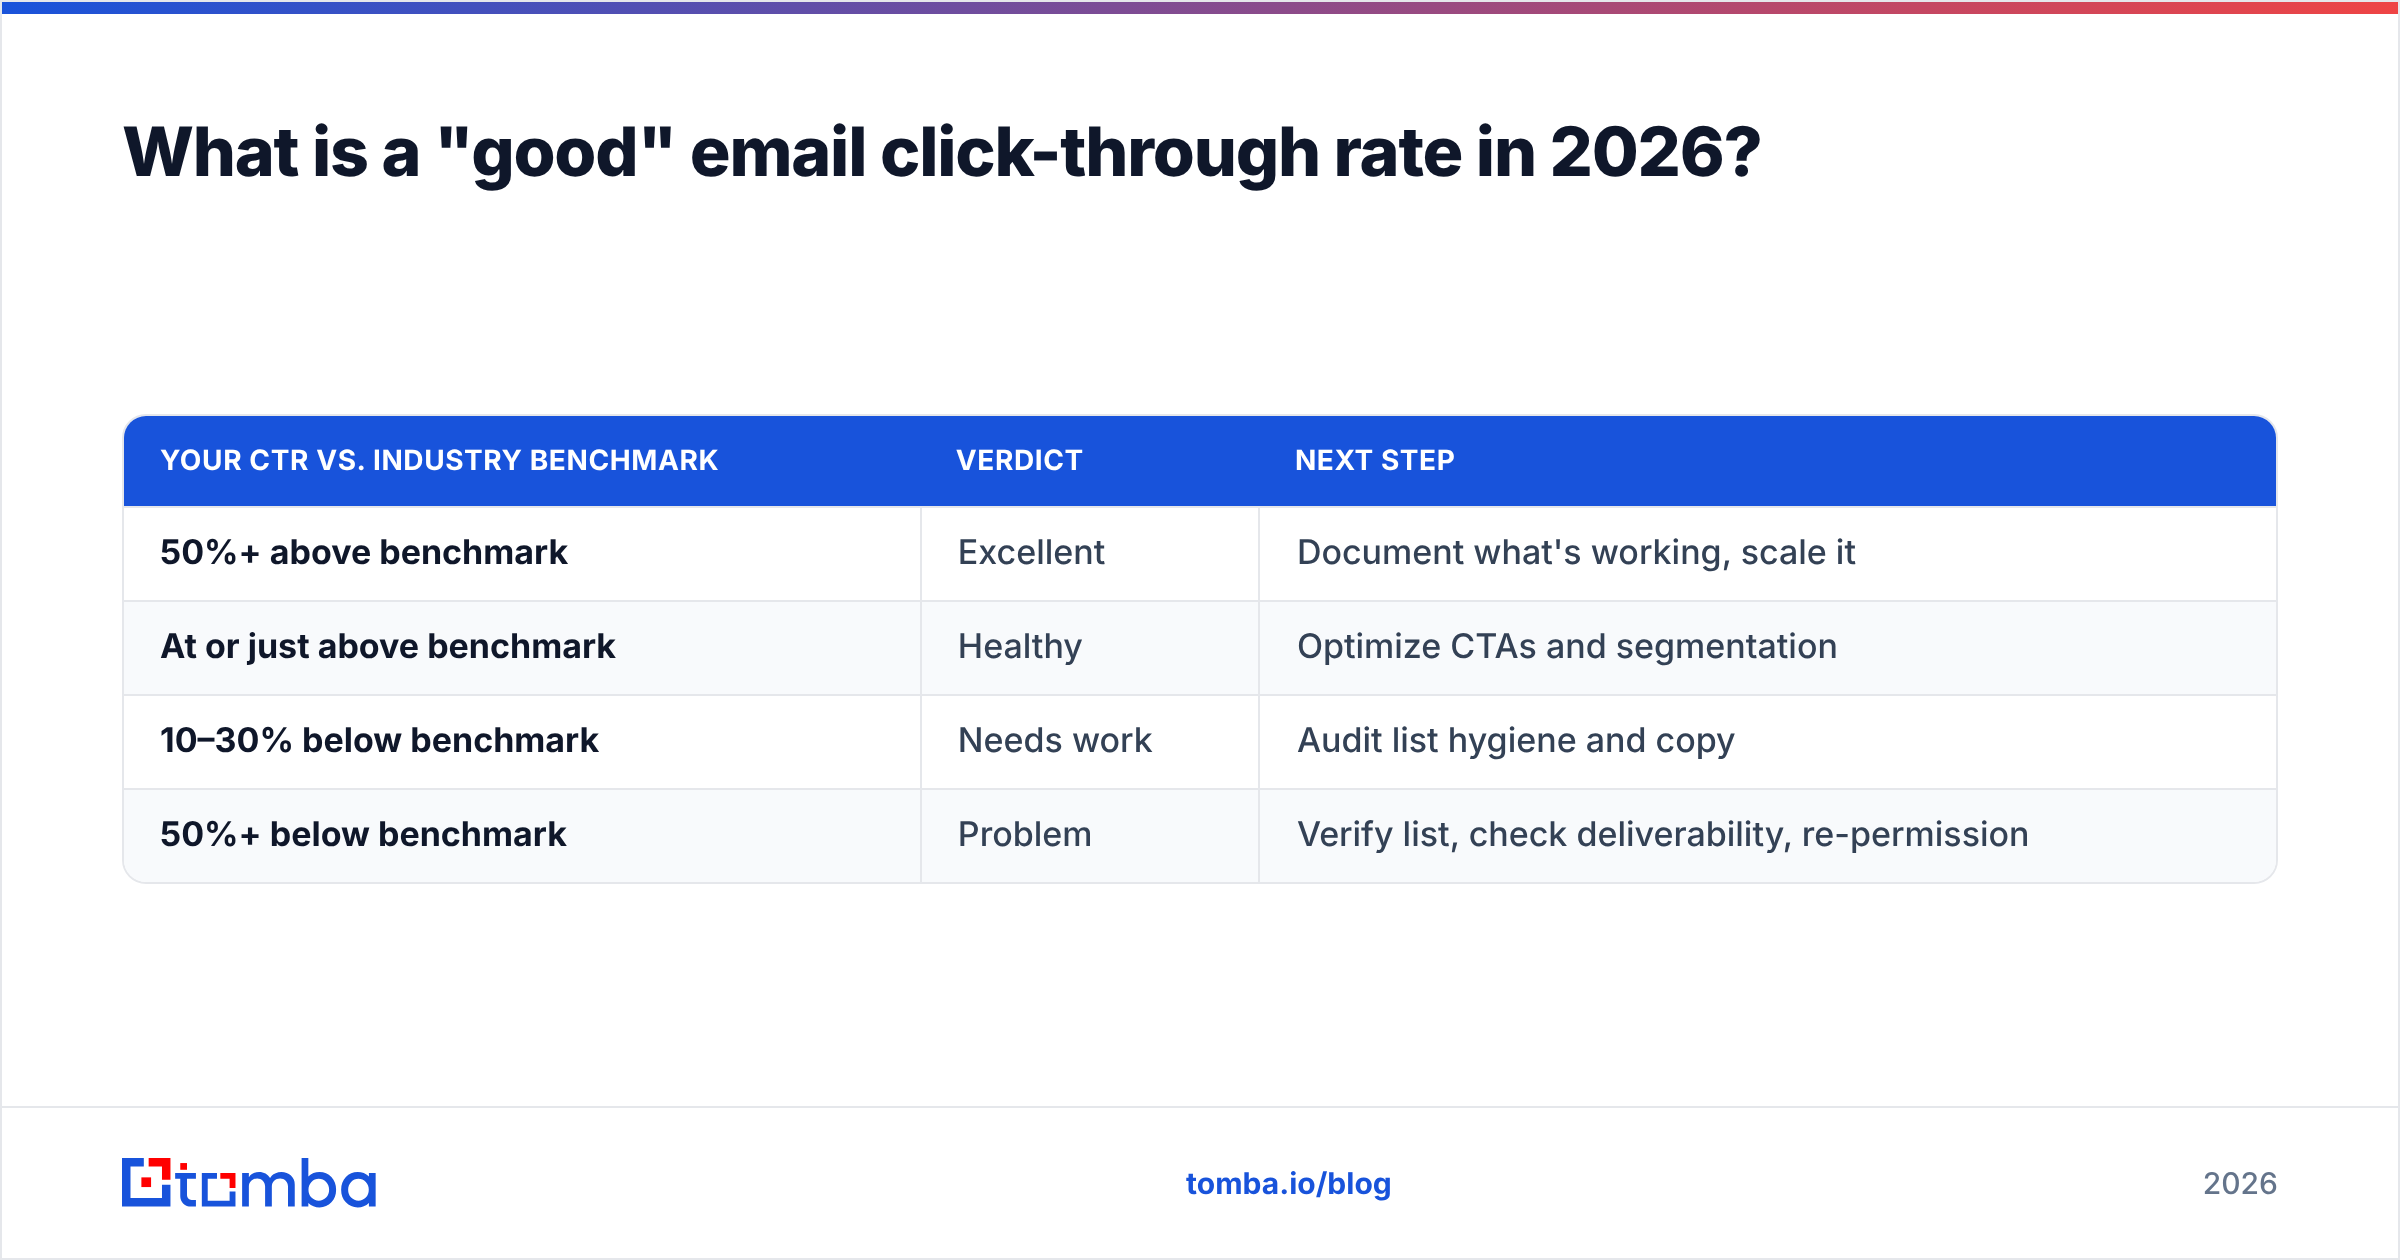
There is no universal "good" number — only good relative to your industry and your past performance. Use this quick rule of thumb:
| Your CTR vs. industry benchmark | Verdict | Next step |
|---|---|---|
| 50%+ above benchmark | Excellent | Document what's working, scale it |
| At or just above benchmark | Healthy | Optimize CTAs and segmentation |
| 10–30% below benchmark | Needs work | Audit list hygiene and copy |
| 50%+ below benchmark | Problem | Verify list, check deliverability, re-permission |
The most reliable way to climb the table is boring but effective: send relevant content to people who actually exist and actually opted in. Everything else — clever copy, animated GIFs, urgency timers — is a rounding error compared to data quality and relevance.
Frequently asked questions#
Is a 2% click-through rate good? For most industries, yes. A 2% CTR is at or near the blended average for B2B, SaaS, e-commerce, and finance. Hobbies, media, and education should aim higher (3.5%+).
Why is my CTR dropping over time? Usually list decay. B2B email lists degrade roughly 22–30% per year as people change jobs. Without periodic verification, your denominator fills with dead addresses and CTR slides even if your content stays strong.
Should I track CTR or CTOR? Track both. CTR tells you overall campaign performance; CTOR isolates how compelling your content is once opened. Watching them together pinpoints whether your problem is reach or persuasion.
How often should I clean my list? Verify before every large campaign, and run a full hygiene pass quarterly at minimum. High-volume senders benefit from monthly cleaning.
Start with a list that actually clicks#
Benchmarks only tell you where you stand. Moving up the table starts with the one input you fully control: the quality of the contacts you send to. Tomba's Email Finder helps you build accurate, verified B2B contact lists by name, company, or domain — so your "delivered" number reflects real, reachable people, and your CTR reflects real interest instead of inflated noise. Pair it with Tomba's verifier, check the Tomba pricing tiers (a free plan covers 25 searches per month to start), and stop letting bad data cap your click-through rate.
Ready to find emails that actually work?
Join 150,000+ professionals who stopped guessing and started sending. Free credits on signup — no credit card required.
Get the Tomba newsletter
Practical outbound tactics and product updates — once every two weeks.
About the author