Average Email Open Rate by Industry: 2026 Benchmarks
What counts as a good email open rate in 2026? Compare average open rates across 12 industries, see why Apple MPP inflated the numbers, and learn how to benchmark your own sends.
TL;DR
- The average email open rate across industries in 2026 sits around 34–42%, but the spread by vertical is enormous — government and education clear 45%, while retail and B2B SaaS often hover near 30%.
- Apple Mail Privacy Protection (MPP) permanently inflated reported open rates from late 2021 onward, so any "open rate" you see is now a soft signal, not ground truth.
- Benchmarks are only useful when you compare like-for-like: same industry, same list hygiene, same audience temperature (opt-in newsletter vs. cold outbound).
- The two biggest levers you actually control are list quality (verified, deliverable addresses) and subject-line relevance — not the time of day you send.
- Treat open rate as a directional health check. Optimize for replies, clicks, and conversions, which MPP cannot fake.
What is a "good" average email open rate by industry?#
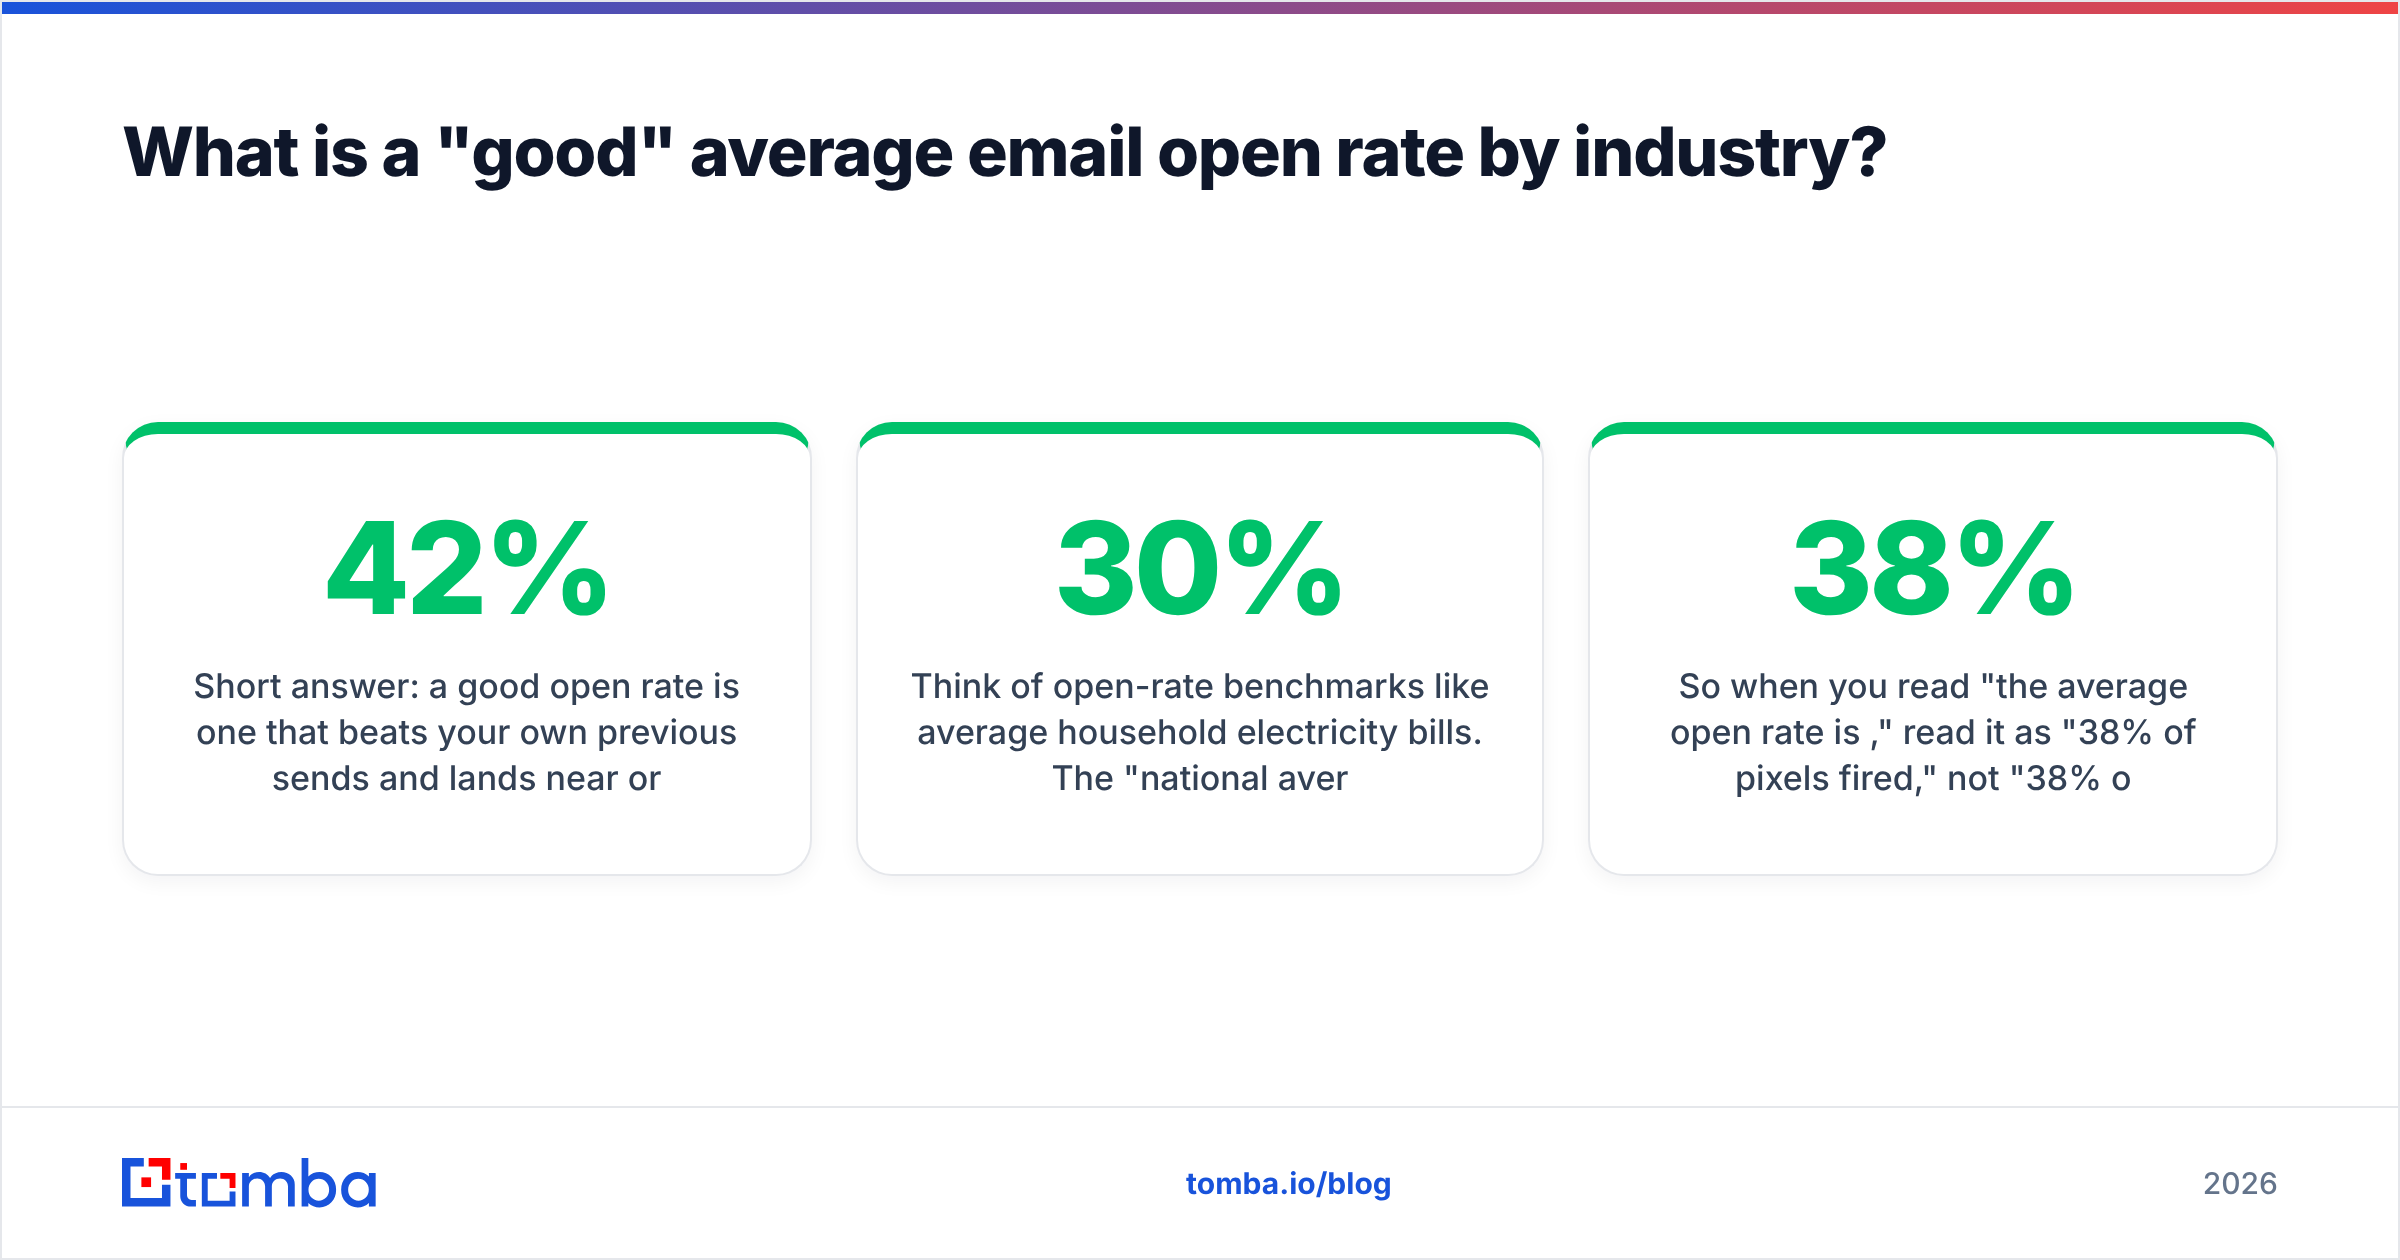
Short answer: a good open rate is one that beats your own previous sends and lands near or above your industry median — roughly 34–42% across all verticals in 2026, with healthy programs in education, nonprofits, and government pushing past 45%.
Think of open-rate benchmarks like average household electricity bills. The "national average" is almost useless on its own — a studio apartment and a five-bedroom house aren't comparable. What matters is whether your bill is normal for a home like yours. Same with email: a 30% open rate is mediocre for a government newsletter and excellent for a cold B2B prospecting sequence.
Two things reshaped these numbers in the last few years and you need both in your head before reading any table:
- Apple Mail Privacy Protection (MPP) pre-loads tracking pixels for Apple Mail users, registering an "open" whether or not the human ever read the message. Since Apple Mail commands a large share of opens, reported rates jumped industry-wide — by roughly 5–15 percentage points in many programs.
- Inbox-provider filtering got stricter. Gmail and Yahoo now enforce authentication and spam-rate thresholds for bulk senders, which means poor email deliverability quietly suppresses opens before a subject line ever gets a chance.
So when you read "the average open rate is 38%," read it as "38% of pixels fired," not "38% of humans read this."

What are the average email open rates by industry in 2026?#
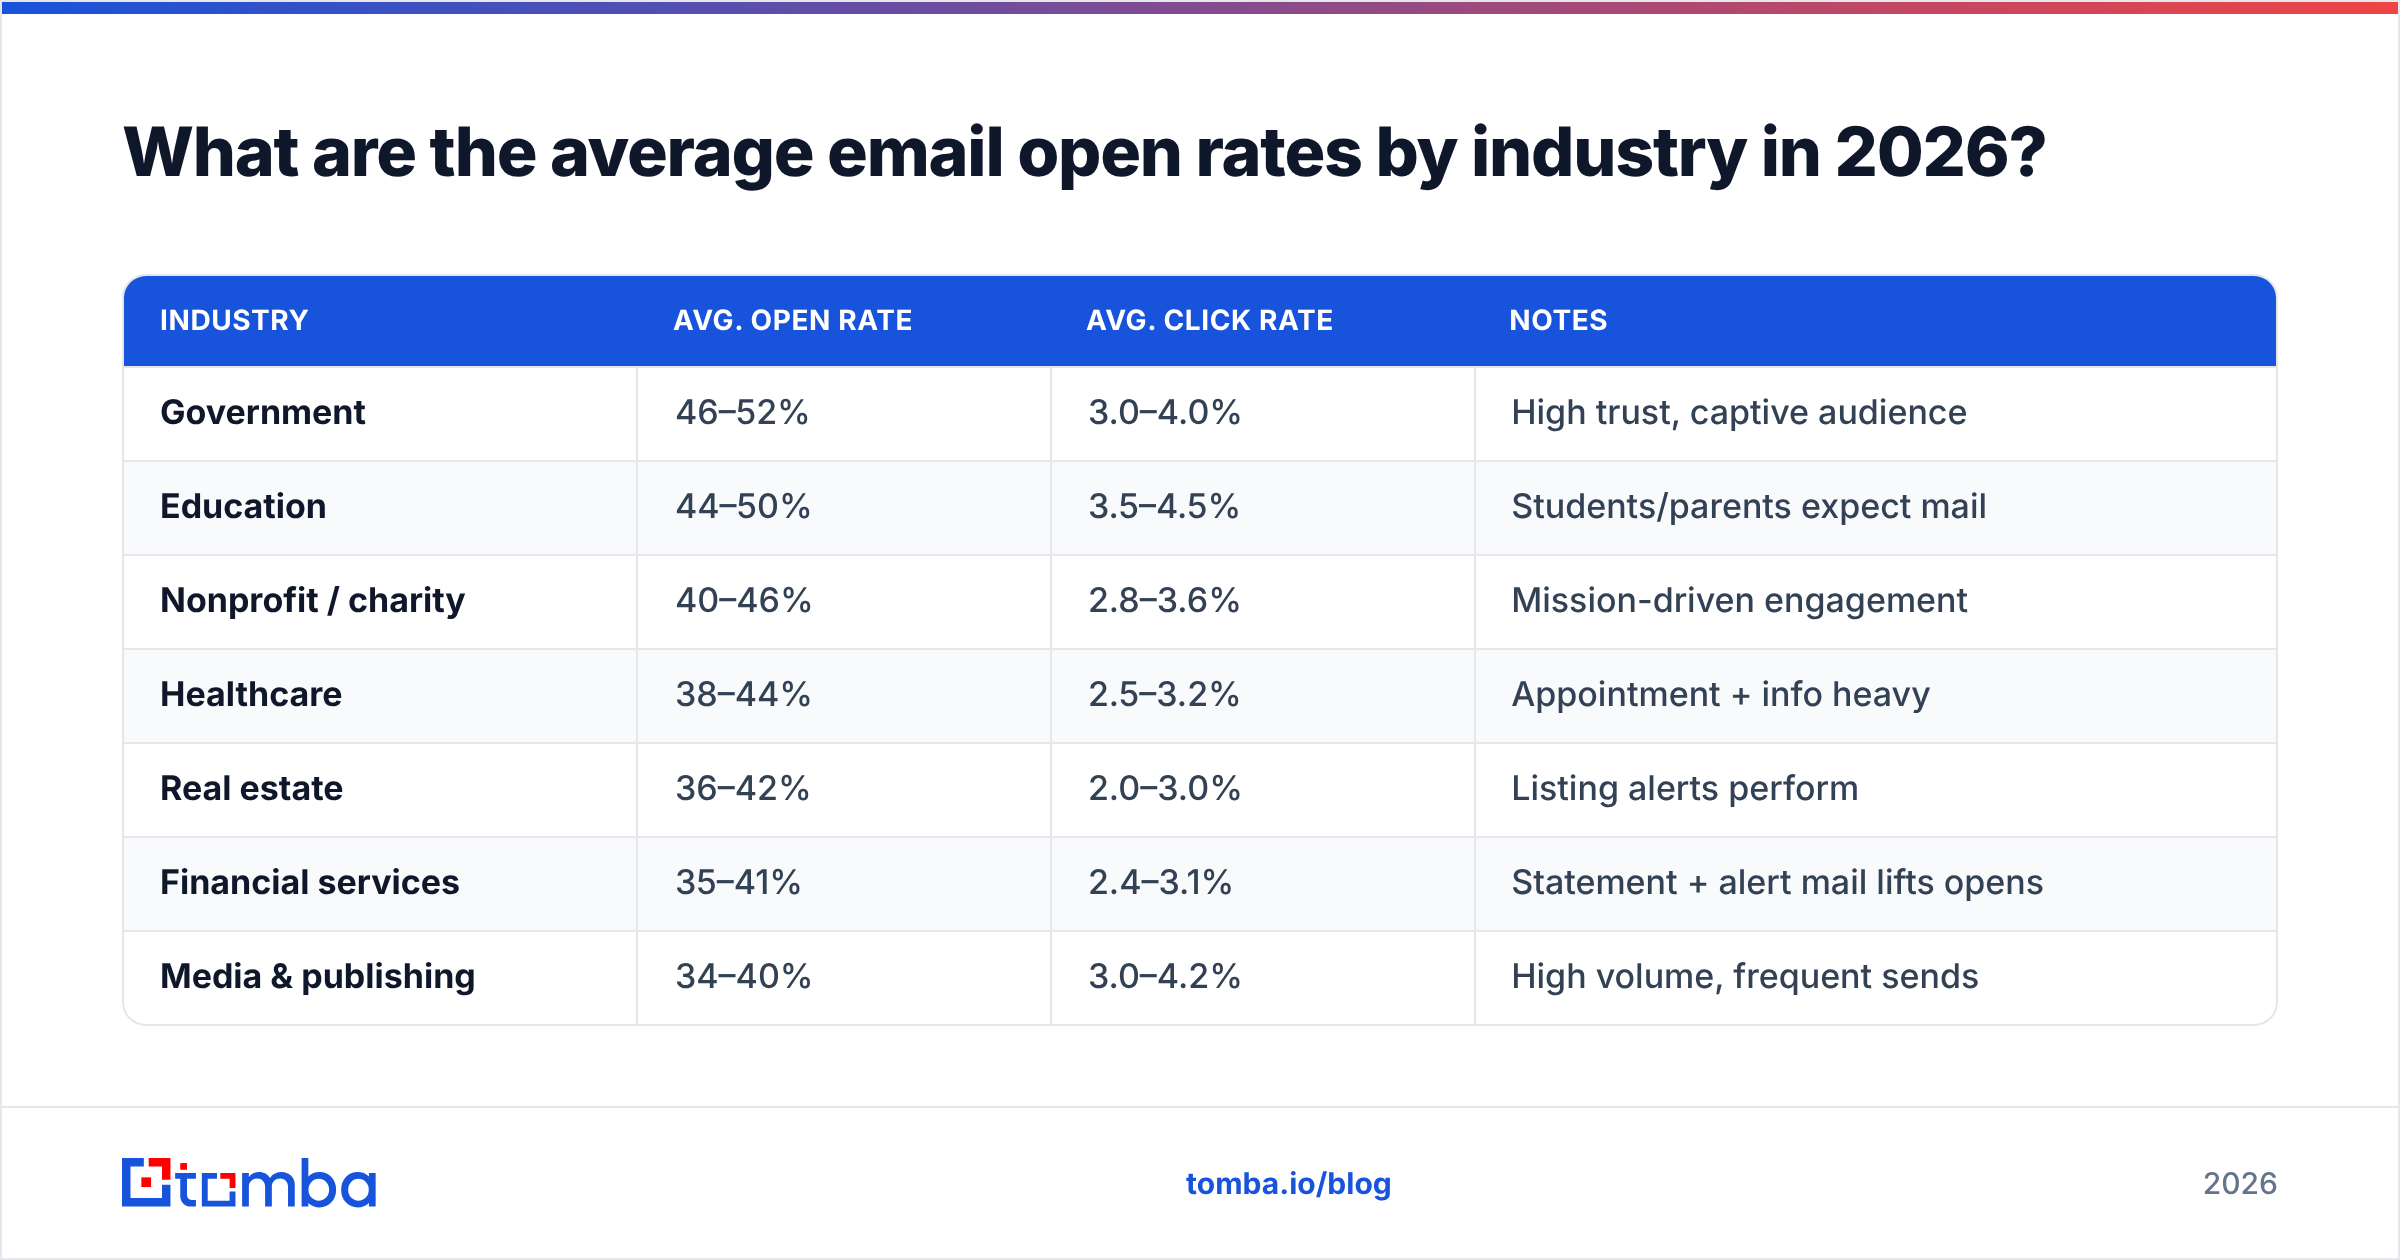
The table below blends post-MPP benchmark ranges reported by major ESPs (Mailchimp, HubSpot, and Campaign Monitor). Treat the numbers as directional medians, not guarantees.
| Industry | Avg. open rate | Avg. click rate | Notes |
|---|---|---|---|
| Government | 46–52% | 3.0–4.0% | High trust, captive audience |
| Education | 44–50% | 3.5–4.5% | Students/parents expect mail |
| Nonprofit / charity | 40–46% | 2.8–3.6% | Mission-driven engagement |
| Healthcare | 38–44% | 2.5–3.2% | Appointment + info heavy |
| Real estate | 36–42% | 2.0–3.0% | Listing alerts perform |
| Financial services | 35–41% | 2.4–3.1% | Statement + alert mail lifts opens |
| Media & publishing | 34–40% | 3.0–4.2% | High volume, frequent sends |
| Professional services | 33–39% | 2.2–2.9% | B2B, relationship-led |
| B2B SaaS / technology | 30–37% | 2.0–2.8% | Crowded inboxes, long cycles |
| Retail & e-commerce | 28–35% | 1.8–2.6% | Promo fatigue drags opens |
| Travel & hospitality | 29–36% | 2.0–3.0% | Seasonal spikes |
| Cold outbound (sales) | 25–45% | 1.0–5.0%+ reply | Wildly variable; list quality decides |
A few patterns worth naming:
- Transactional and expected mail wins. Government, education, and healthcare lead because recipients anticipate the message. Anticipation beats cleverness every time.
- Retail trails because of promotion fatigue. When every email is "50% OFF — TODAY ONLY," the brain learns to skip them.
- Cold outbound is its own universe. A tightly targeted, verified list with a relevant one-liner can clear 45%+, while a scraped, unverified blast lands in spam and reports single digits.
Why are open rates unreliable after Apple MPP?#
Open rate is now a fogged-up window, not a clear pane. Here is what changed and why it matters, in the order it affects your reporting:
- Pixel pre-fetching. Apple Mail loads the tracking pixel on its proxy servers before the user opens the message, so an "open" is logged regardless of human action.
- Inflated baselines. If your historical open rate jumped overnight in late 2021, that was MPP, not your copy. Comparing pre- and post-MPP numbers is comparing two different rulers.
- Lost open-time data. Geolocation and device/open-time signals from Apple users are masked or randomized, which breaks "best time to send" models built on open timestamps.
- Survivorship in segmentation. "Engaged opener" segments now quietly include bots and proxies, so suppression logic built purely on opens can keep dead addresses alive and prune real humans.
The practical takeaway: keep tracking opens for trend monitoring, but move your primary success metrics to clicks, replies, and conversions. Those require a real human action that a privacy proxy will not perform.
How do I calculate and benchmark my own open rate?#
The formula is simple; the discipline is in the denominator.
Open rate = (unique opens ÷ delivered emails) × 100
Note "delivered," not "sent." If you divide by emails sent, every bounce drags your rate down and you'll misread a list-hygiene problem as a content problem. To benchmark honestly:
- Segment before you average. A blended open rate across newsletters, onboarding, and cold outbound is a meaningless number. Report each stream separately.
- Compare to your own rolling 90-day median first, your industry second. You are your most relevant benchmark.
- Watch the deliverability denominator. A "low open rate" is frequently a delivery failure in disguise — mail sitting in spam never gets the chance to be opened. Check your sender reputation before you blame the subject line.
- Strip MPP noise where you can. Some ESPs now report "machine-filtered" opens separately. Use that view if available.
What actually moves the average email open rate?#
Three levers do most of the work, and they're rarely the ones people obsess over. (Spoiler: "best time to send" is the least important of the three.)
- List quality. A verified, permission-based list is the single biggest driver. Invalid addresses bounce, hammer your sender reputation, and suppress every future send — not just the current one. Run new lists through an email verifier before the first send, and re-verify quarterly.
- Sender reputation and authentication. SPF, DKIM, and DMARC are table stakes in 2026. Without them, Gmail and Yahoo throttle or junk your mail and your open rate craters regardless of content.
- Subject-line relevance. Not "clickbait" — relevance. A specific, recipient-aware line ("Re: your Q3 onboarding question") beats a clever-but-vague one. Test variants with a subject line tester before you commit a full send.
Secondary levers — send time, sender name, preview text, frequency — matter, but they're tuning a well-built engine, not the engine itself.

How does list quality change open rates by industry?#
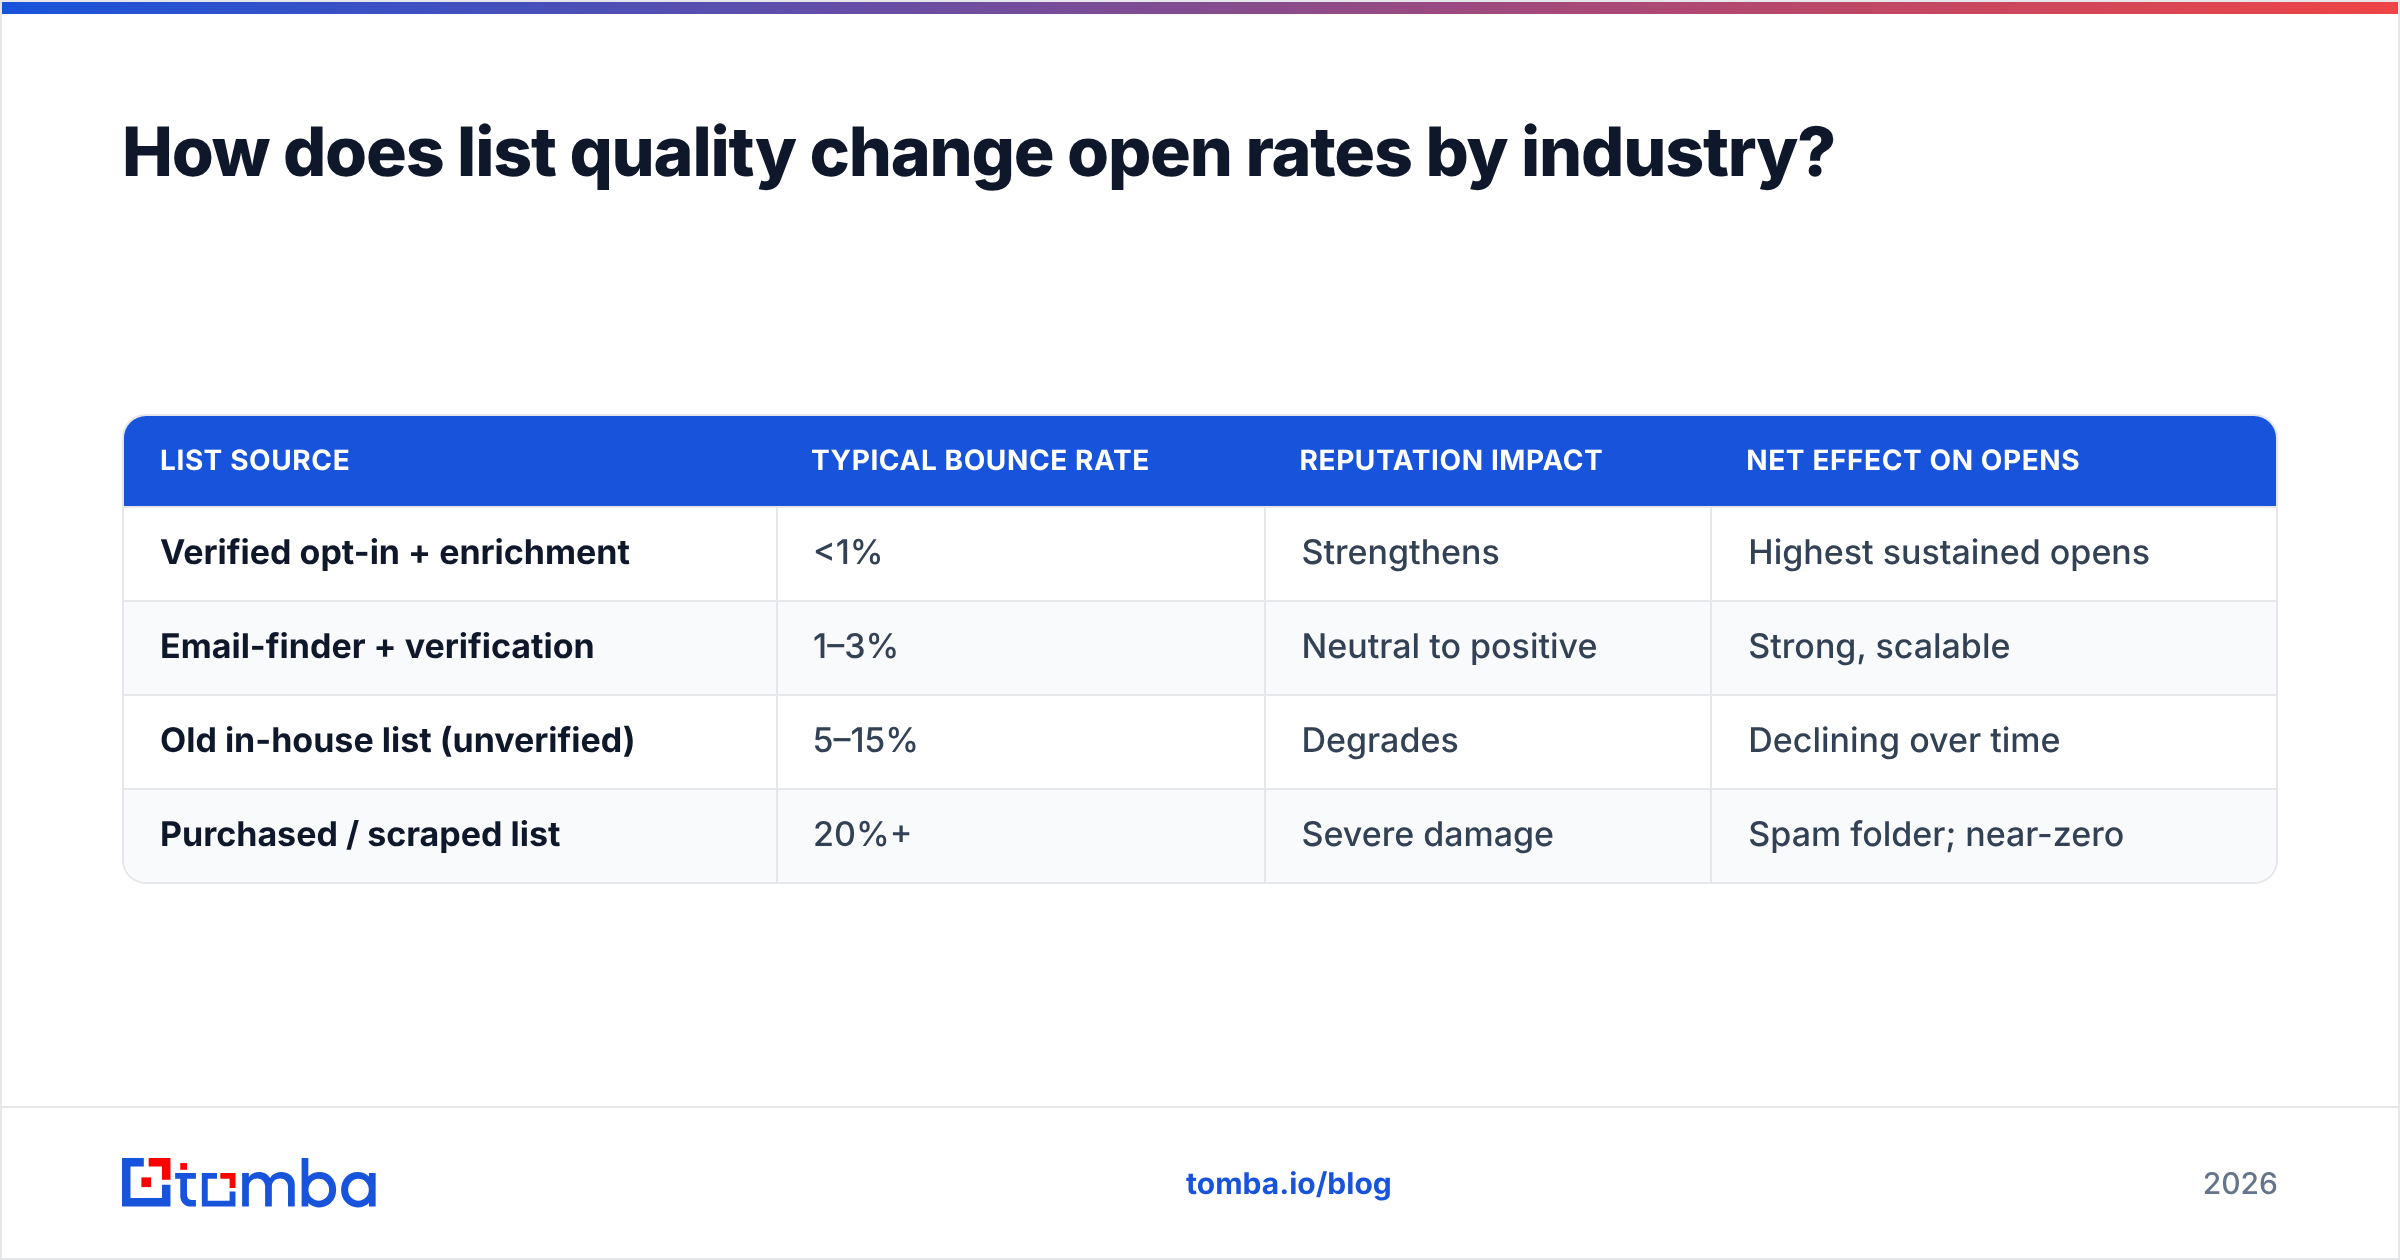
Dramatically — and it's the variable most teams ignore while fixating on copy. Here's the mechanism, step by step:
- Bounces poison reputation. Every hard bounce signals to mailbox providers that you don't maintain your list. Reputation drops, inbox placement falls, and your next campaign's open rate suffers even with perfect content.
- Spam traps amplify the damage. Old, scraped, or guessed addresses often contain recycled spam traps. Hitting them can blacklist your sending domain outright.
- Catch-all domains hide risk. Many B2B addresses sit on catch-all servers that accept everything, so a naive verifier marks them "valid." A dedicated catch-all verifier separates genuinely deliverable from risky catch-all addresses, which matters most in B2B SaaS and professional services where catch-alls are common.
This is why two companies in the same industry can post wildly different open rates. The one building lists from verified, first-party data and a quality email finder starts every campaign with a clean denominator. The one buying scraped lists is fighting reputation damage before the subject line is even read.
| List source | Typical bounce rate | Reputation impact | Net effect on opens |
|---|---|---|---|
| Verified opt-in + enrichment | <1% | Strengthens | Highest sustained opens |
| Email-finder + verification | 1–3% | Neutral to positive | Strong, scalable |
| Old in-house list (unverified) | 5–15% | Degrades | Declining over time |
| Purchased / scraped list | 20%+ | Severe damage | Spam folder; near-zero |
What benchmarks matter more than open rate?#
If open rate is a fogged window, these metrics are the clear glass. Track them with equal or greater weight:
- Click-through rate (CTR): real human intent; immune to MPP inflation.
- Click-to-open rate (CTOR): clicks ÷ opens — flawed now that opens are noisy, but still useful within a single non-Apple-heavy segment.
- Reply rate: the north star for outbound and relationship email. A human typed something back.
- Conversion rate: the only metric your CFO cares about. Opens don't pay invoices.
- Bounce and spam-complaint rates: leading indicators of deliverability collapse. Watch these to protect future opens.
- List growth vs. unsubscribe rate: is your audience compounding or eroding?
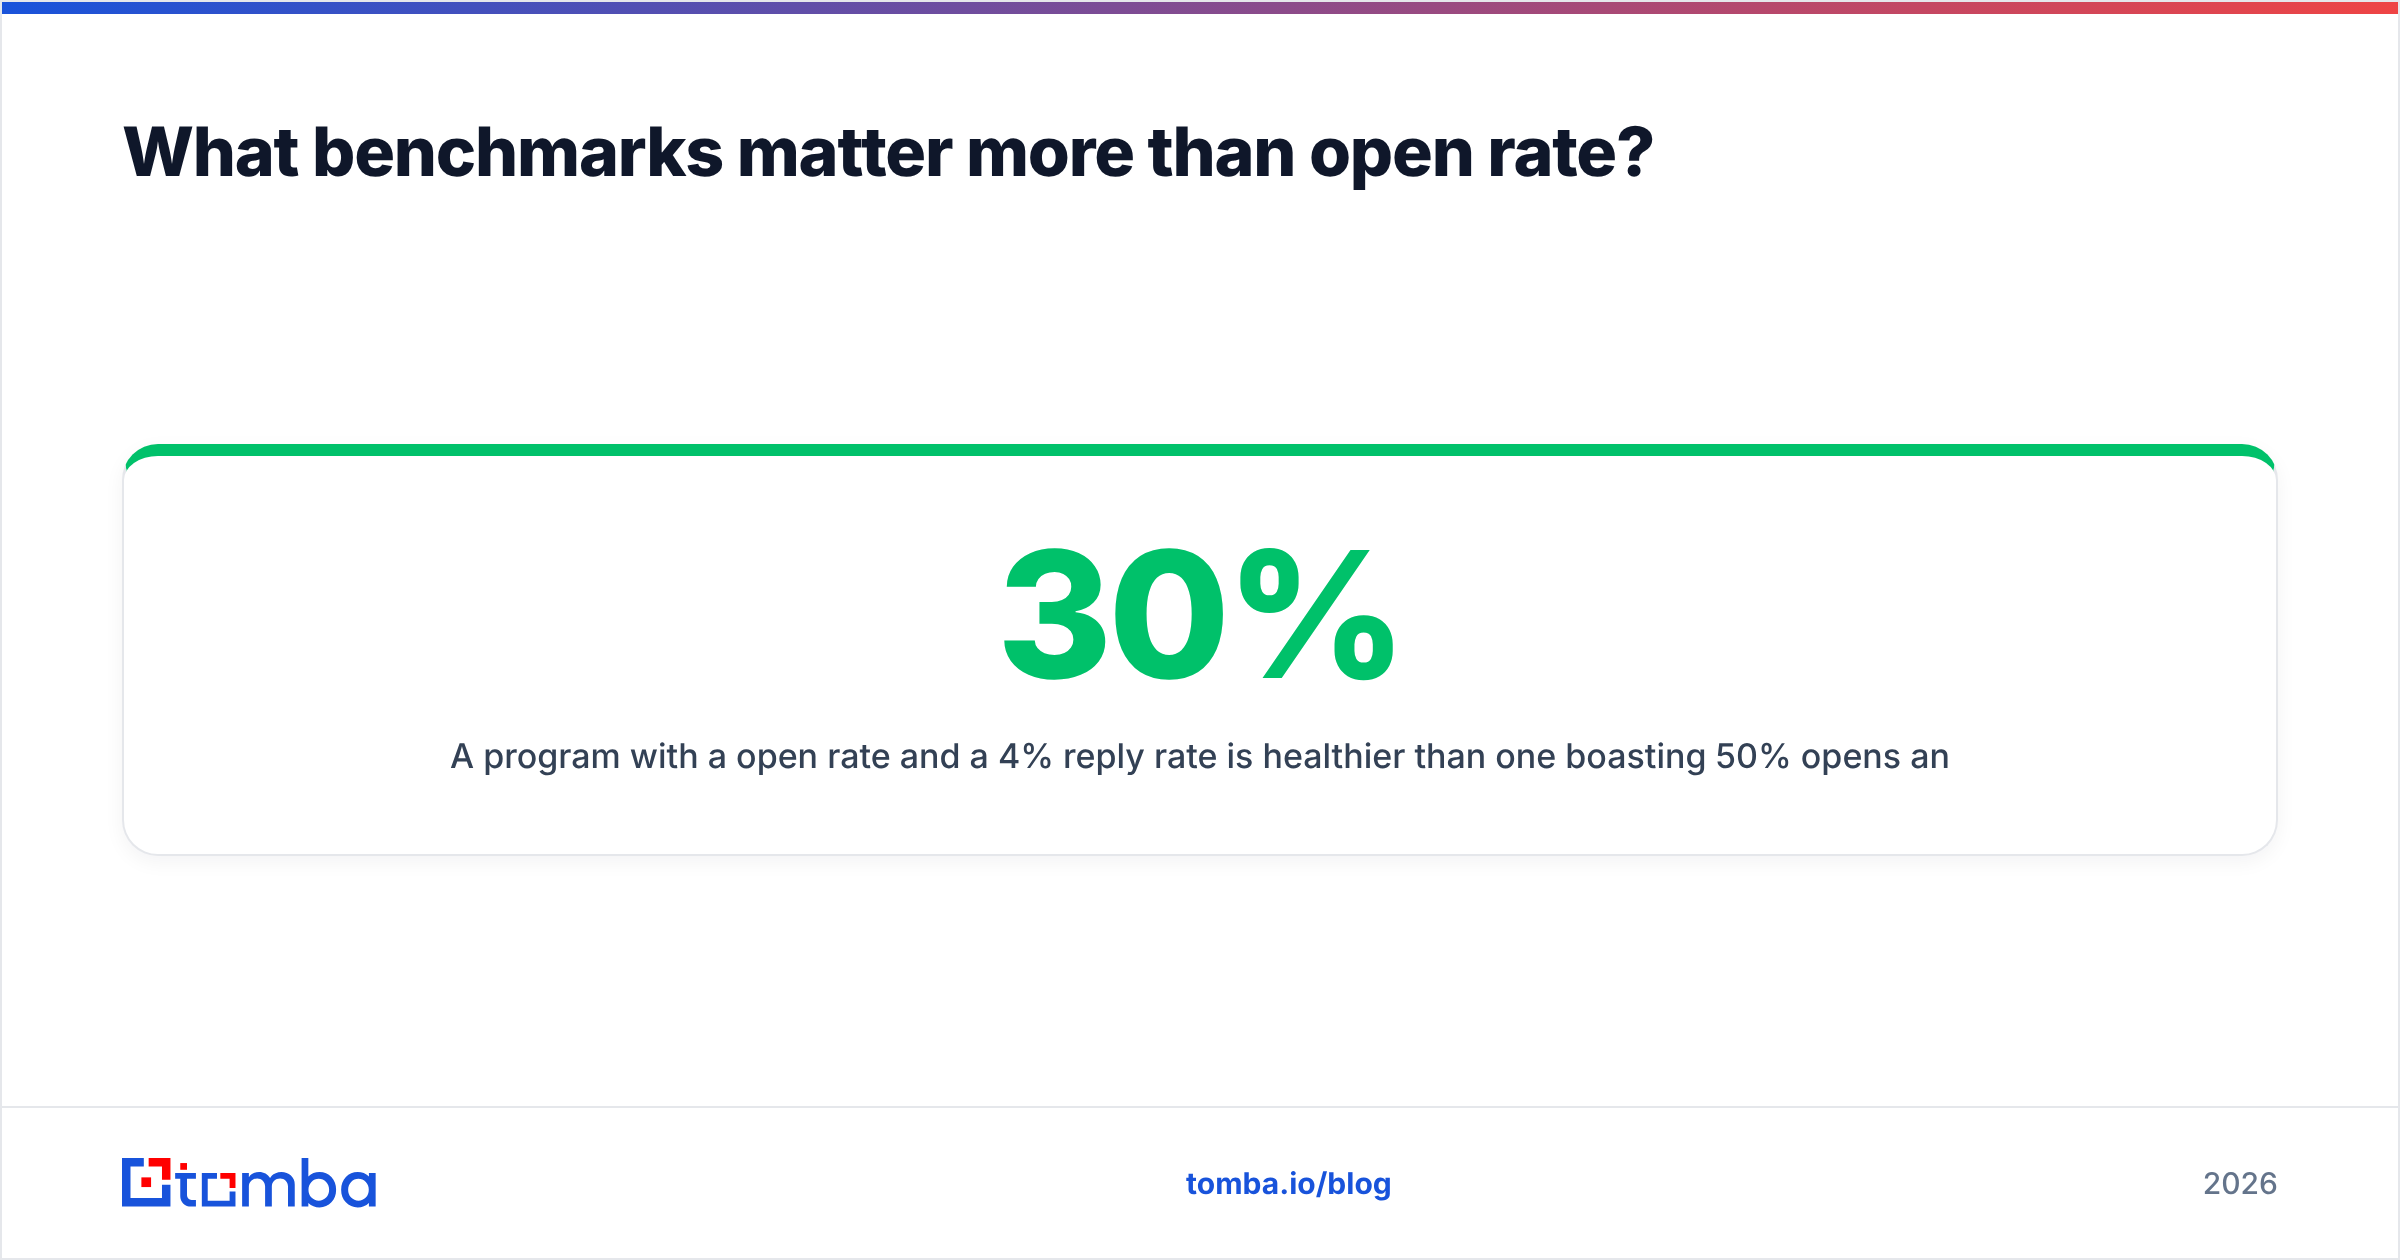
A program with a 30% open rate and a 4% reply rate is healthier than one boasting 50% opens and a 0.3% reply rate. The second is mostly counting proxies.
How do you raise open rates without gaming the metric?#
Build the fundamentals in this order — each step protects the next:
- Authenticate fully. Set SPF, DKIM, and DMARC. Confirm alignment. This is the floor.
- Verify the list. Remove invalids, risky catch-alls, and role accounts before sending. Re-verify on a schedule.
- Warm up new domains and IPs. Ramp volume gradually so providers learn to trust you. A warmup calculator gives you a realistic schedule instead of guesswork.
- Segment by engagement. Send your best content to your most engaged readers first; let providers see strong early signals.
- Write relevant subject lines. Specific, honest, recipient-aware. Test before you send.
- Prune the disengaged. Sunset addresses that haven't engaged in 6–12 months. A smaller, active list out-opens a bloated, dead one every time.
Notice that four of six steps are about deliverability and list health, not copy. That ratio reflects reality.
Frequently asked questions#
What is the average email open rate across all industries in 2026? Roughly 34–42% as reported by major ESPs, but this number is inflated by Apple MPP and varies heavily by vertical. Use your industry median, not the blended average.
Is a 20% open rate bad? For an opt-in newsletter, it's below average and worth investigating — usually a deliverability or list-hygiene issue. For some cold-outbound segments it can be acceptable if reply and conversion rates are strong.
Why did my open rate suddenly jump? Almost always Apple Mail Privacy Protection pre-loading pixels, not a real improvement in engagement. Verify against clicks and replies.
Does send time affect open rate? Marginally, and MPP has degraded the open-time data those models relied on. Fix list quality and authentication first; tune send time last.
The bottom line#
Benchmarks for the average email open rate by industry are a useful map, but they're drawn on fogged-up glass thanks to Apple MPP. Use them to spot whether you're roughly in range for your vertical, then steer by the metrics privacy proxies can't fake — clicks, replies, and conversions. And remember that the cheapest, highest-leverage fix is almost always upstream of your copy: a clean, verified list and a trusted sending domain.
If your open rates are sagging because your list is full of guesses and dead addresses, start at the source. Use the Tomba Email Finder to build prospect lists from verified, deliverable professional emails — and pair it with verification so every campaign begins with a clean denominator instead of a reputation problem. Check Tomba pricing to find the plan that fits your sending volume; the free tier lets you test list quality before you commit.
Ready to find emails that actually work?
Join 150,000+ professionals who stopped guessing and started sending. Free credits on signup — no credit card required.
Get the Tomba newsletter
Practical outbound tactics and product updates — once every two weeks.
About the author