Average Newsletter Open Rate (2022 Benchmarks vs 2026)
The average newsletter open rate in 2022 sat near 21-22% — but Apple's privacy changes broke the metric. Here's what the numbers really meant and how to read them in 2026.
TL;DR
- The average newsletter open rate in 2022 landed around 21–22% across industries, per Mailchimp and Campaign Monitor benchmark data.
- That number is not what it looks like. Apple's Mail Privacy Protection (launched late 2021) pre-loaded tracking pixels, inflating reported opens by 5–15 points for many senders.
- Open rate by industry varied widely: government and education cleared 28%+, while ecommerce and daily-deals sat closer to 15%.
- In 2026, open rate is a directional metric, not a precision one. Clicks, replies, and list hygiene matter more.
- The fastest way to move your real open rate is a clean, verified list — bounces and spam traps quietly destroy deliverability before anyone opens anything.
What was the average newsletter open rate in 2022?#
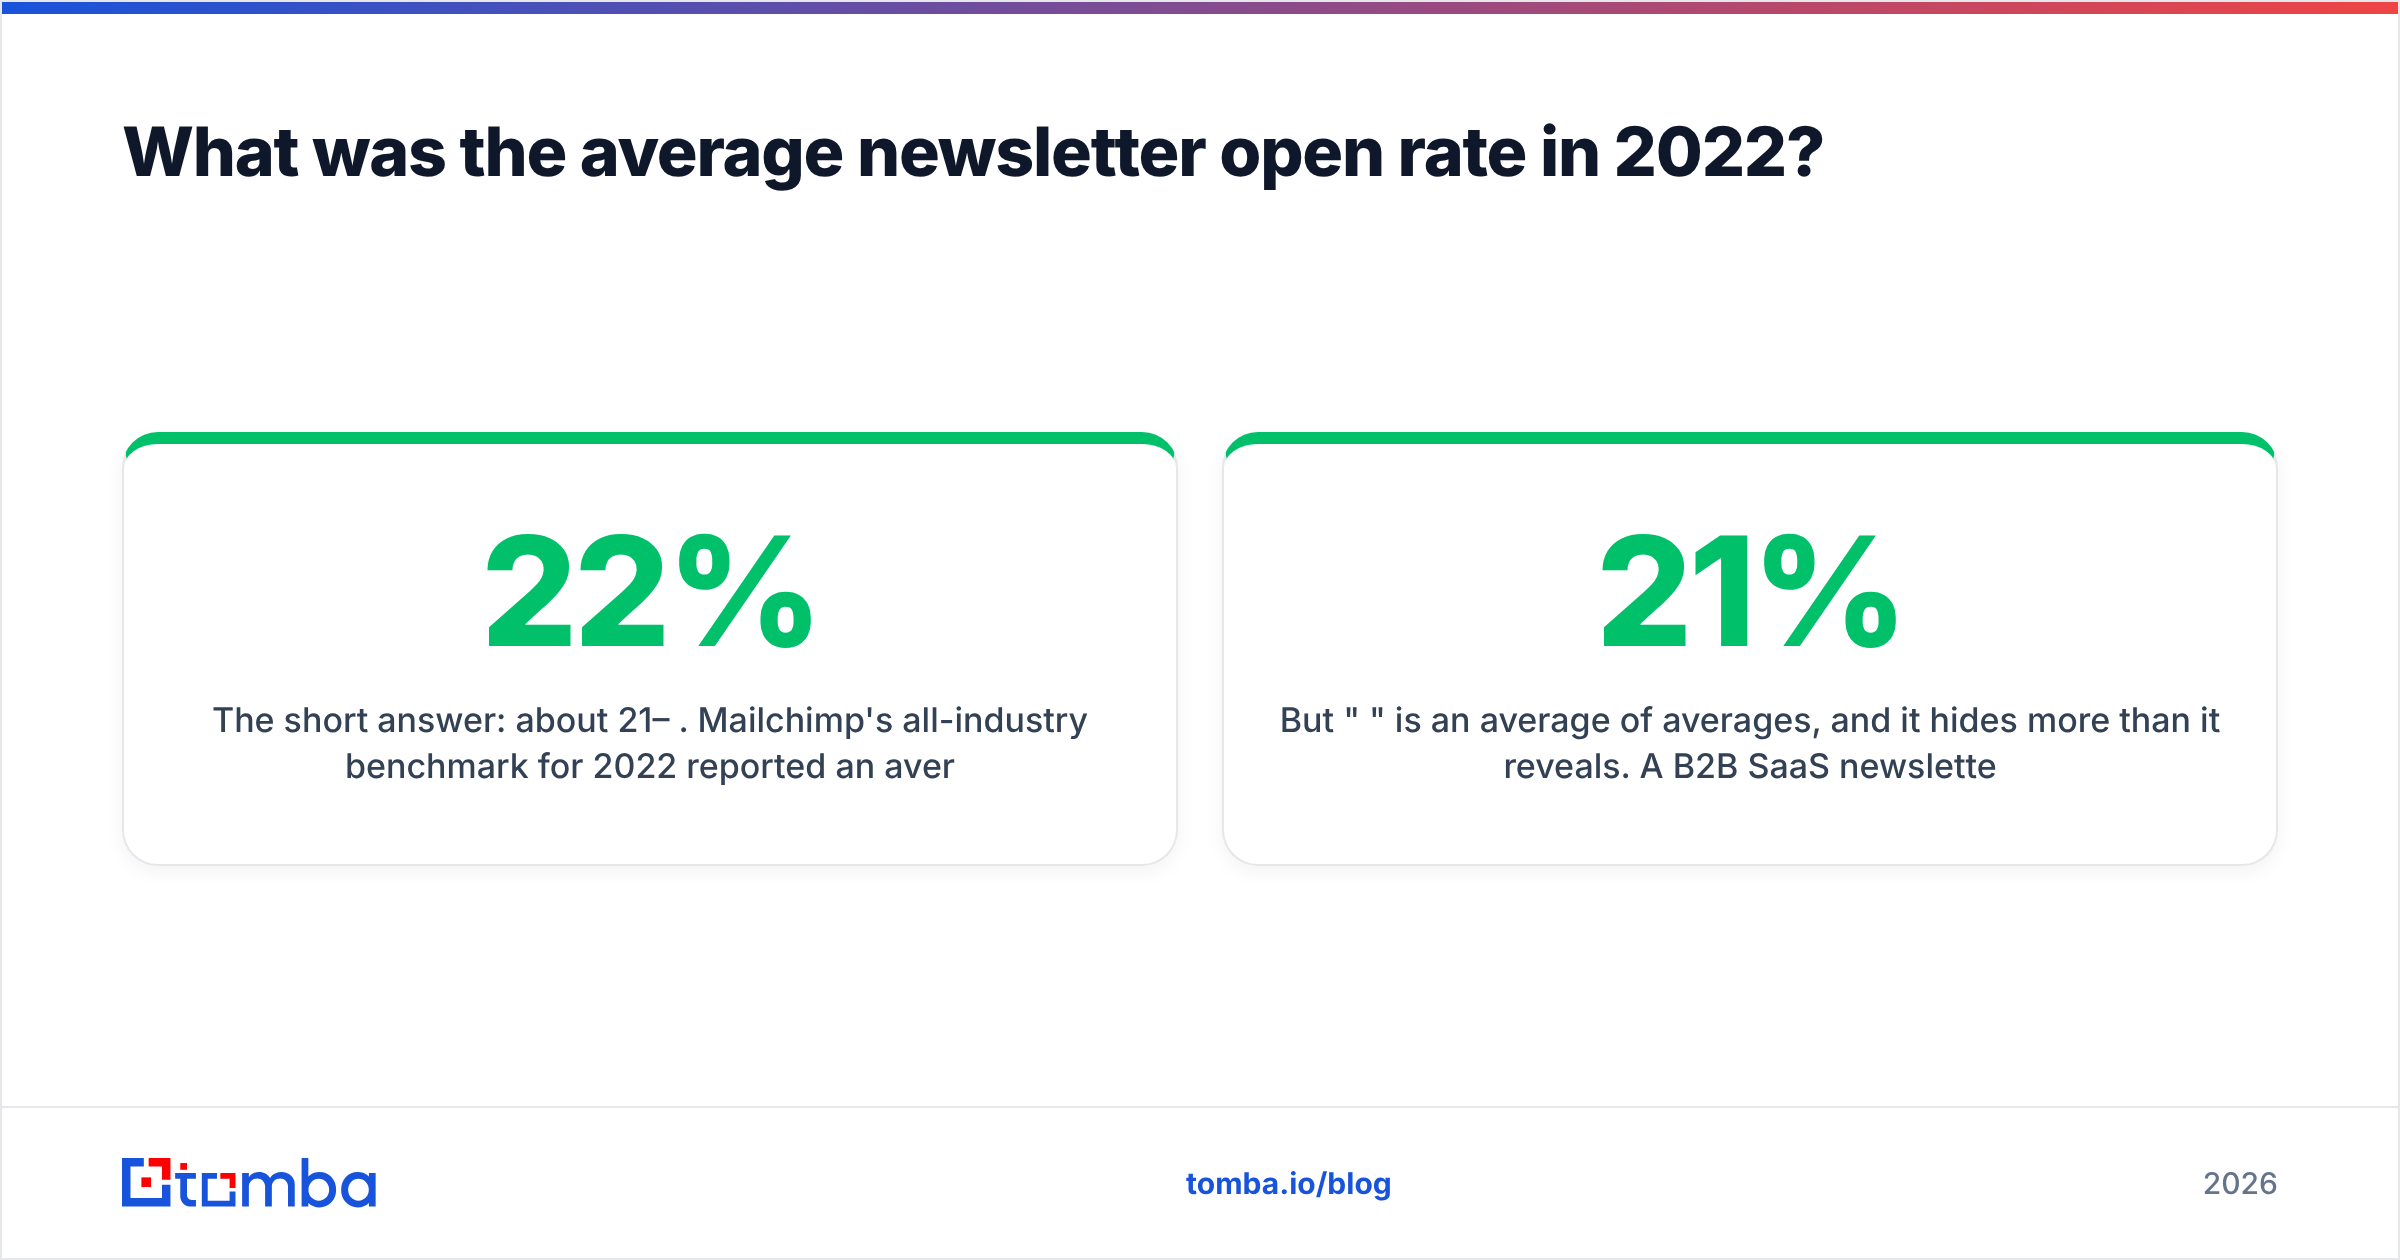
The short answer: about 21–22%. Mailchimp's all-industry benchmark for 2022 reported an average open rate near 21.3%, and Campaign Monitor's data clustered in the same range. Constant Contact and HubSpot reported slightly higher figures depending on how they sampled and how they treated Apple-driven opens.
But "21%" is an average of averages, and it hides more than it reveals. A B2B SaaS newsletter, a nonprofit donor update, and a flash-sale retailer have almost nothing in common in how their audiences behave. Lumping them together gives you a number that's true and useless at the same time.
Think of it like average household income. Knowing the national figure tells you nothing about whether your salary is good — you need your city, your industry, and your role. Open rate is the same: the benchmark only means something once you slice it.
What was the average open rate by industry in 2022?#
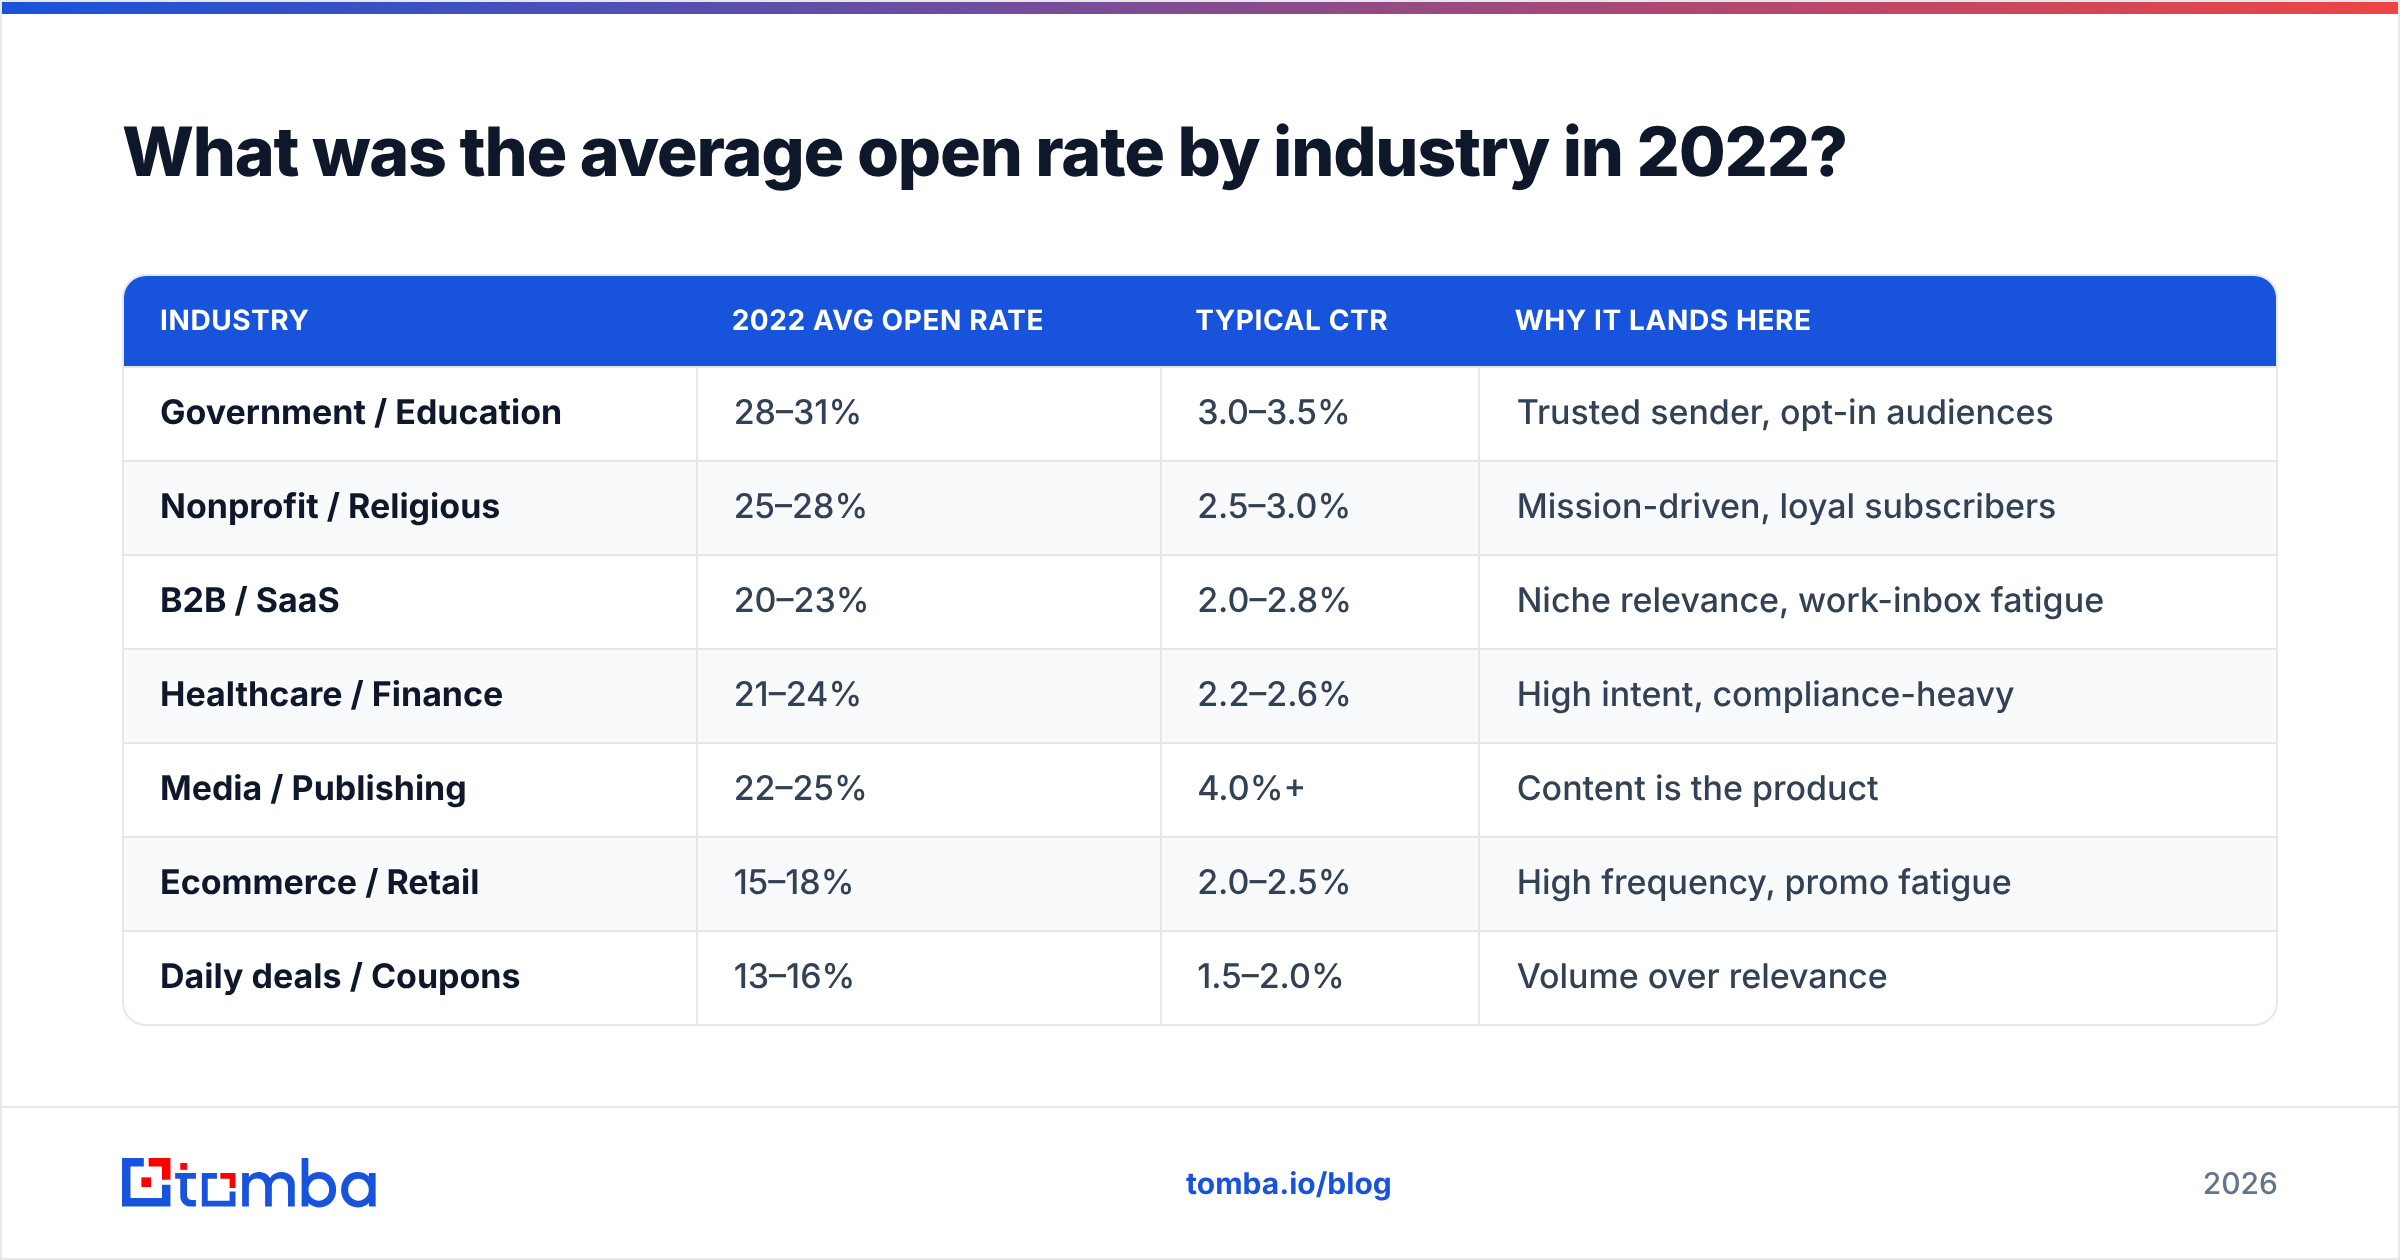
Here's where the benchmark becomes useful. The spread between the top and bottom industries was roughly double — government newsletters were opened more than twice as often as daily-deal blasts.
| Industry | 2022 avg open rate | Typical CTR | Why it lands here |
|---|---|---|---|
| Government / Education | 28–31% | 3.0–3.5% | Trusted sender, opt-in audiences |
| Nonprofit / Religious | 25–28% | 2.5–3.0% | Mission-driven, loyal subscribers |
| B2B / SaaS | 20–23% | 2.0–2.8% | Niche relevance, work-inbox fatigue |
| Healthcare / Finance | 21–24% | 2.2–2.6% | High intent, compliance-heavy |
| Media / Publishing | 22–25% | 4.0%+ | Content is the product |
| Ecommerce / Retail | 15–18% | 2.0–2.5% | High frequency, promo fatigue |
| Daily deals / Coupons | 13–16% | 1.5–2.0% | Volume over relevance |
Two patterns jump out. First, trust and relevance beat volume every time — the senders people expect to hear from win. Second, a high open rate doesn't guarantee a high click rate. Media newsletters were opened less than government ones but clicked far more, because the open was the goal.
If your number is below your industry band, the problem is usually one of three things: list quality, subject lines, or sender reputation. We'll get to all three.
Why is the 2022 average open rate misleading?#
Because Apple changed the rules in September 2021, and 2022 was the first full year of the fallout.
Apple's Mail Privacy Protection (MPP) pre-fetches email content — including the invisible tracking pixel that email tools use to count an "open" — for users who enable it in Apple Mail. The result: an "open" gets logged whether or not a human ever looked at the message.
Since Apple Mail accounts for a large share of email opens, this artificially inflated open rates across nearly every newsletter in 2022. Many senders saw their reported open rate jump 5 to 15 percentage points overnight with no change in actual reader behavior.
So when you read "the average newsletter open rate was 22% in 2022," part of that number is robots, not readers. This is exactly why the email industry has spent the years since shifting toward metrics that can't be faked by a pre-fetch:
- Click-through rate (CTR) — a real human had to tap a real link.
- Click-to-open rate (CTOR) — clicks divided by opens, which partially normalizes the MPP noise.
- Reply rate — the gold standard for relationship-driven and cold email.
- Conversion rate — did the email drive the outcome you actually care about?
- List health signals — bounce rate, spam complaints, and unsubscribes, which predict whether you'll even reach the inbox next time.
If you only track opens, you're optimizing a number that Apple partly controls. Read more on the mechanics in our guide to email deliverability.
What is a good newsletter open rate in 2026?#
A good open rate today is "above your industry band and trending up" — the absolute number matters less than the trend on a clean list.
For most senders in 2026, a healthy reported open rate sits in the 25–40% range, higher than 2022 figures precisely because MPP inflation is now baked into the baseline. That's why you can't compare a 2026 dashboard number against a 2022 benchmark and conclude you're improving — the measurement floor moved.
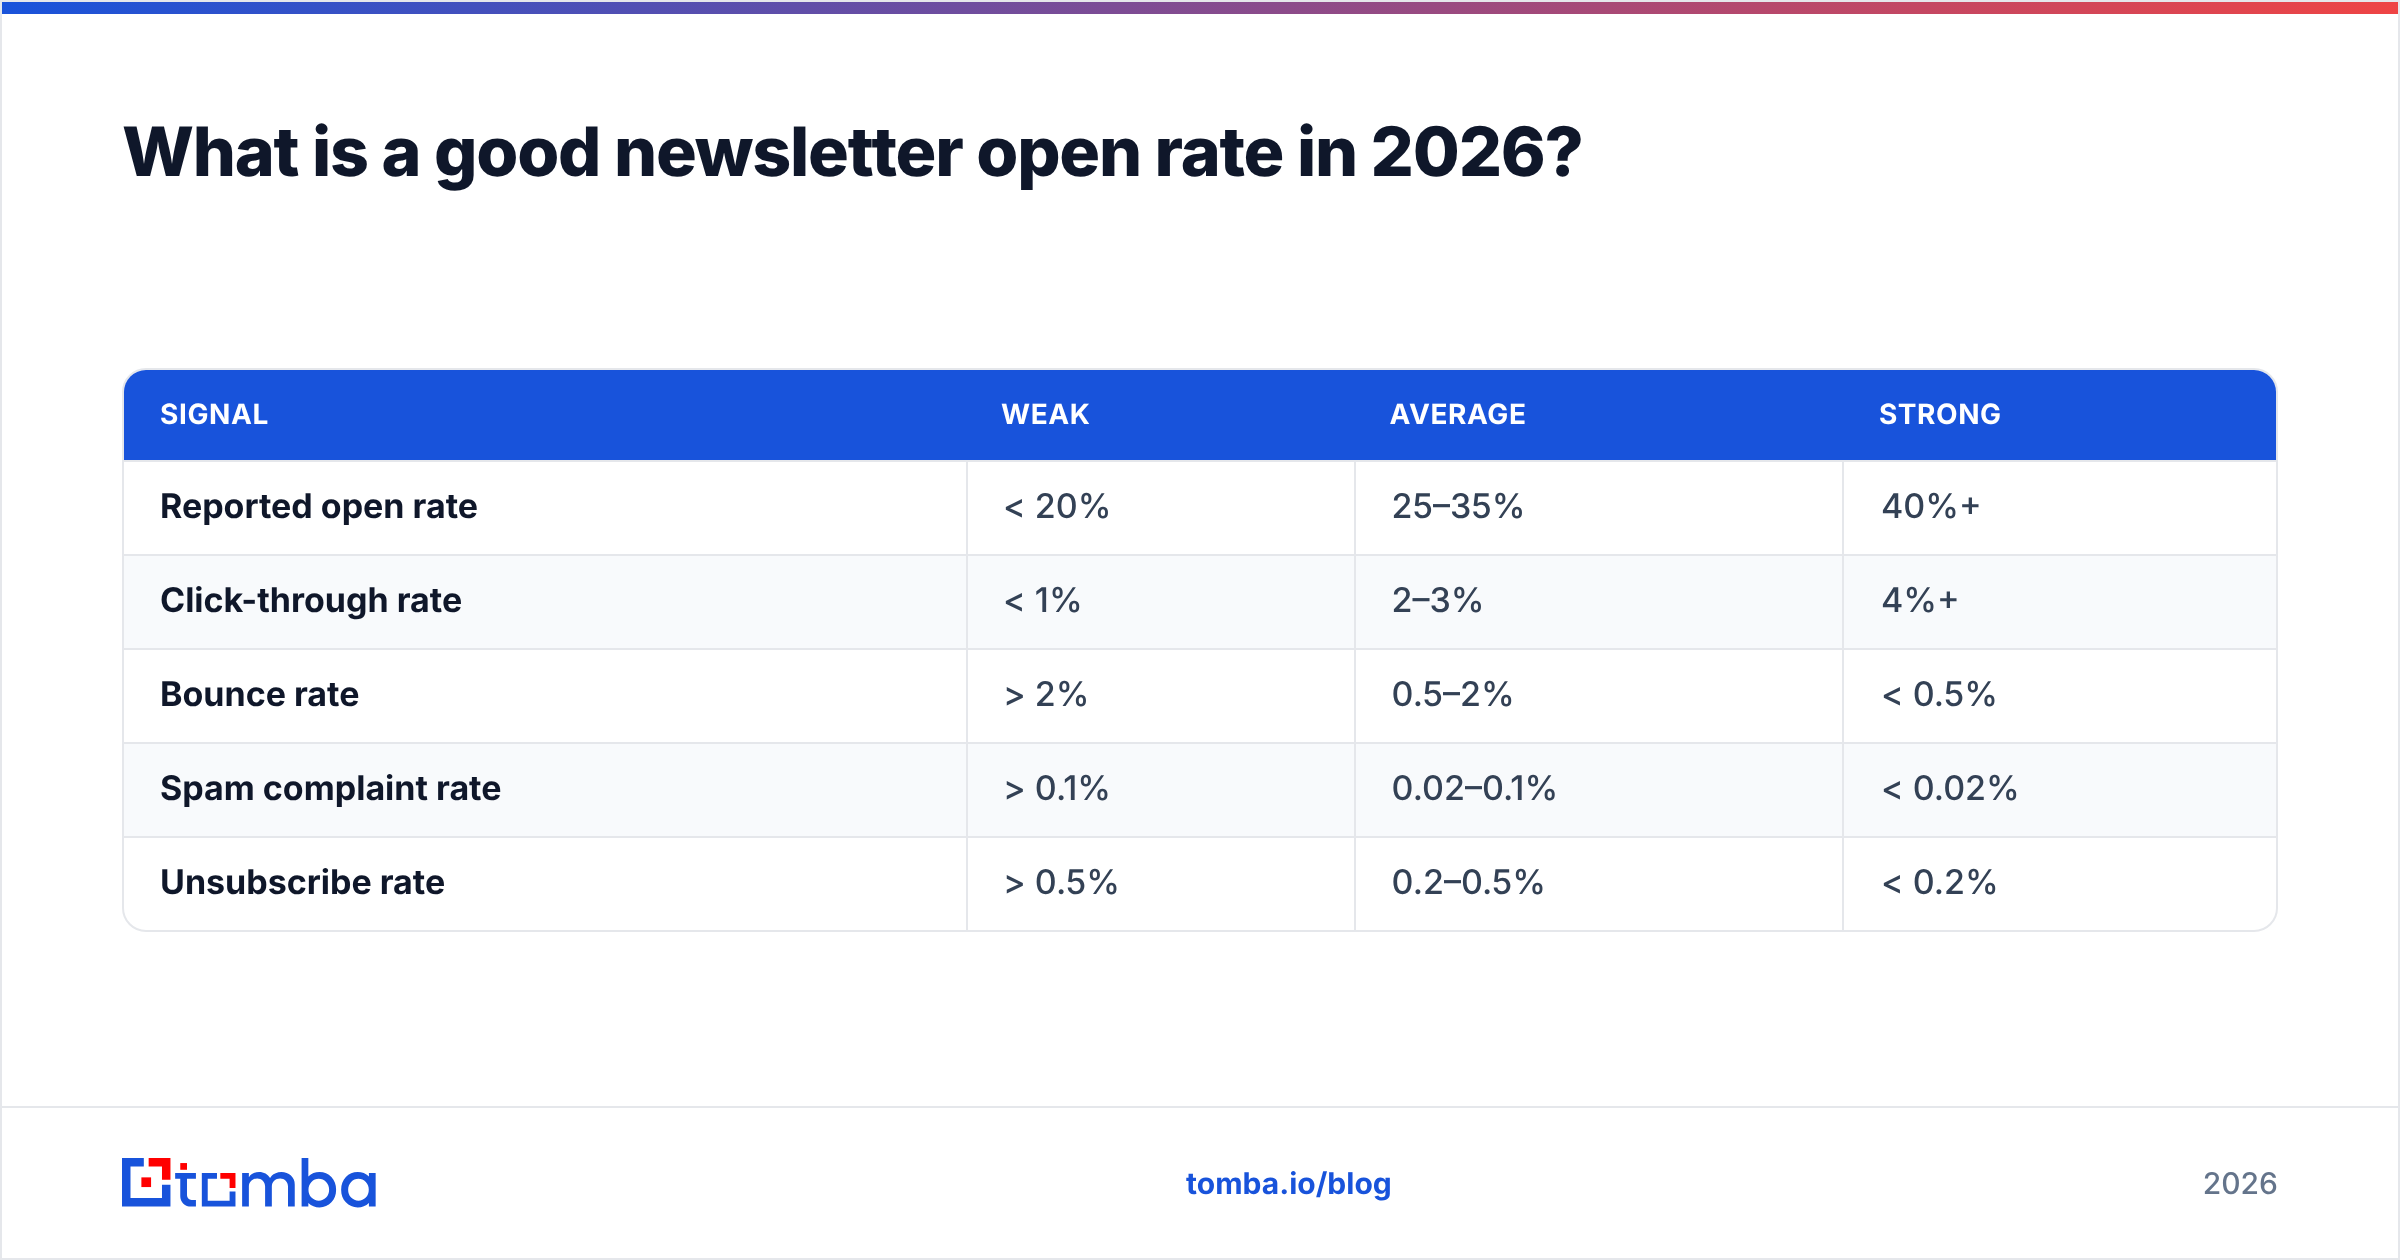
Here's how to read your own number honestly:
| Signal | Weak | Average | Strong |
|---|---|---|---|
| Reported open rate | < 20% | 25–35% | 40%+ |
| Click-through rate | < 1% | 2–3% | 4%+ |
| Bounce rate | > 2% | 0.5–2% | < 0.5% |
| Spam complaint rate | > 0.1% | 0.02–0.1% | < 0.02% |
| Unsubscribe rate | > 0.5% | 0.2–0.5% | < 0.2% |
Notice the bottom three rows. Bounces and complaints are leading indicators; open rate is a lagging one. A 2%+ bounce rate tells you your list is dirty before mailbox providers start routing you to spam — which is what actually tanks future opens. According to HubSpot's email marketing benchmarks, engagement-based sending consistently outperforms volume-based sending on every metric that survives the MPP era.
How do you actually improve your newsletter open rate?#
Four levers, in order of impact. Most teams obsess over the last one and ignore the first.
1. Clean your list first. Every invalid, mistyped, or abandoned address that bounces signals to Gmail and Outlook that you're a careless sender. Spam traps are worse — a single hit can land your domain on a blocklist. Run your list through an email verifier before every major send, and re-verify older segments quarterly. This is the single highest-leverage thing you can do, and almost nobody does it consistently.
2. Protect your sender reputation. Mailbox providers decide inbox-vs-spam based on your domain's history. Authenticate with SPF, DKIM, and DMARC, warm new domains slowly, and prune unengaged subscribers instead of blasting everyone. A poor sender reputation means even a perfect subject line never gets seen.
3. Segment and time your sends. A relevant email to 2,000 engaged people beats a generic one to 20,000 strangers. Segment by behavior — recent openers, recent clickers, recent buyers — and send when that segment is active, not when a generic "best time to send" chart says so.
4. Then optimize subject lines. Yes, subject lines matter — but they're the last 10%, not the first. Once your list is clean and your reputation is solid, A/B test length, personalization, and curiosity gaps. A free subject line tester will get you further than guessing.
The order matters. A brilliant subject line sent from a burned domain to a bounce-heavy list will still lose. Fix the foundation first.
How does list quality connect to open rate?#
Directly and brutally. Open rate is a fraction: opens divided by delivered emails. If your emails don't get delivered, the denominator shrinks and the metric lies — or worse, providers throttle you and the whole list suffers.
A list full of unverified addresses creates a doom loop:
- Invalid addresses bounce → mailbox providers flag you.
- Flagged senders get throttled or spam-foldered → real subscribers stop seeing you.
- Lower engagement reinforces the spam signal → it compounds.
Breaking the loop starts at the source: only add real, deliverable addresses in the first place. When you're building a B2B newsletter list from company domains, a tool like Tomba's domain search returns verified, professional addresses instead of guesses — which means fewer bounces from day one. You can spot-check the platform's accuracy approach on its data sources page, and review plan limits on the Tomba pricing page.
It's the difference between filling a bucket that has holes versus patching the holes first. Verification patches the holes.
How do newsletter benchmarks compare across tools?#
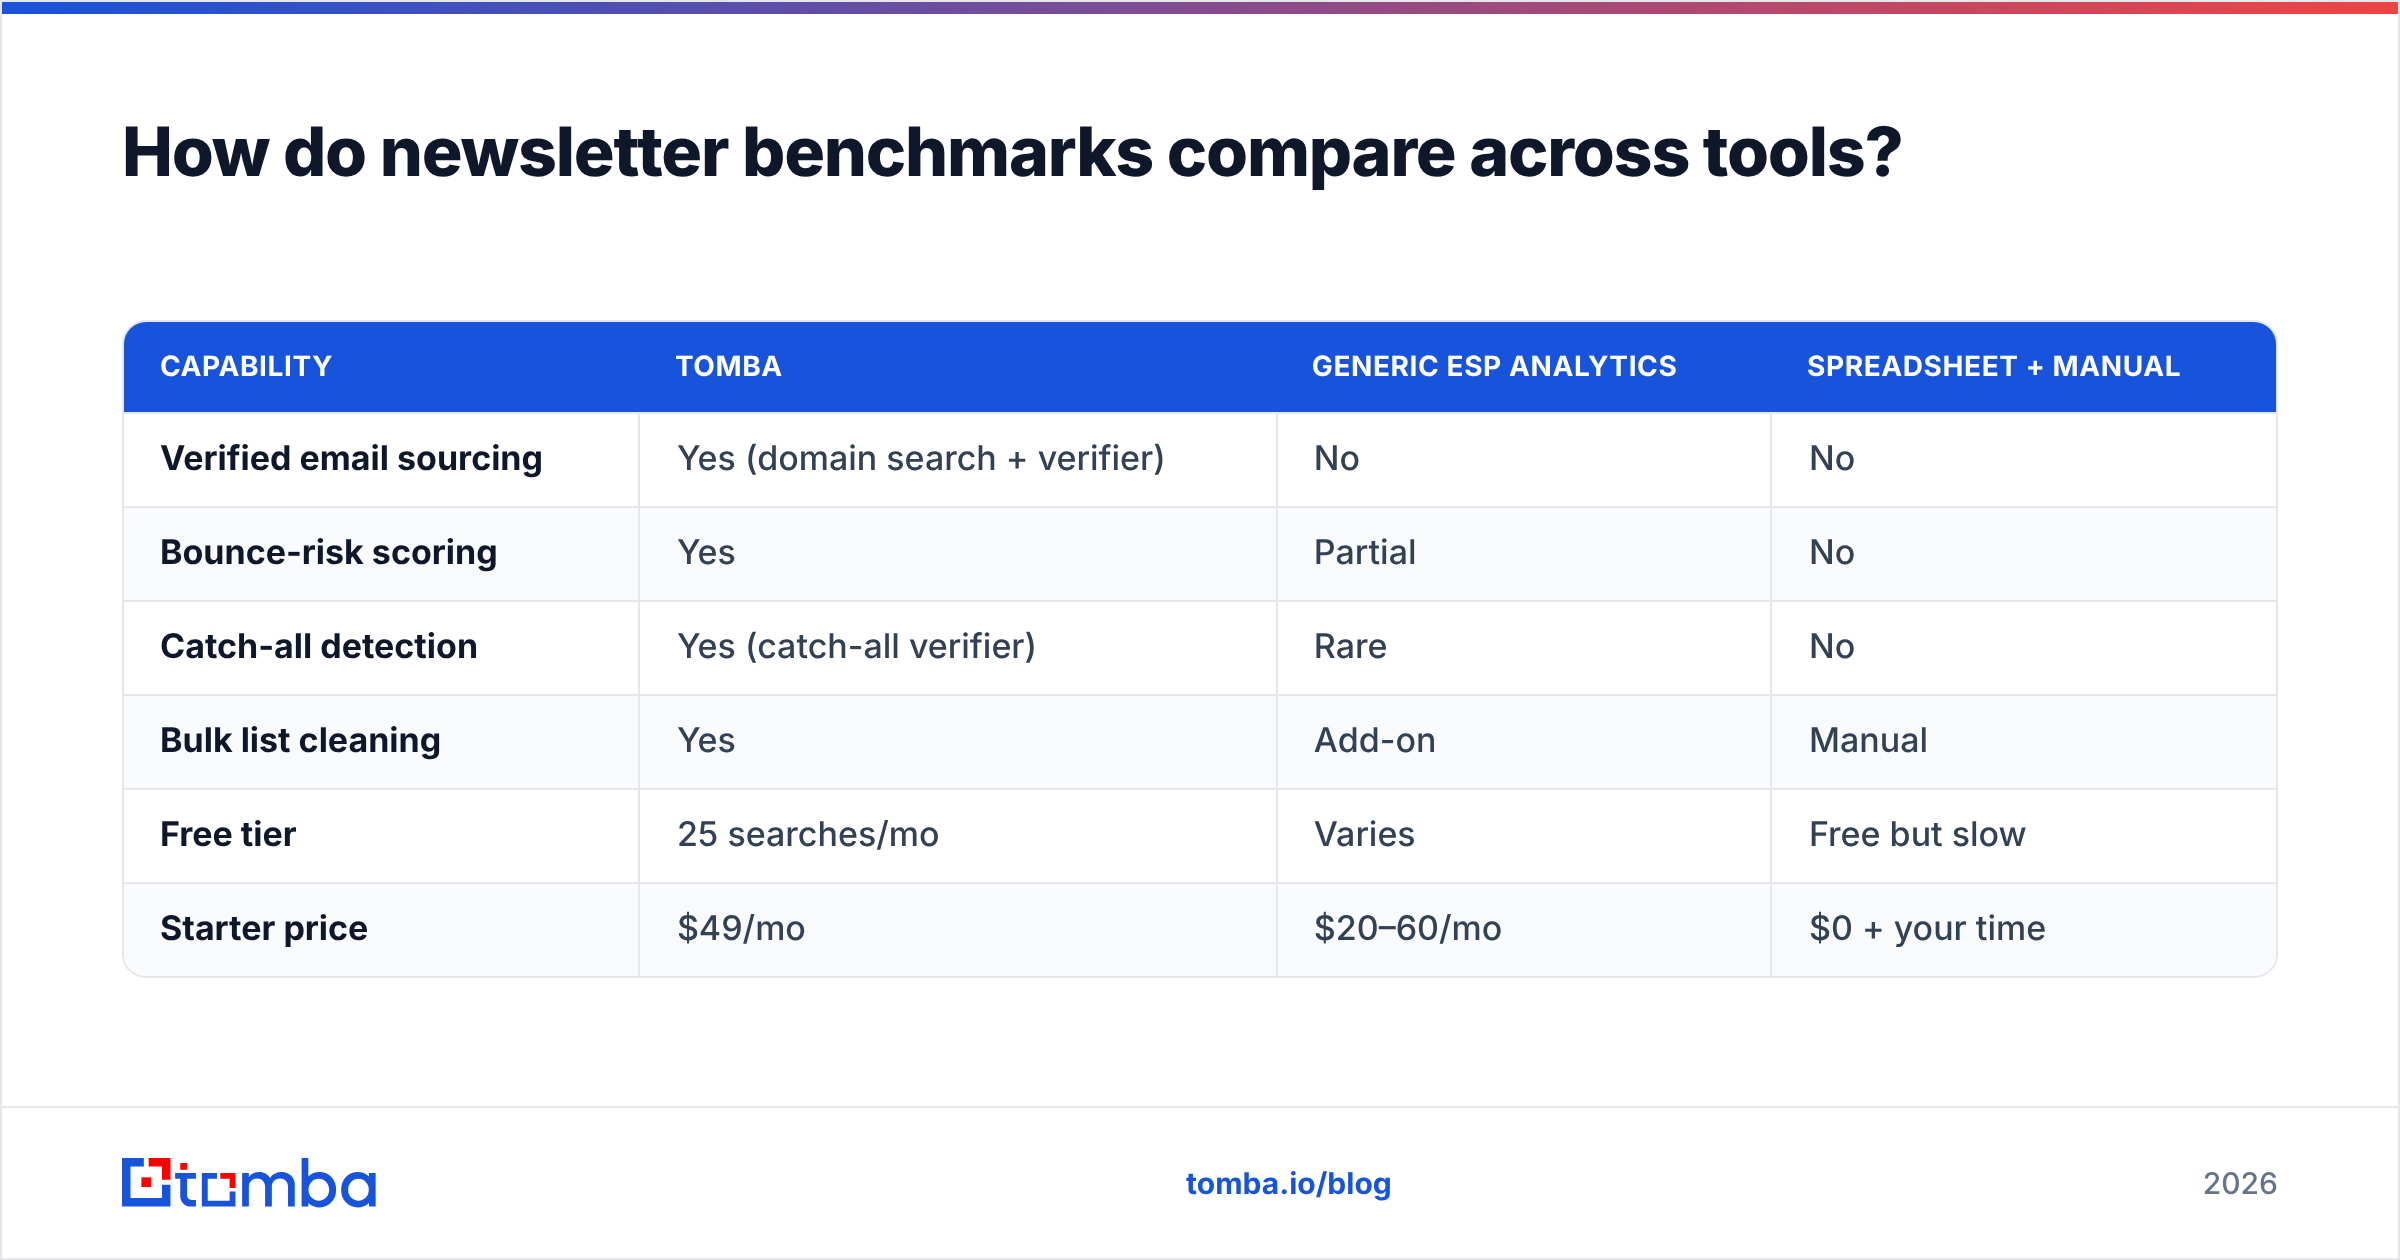
If you're shopping benchmark data or list-building tools, here's how the common options stack up for a newsletter-focused team:
| Capability | Tomba | Generic ESP analytics | Spreadsheet + manual |
|---|---|---|---|
| Verified email sourcing | Yes (domain search + verifier) | No | No |
| Bounce-risk scoring | Yes | Partial | No |
| Catch-all detection | Yes (catch-all verifier) | Rare | No |
| Bulk list cleaning | Yes | Add-on | Manual |
| Free tier | 25 searches/mo | Varies | Free but slow |
| Starter price | $49/mo | $20–60/mo | $0 + your time |
The ESP tells you what happened after you sent. Tools like G2's email verification category catalog the dozens of vendors that help you fix the list before you send. Most successful newsletter programs use both: a sending platform for delivery and analytics, and a verification layer for list hygiene.
Frequently asked questions#
Is a 22% open rate good in 2026? It was average in 2022, but in 2026 it's on the low side because Apple MPP inflated the baseline. Aim to beat your specific industry band and watch the trend rather than the raw number.
Did open rates really go up because of Apple, not better marketing? For many senders, yes. MPP pre-loads tracking pixels, so opens are logged automatically for Apple Mail users. That's why reply rate and click-through rate are now more trustworthy signals.
What's the most underrated way to raise open rate? List verification. Removing invalid and risky addresses protects your sender reputation, which directly determines whether future emails reach the inbox at all.
Start with a list worth opening#
Your open rate is only as honest as your list. Before you obsess over subject lines or send times, make sure every address you're emailing is real, deliverable, and worth keeping. Build that list with verified, professional contacts using the Tomba Email Finder — find and confirm B2B addresses by domain, name, or company, so your next newsletter lands in inboxes instead of bouncing into blocklists. Clean inputs, honest metrics, better opens. Start free with 25 searches a month and scale up when you're ready.
Ready to find emails that actually work?
Join 150,000+ professionals who stopped guessing and started sending. Free credits on signup — no credit card required.
Get the Tomba newsletter
Practical outbound tactics and product updates — once every two weeks.
About the author