Average Sales Close Rate in 2026: Benchmarks & How to Beat Them
What is a good close rate in 2026? See real benchmarks by industry, the formula reps get wrong, and seven levers that move the number fast.
TL;DR
- The average sales close rate across B2B sits around 20%, but healthy ranges run from roughly 15% to 30% depending on industry, deal size, and lead source.
- Close rate is won-deals ÷ qualified opportunities — not deals ÷ every lead you ever touched. Mixing those denominators is the most common reporting error.
- Industry matters: SaaS, professional services, and financial services all benchmark differently. Compare yourself to your segment, not a blog-post average.
- The fastest lever is lead quality at the top, not closing tricks at the bottom. Better-targeted, verified contacts raise close rate before you change a single script.
- Track close rate alongside win rate, sales cycle length, and average deal size — one number in isolation lies.
What is the average sales close rate in 2026?#
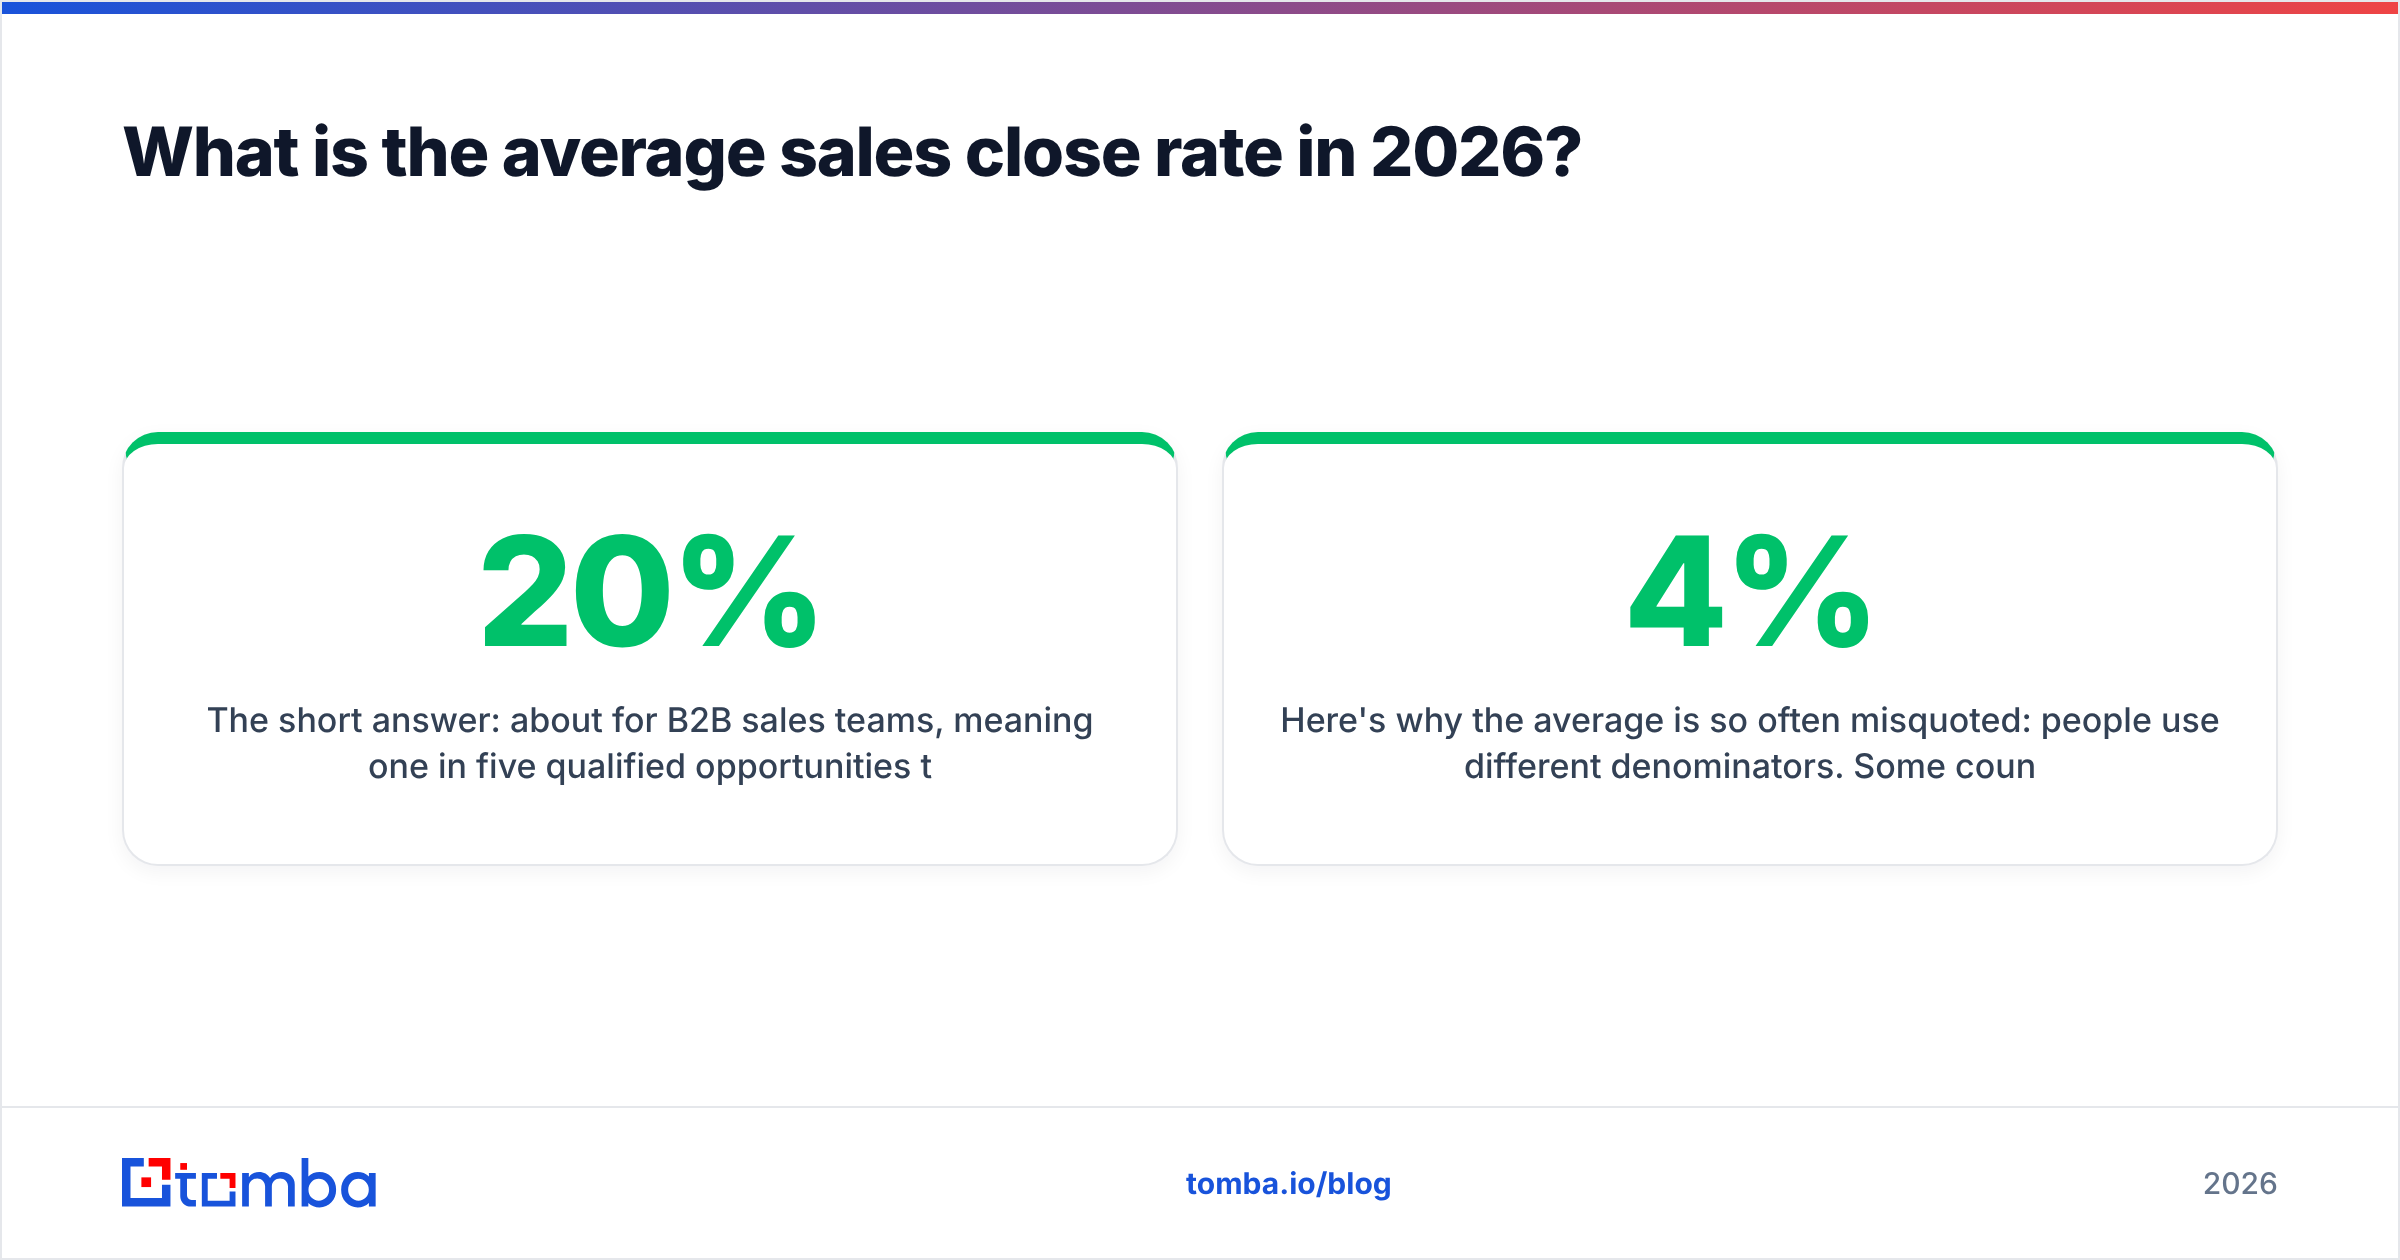
The short answer: about 20% for B2B sales teams, meaning one in five qualified opportunities turns into a paying customer. That figure has held remarkably steady, but "average" hides a wide spread. A self-serve SaaS team working inbound demos might close 25–30%, while a team chasing cold enterprise deals can be perfectly healthy at 12%.
Close rate is like a restaurant's table-turn rate. The headline number tells you something, but a fine-dining spot and a fast-casual chain live in completely different ranges — comparing them directly is meaningless. Your close rate only matters against teams selling a similar product, at a similar price, to a similar buyer.
Here's why the average is so often misquoted: people use different denominators. Some count every lead that ever entered the CRM. Others count only sales-accepted opportunities. The same sales team can report a 4% close rate or a 22% close rate depending on which number sits on the bottom of the fraction.
)
How do you calculate close rate correctly?#
Close rate = (Deals won ÷ Qualified opportunities) × 100.
If you closed 18 deals from 90 qualified opportunities last quarter, your close rate is 20%. Simple — but the rigor is in the definitions.
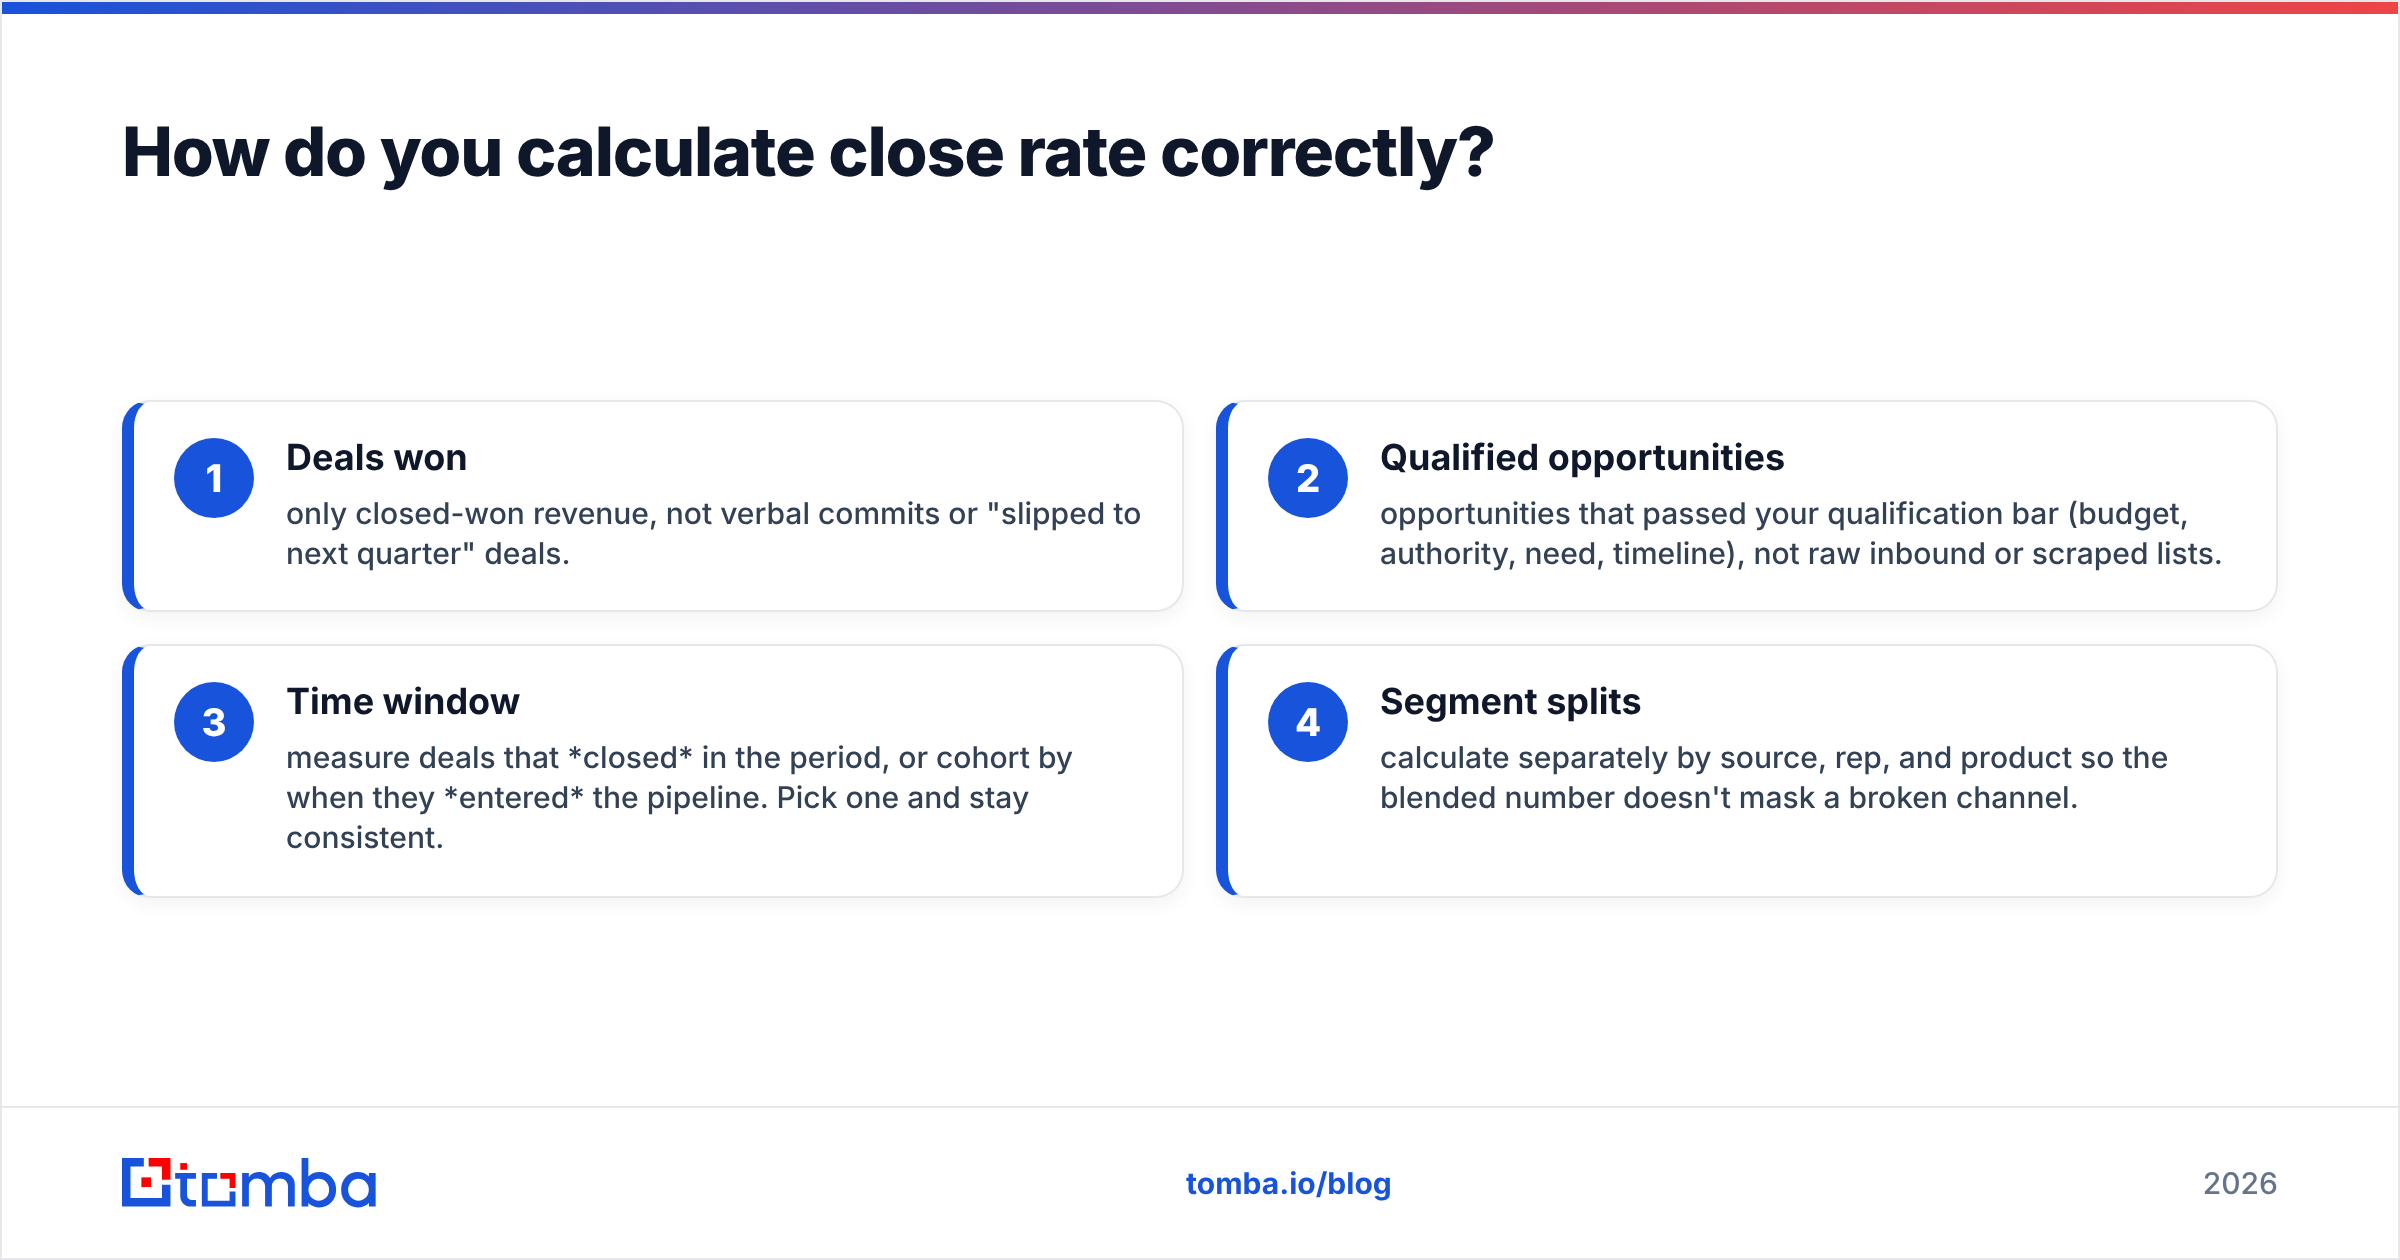
- Deals won — only closed-won revenue, not verbal commits or "slipped to next quarter" deals.
- Qualified opportunities — opportunities that passed your qualification bar (budget, authority, need, timeline), not raw inbound or scraped lists.
- Time window — measure deals that closed in the period, or cohort by when they entered the pipeline. Pick one and stay consistent.
- Segment splits — calculate separately by source, rep, and product so the blended number doesn't mask a broken channel.
Close rate is a cousin of win rate, but they're not identical. Win rate usually measures competitive deals where a decision was made (you won or you lost). Close rate often includes deals that simply went dark. Decide which question you're answering — "how often do I beat a competitor?" versus "how often does a real opportunity become revenue?" — and label the metric honestly.
What is a good close rate by industry?#
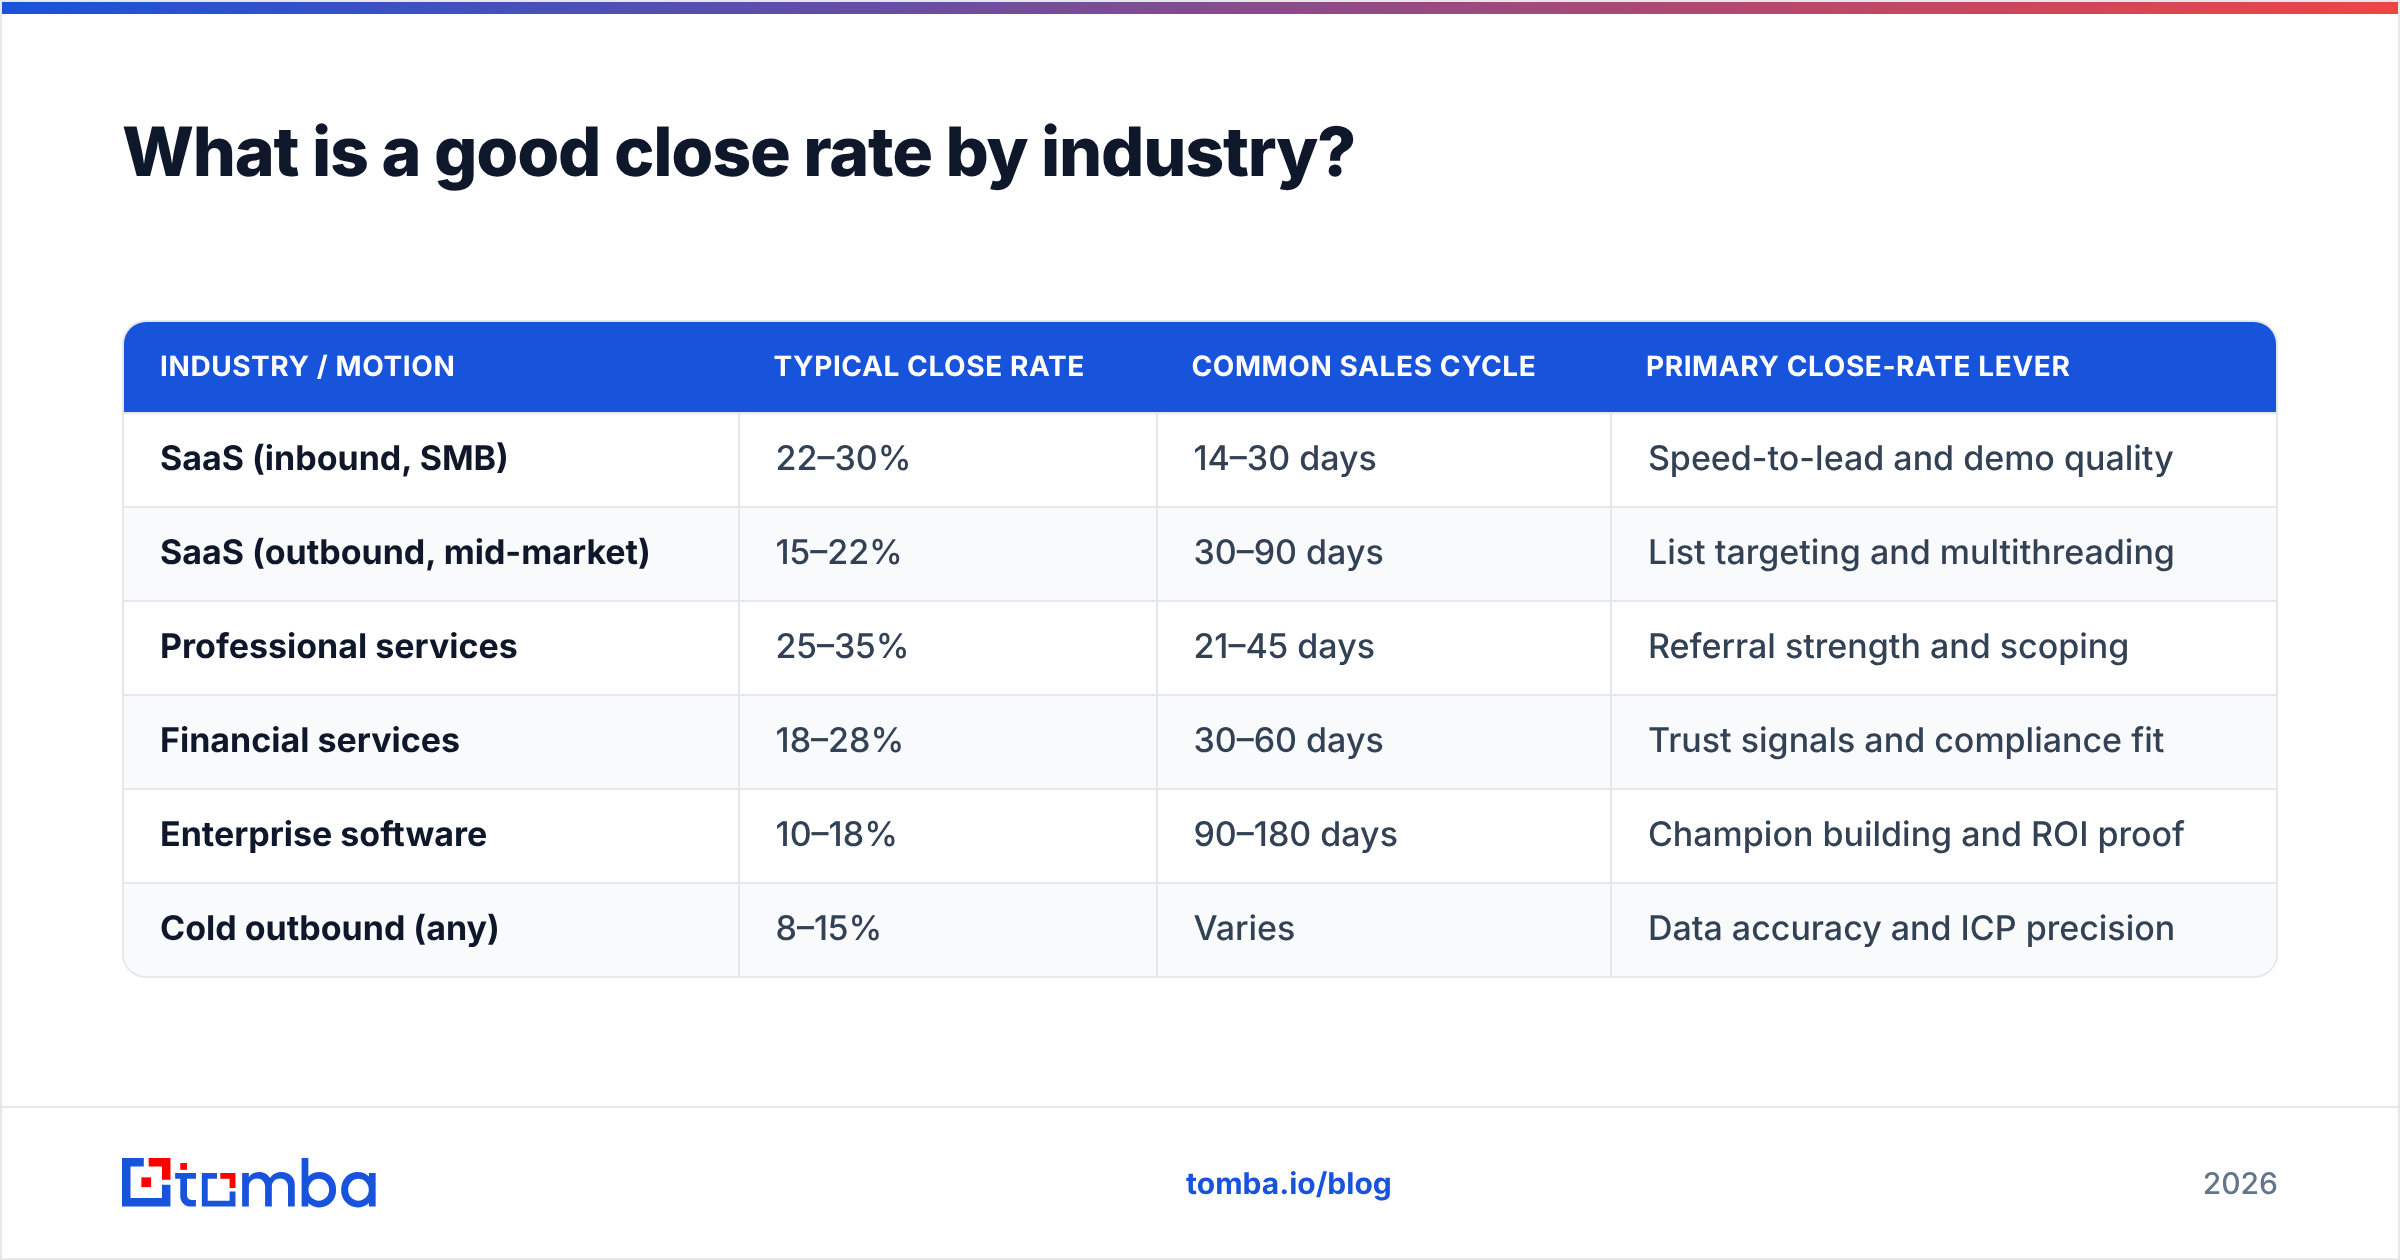
There's no single "good" number, so anchor to your category. The table below shows representative 2026 B2B ranges. Treat these as orientation, not gospel — your motion, ACV, and lead source shift them.
| Industry / Motion | Typical close rate | Common sales cycle | Primary close-rate lever |
|---|---|---|---|
| SaaS (inbound, SMB) | 22–30% | 14–30 days | Speed-to-lead and demo quality |
| SaaS (outbound, mid-market) | 15–22% | 30–90 days | List targeting and multithreading |
| Professional services | 25–35% | 21–45 days | Referral strength and scoping |
| Financial services | 18–28% | 30–60 days | Trust signals and compliance fit |
| Enterprise software | 10–18% | 90–180 days | Champion building and ROI proof |
| Cold outbound (any) | 8–15% | Varies | Data accuracy and ICP precision |
Notice the pattern: shorter cycles and warmer sources sit higher. The teams at the bottom aren't worse — they're selling harder things to harder buyers. If you run cold outbound, a 12% close rate paired with a healthy response rate can be a genuinely strong result.
For broader cross-industry baselines, vendor benchmark reports from HubSpot and peer-review data on G2 are useful sanity checks — just confirm they're measuring the same denominator you are.
Why is your close rate lower than the benchmark?#
Most low close rates trace back to the top of the funnel, not the bottom. Reps obsess over objection handling when the real leak is that half their "opportunities" were never real.
- Bad or stale contact data. If a third of your outreach hits wrong people or dead inboxes, your qualified-opportunity count is inflated with phantoms that can never close. Verified, current contacts fix the denominator at the source.
- Loose qualification. When anything with a pulse becomes an "opportunity," close rate craters by definition. Tighten the entry bar.
- Single-threaded deals. Enterprise deals with one contact die when that person leaves or goes quiet. Multithread early.
- Slow follow-up. Speed-to-lead decays fast; a demo booked in 5 minutes closes far more often than one booked in 5 hours.
- No disqualification discipline. Reps who never lose deals are usually hiding them in "open" forever, which quietly distorts the metric.
)
The uncomfortable truth: you can coach closing technique all quarter and barely move the number if your inputs are garbage. Clean inputs move it immediately.
How do you improve your average sales close rate?#
Pull the levers in order of impact. The first three change your inputs; the rest change your execution.
- Fix lead quality first. Feed reps verified, ICP-matched contacts instead of scraped lists. Accurate emails and direct dials mean conversations actually happen, which is the precondition for closing anything. This is where an email finder and data enrichment earn their keep.
- Tighten qualification. Define exactly what an opportunity is and enforce it. A smaller, cleaner pipeline with a 25% close rate beats a bloated one at 8%.
- Multithread every deal over your ACV threshold. Map two to four stakeholders before the proposal stage.
- Compress speed-to-lead. Route and contact inbound within minutes, not hours.
- Standardize the demo and next-step. Every call ends with a scheduled, calendared next action — no "I'll follow up."
- Run loss reviews. Interview lost deals monthly; patterns in why you lose are a roadmap for raising close rate.
- Align with marketing on lead source. Track close rate by channel and starve the sources that never convert.
Here's the leverage math. If you close 20% today and lift it to 24% — a four-point gain — you've added 20% more revenue from the same pipeline. You didn't need more leads. You needed better ones and tighter execution.
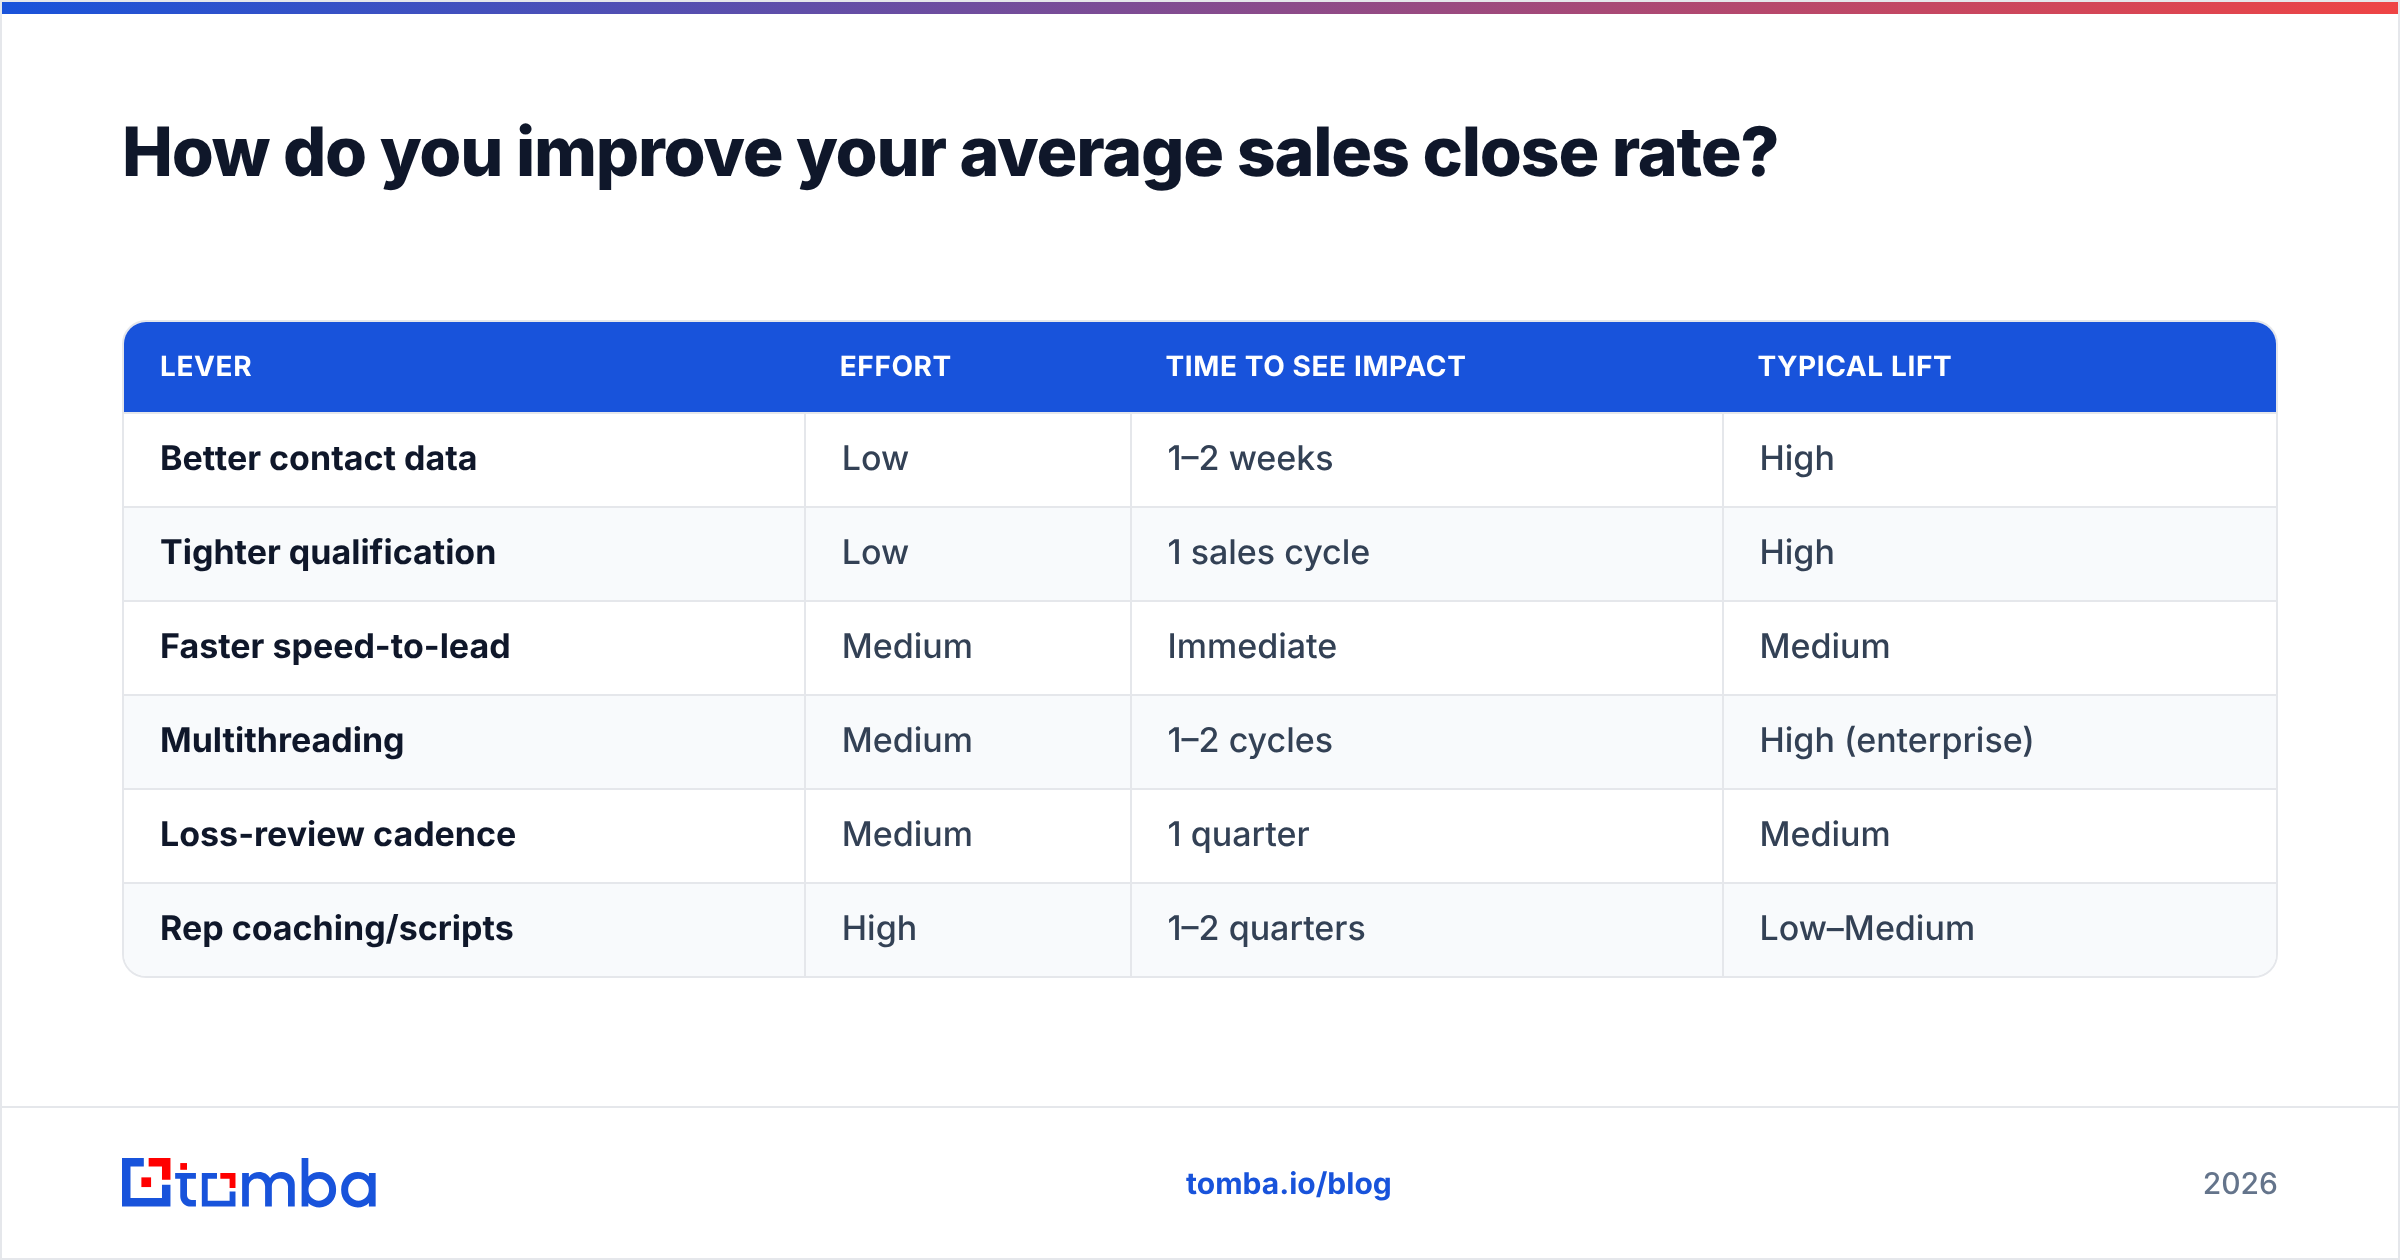
Close-rate levers ranked by speed-to-impact#
| Lever | Effort | Time to see impact | Typical lift |
|---|---|---|---|
| Better contact data | Low | 1–2 weeks | High |
| Tighter qualification | Low | 1 sales cycle | High |
| Faster speed-to-lead | Medium | Immediate | Medium |
| Multithreading | Medium | 1–2 cycles | High (enterprise) |
| Loss-review cadence | Medium | 1 quarter | Medium |
| Rep coaching/scripts | High | 1–2 quarters | Low–Medium |
The cheapest, fastest wins are at the top — and they're about data and process, not charisma.
How does data accuracy change close rate?#
Directly and measurably. Every dead email and wrong number is a qualified opportunity that was never qualified at all. When you clean the top of the funnel, the close-rate fraction improves from the denominator up.
Think of it like a leaky bucket. You can pour more water (leads) in all day, but if the holes (bad data, no-shows, wrong contacts) stay, your usable volume — closed deals — barely rises. Patch the holes and the same inflow suddenly yields far more.
Concretely, teams that verify contacts before outreach tend to book more meetings per hundred attempts, which raises the share of opportunities that reach a real decision. Pair an accurate email verifier with enrichment so reps spend their hours on reachable, in-ICP buyers instead of chasing ghosts. The number on your close-rate dashboard is downstream of this work. For a deeper view of how clean records flow through the funnel, see how teams structure their sales process and pipeline around verified data.
CRM platforms like Salesforce will happily calculate close rate for you — but they calculate it on whatever data you feed them. Garbage in, confident-looking dashboard out.
What other metrics should you track alongside close rate?#
Close rate alone is a vanity trap. A rep can hit 40% by cherry-picking only easy deals and ignoring everything hard — great rate, tiny revenue. Always read it with three companions:
- Average deal size — a falling close rate with rising deal size can be a net win.
- Sales cycle length — faster cycles at the same rate mean more closes per year.
- Pipeline coverage — close rate sets how much pipeline you need; 20% means you need 5× quota in qualified opportunities.
Together these four tell the real story. Optimizing one while ignoring the others is how teams "improve" themselves into a revenue hole.
The bottom line#
The average sales close rate hovers near 20%, but your target is your industry's range, measured with an honest denominator. The fastest path to a higher number isn't a better closing script — it's better inputs: verified, ICP-matched contacts and disciplined qualification that keep phantom opportunities out of your pipeline entirely.
Want to lift your close rate from the top of the funnel? Start with cleaner data. Tomba's Email Finder helps you reach the right decision-makers with verified, current contact details — so the opportunities entering your pipeline are real ones that can actually close. The free tier includes 25 searches a month, and paid plans start at $49/mo; see full Tomba pricing to match a plan to your team's volume. Fix the inputs, and the close rate follows.
Ready to find emails that actually work?
Join 150,000+ professionals who stopped guessing and started sending. Free credits on signup — no credit card required.
Get the Tomba newsletter
Practical outbound tactics and product updates — once every two weeks.
About the author