Average Sales Cycle in 2026: Benchmarks, Length & How to Shorten It
What counts as a healthy average sales cycle in 2026? Real benchmarks by deal type, the stages that slow you down, and seven proven ways to close faster.
TL;DR
- The average sales cycle is the typical time from first touch to closed-won. For B2B in 2026 it lands around 84 days, but ranges from under 30 days for low-ticket SMB deals to 6–12 months for enterprise.
- Cycle length is driven by deal size, number of stakeholders, contract value, and how clean your prospecting data is — not by how "hard" your reps work.
- Measuring it correctly means picking a consistent start event (first meaningful touch) and a consistent end event (signed contract), then segmenting by deal type.
- The fastest, cheapest lever is usually the top of funnel: targeting the right accounts with verified contact data so reps stop wasting weeks chasing bounces and gatekeepers.
- You can realistically cut 15–30% off your cycle with better data hygiene, tighter qualification, multithreading, and mutual action plans.
What is the average sales cycle?#
The average sales cycle is the mean number of days it takes a deal to move from the first recorded interaction to a closed outcome — usually closed-won. Think of it like cooking time on a recipe: it tells you roughly how long a deal "takes to bake" so you can plan capacity, forecast revenue, and spot deals that are running cold.
In practice, it's a single number that hides a lot. A self-serve $40/month subscription and a $400,000 enterprise platform purchase both count as "sales," but one closes in a week and the other takes three quarters. That's why the average only becomes useful once you segment it.
Across B2B, most credible benchmarks put the typical sales cycle somewhere between 80 and 90 days. HubSpot and other vendors that aggregate CRM data report an average close to 84 days for B2B deals, with SaaS and technology deals often running longer because of procurement and security review. Use that as a sanity check, not a target — your own historical data is the only benchmark that actually predicts your next quarter.
How do you calculate your average sales cycle length?#
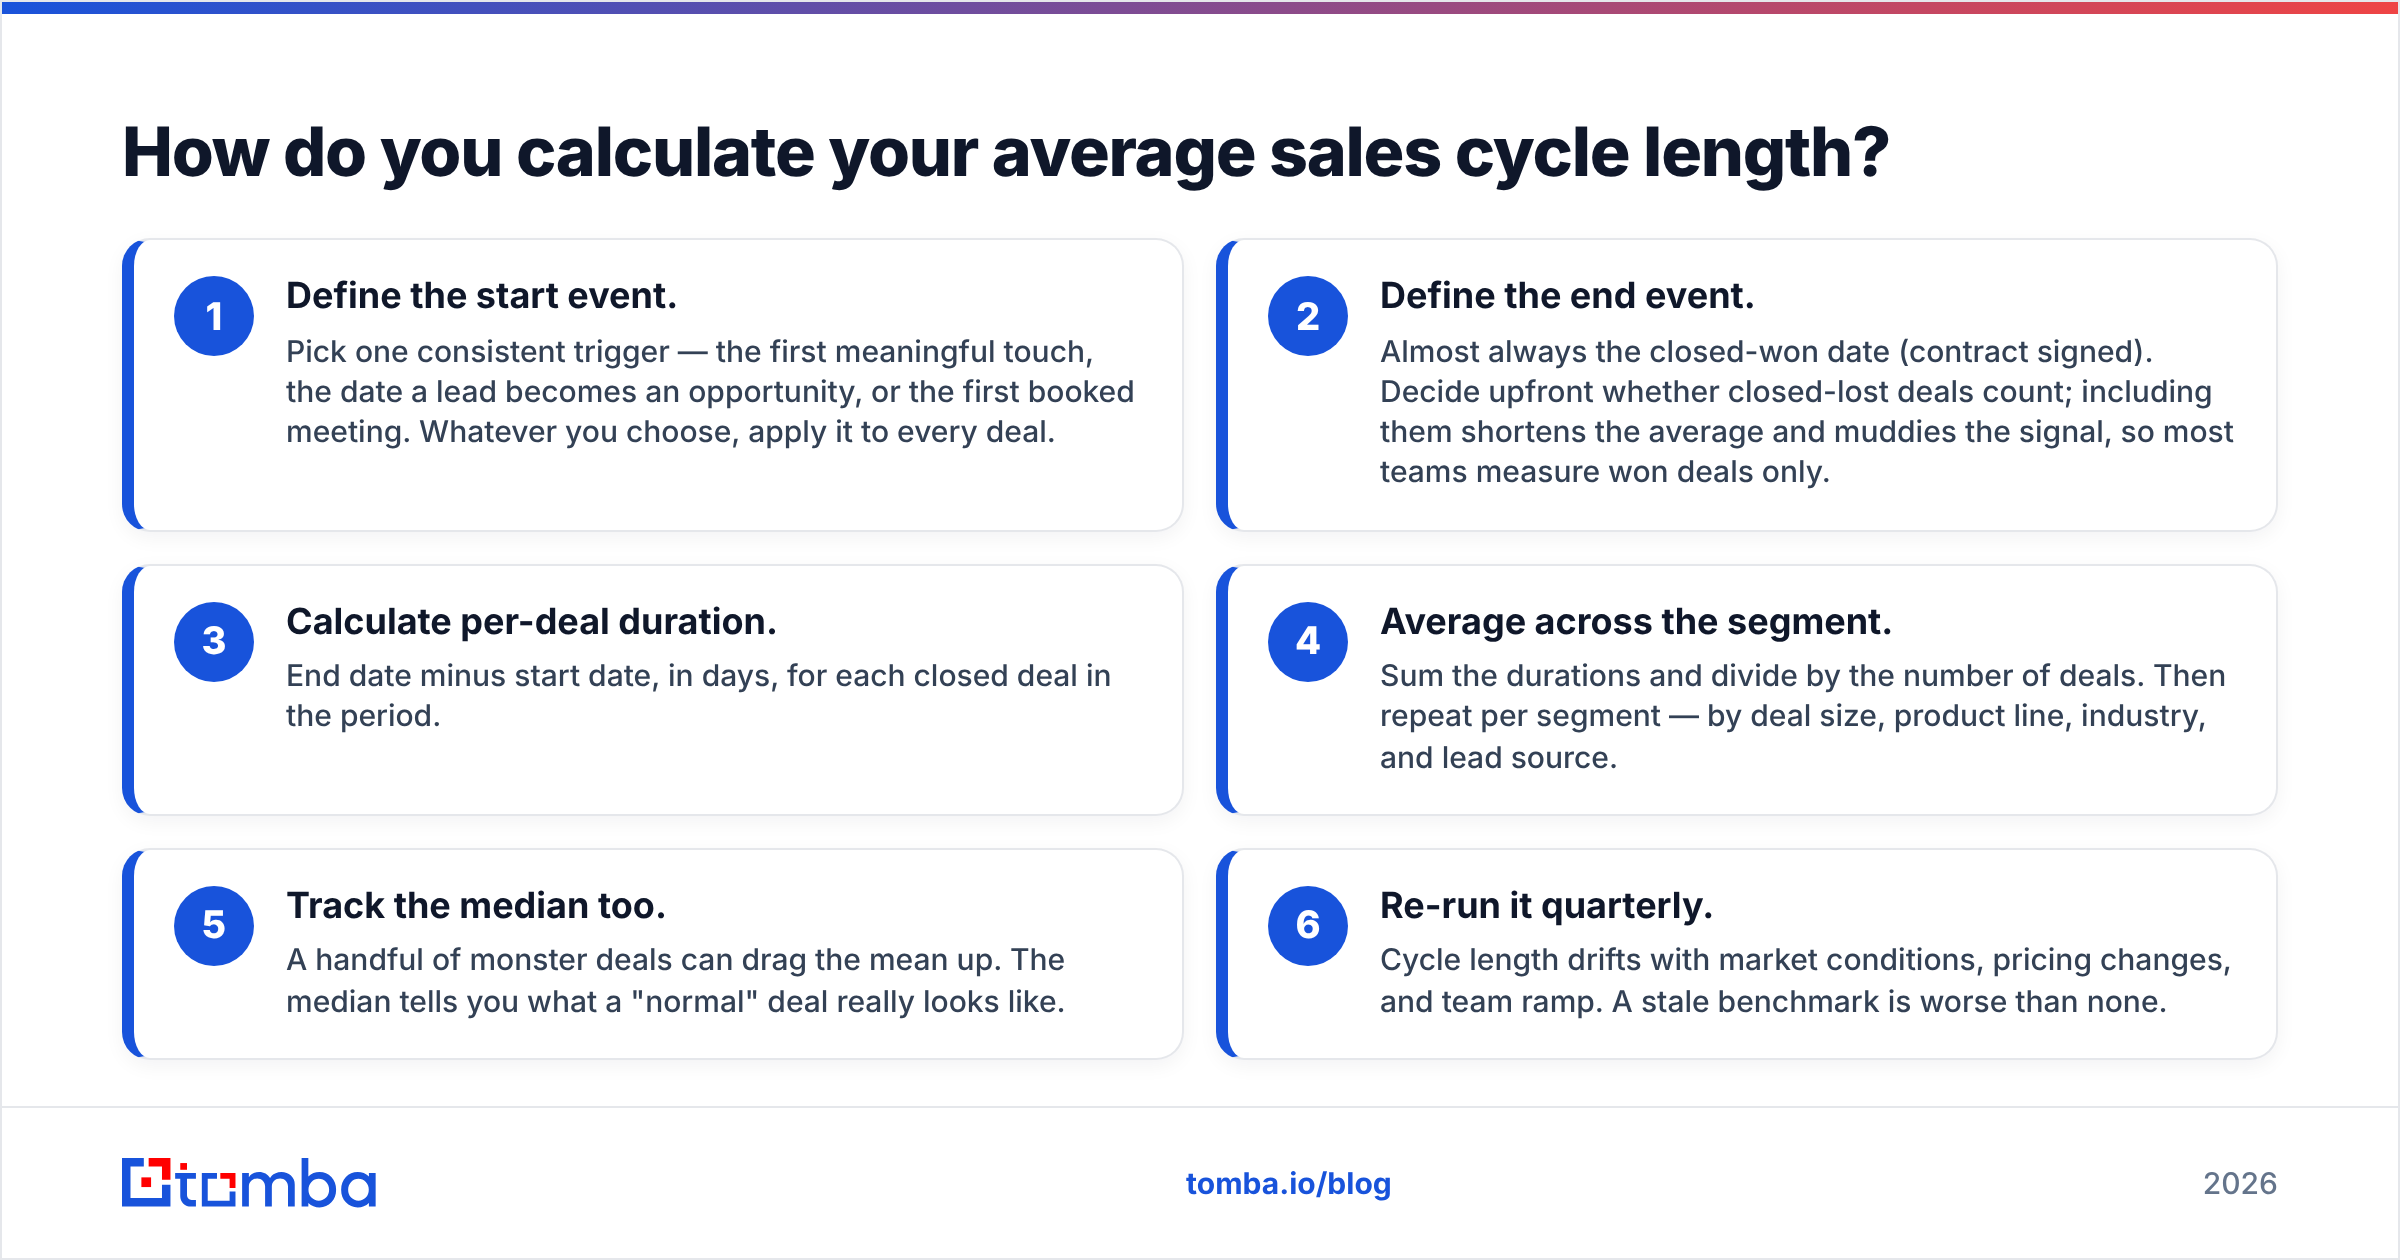
The math is simple; the discipline is not. Here is the clean way to do it.
- Define the start event. Pick one consistent trigger — the first meaningful touch, the date a lead becomes an opportunity, or the first booked meeting. Whatever you choose, apply it to every deal.
- Define the end event. Almost always the closed-won date (contract signed). Decide upfront whether closed-lost deals count; including them shortens the average and muddies the signal, so most teams measure won deals only.
- Calculate per-deal duration. End date minus start date, in days, for each closed deal in the period.
- Average across the segment. Sum the durations and divide by the number of deals. Then repeat per segment — by deal size, product line, industry, and lead source.
- Track the median too. A handful of monster deals can drag the mean up. The median tells you what a "normal" deal really looks like.
- Re-run it quarterly. Cycle length drifts with market conditions, pricing changes, and team ramp. A stale benchmark is worse than none.
If your CRM start and end dates are inconsistent — reps logging opportunities late, or backdating closes — your average is fiction. Fix the CRM hygiene first, then trust the number.
What is a good average sales cycle by deal type?#
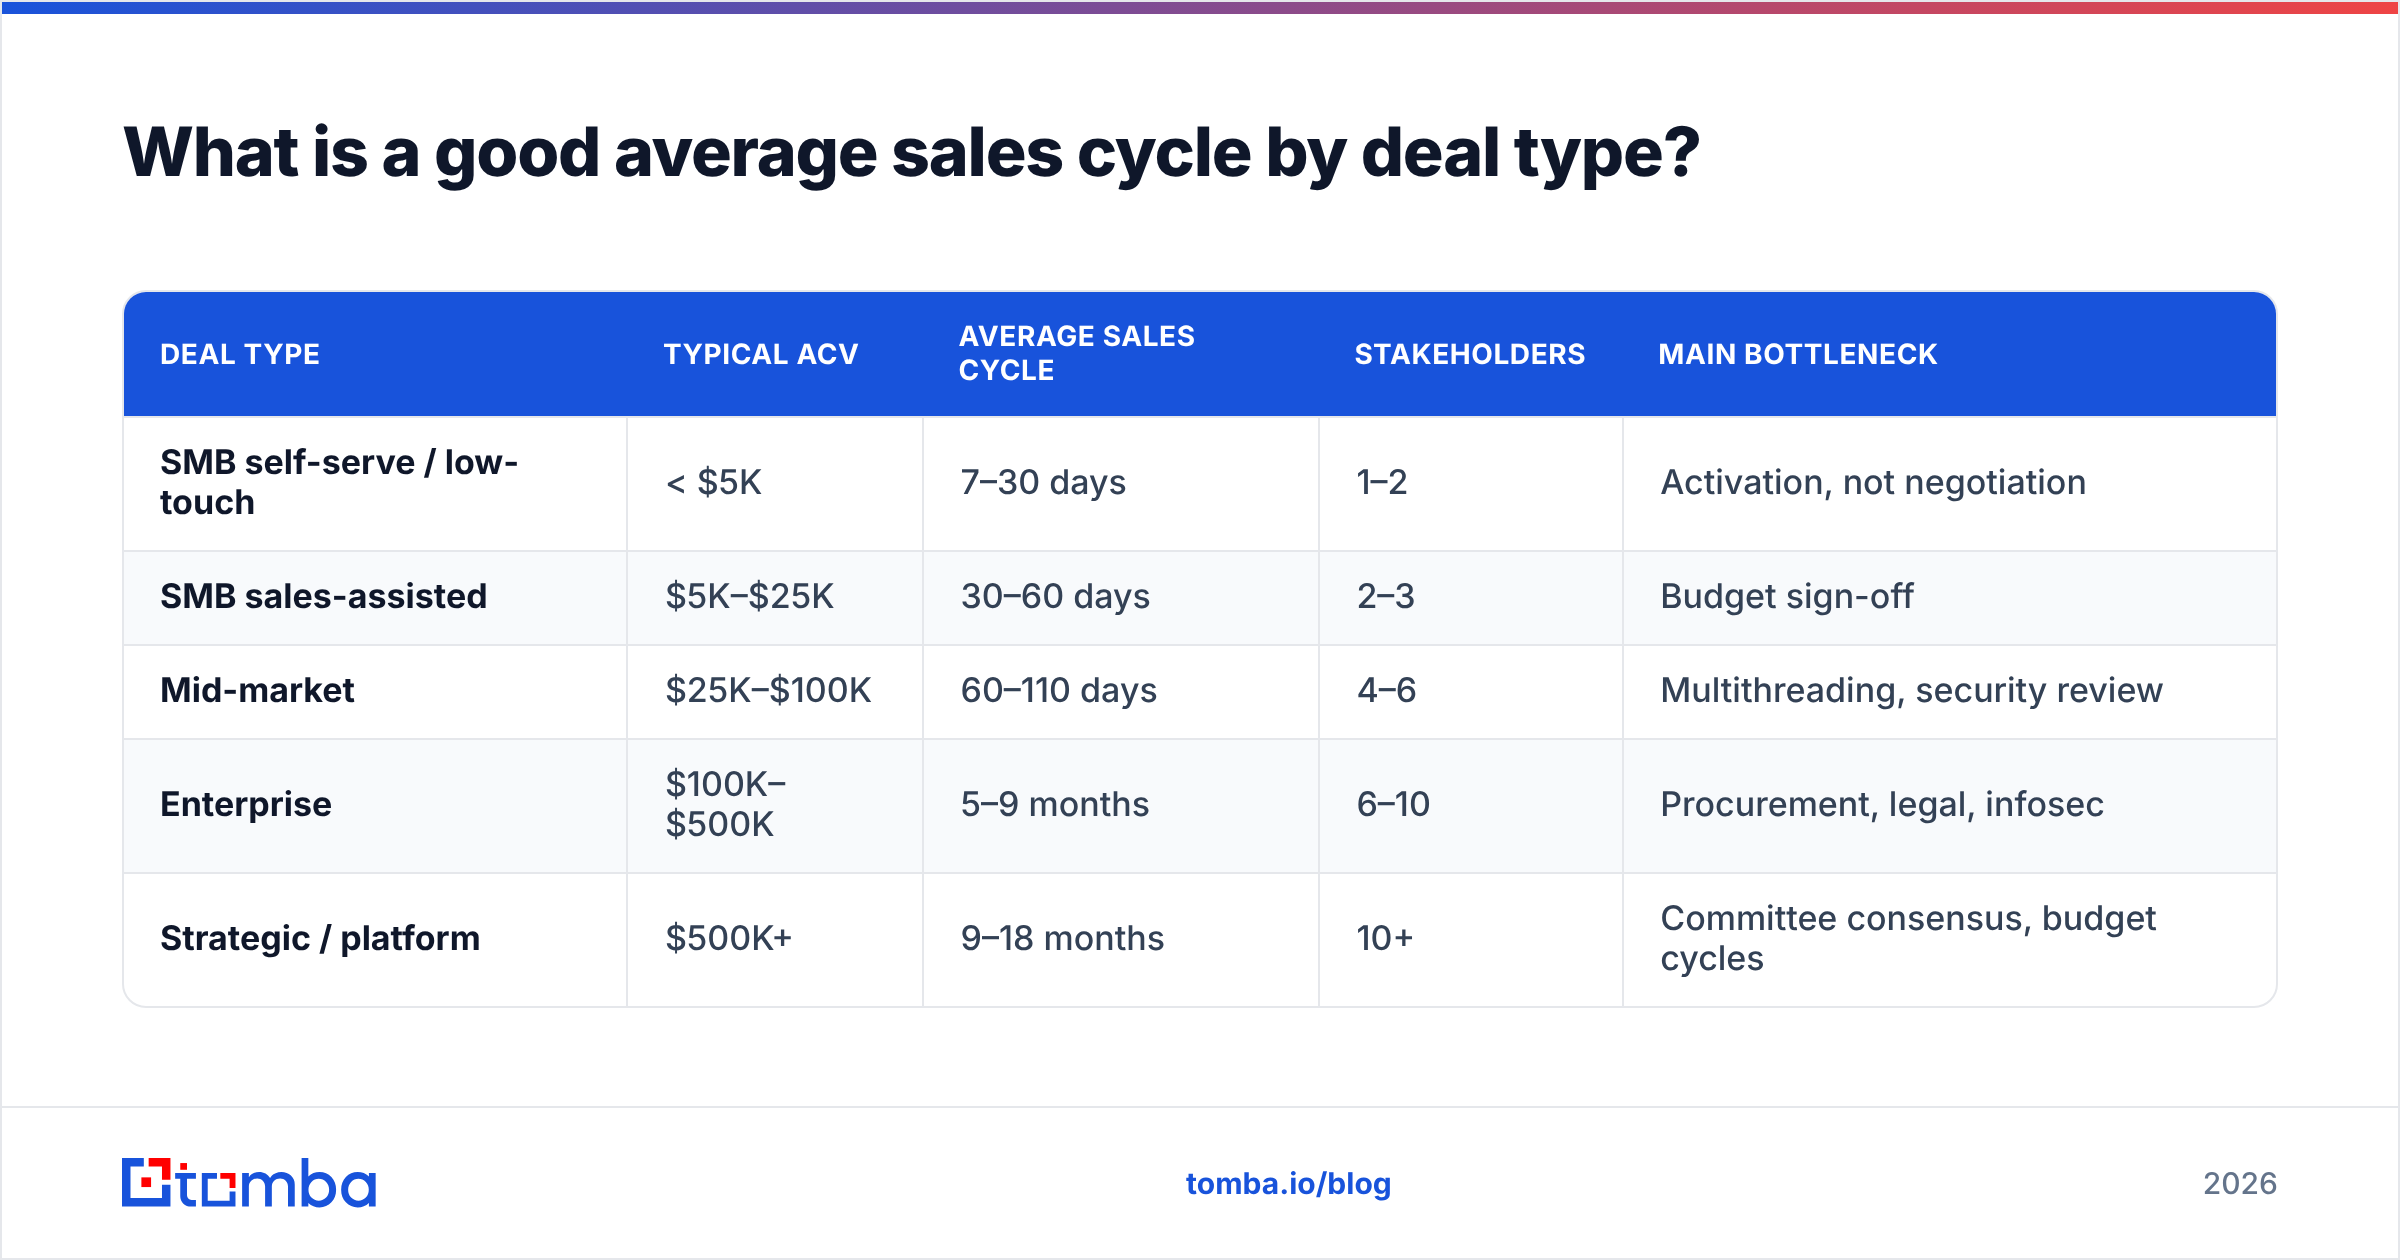
There is no universal "good." A good cycle is one that's shorter than your segment benchmark while keeping win rate steady. Here's a realistic 2026 reference grid for B2B.
| Deal type | Typical ACV | Average sales cycle | Stakeholders | Main bottleneck |
|---|---|---|---|---|
| SMB self-serve / low-touch | < $5K | 7–30 days | 1–2 | Activation, not negotiation |
| SMB sales-assisted | $5K–$25K | 30–60 days | 2–3 | Budget sign-off |
| Mid-market | $25K–$100K | 60–110 days | 4–6 | Multithreading, security review |
| Enterprise | $100K–$500K | 5–9 months | 6–10 | Procurement, legal, infosec |
| Strategic / platform | $500K+ | 9–18 months | 10+ | Committee consensus, budget cycles |
Notice the pattern: cycle length scales with contract value and the number of people who have to say yes. Every additional stakeholder adds calendars to coordinate, objections to handle, and internal champions to enable. Shortening a cycle is largely about removing friction from that multiplayer process — not about pushing harder on a single buyer.
Why is your sales cycle longer than the benchmark?#
A few usual suspects show up again and again when a cycle balloons past its segment benchmark:
- Bad-fit prospects. Reps spend weeks on accounts that were never going to buy. This is a targeting and qualification failure, and it inflates both cycle length and pipeline noise.
- Dirty contact data. Bounced emails, wrong job titles, and disconnected phone numbers mean every outreach attempt is a coin flip. Days turn into weeks before you even reach a real decision-maker.
- Single-threading. Betting the whole deal on one champion. When they go quiet, get reorganized, or leave, the deal stalls for a month.
- No mutual action plan. Without an agreed timeline and next steps, deals drift. Buyers have day jobs; your deal isn't their priority unless you make the path obvious.
- Late-stage surprises. Security questionnaires, legal redlines, and procurement gates that nobody scoped at the start can add 30–60 days at the worst possible moment.
The first two are where most teams bleed the most time, and they're also the cheapest to fix. Reaching the right person with verified data on attempt one — instead of attempt five — compresses the early stages that quietly eat a third of the calendar.
How does prospecting data affect average sales cycle?#
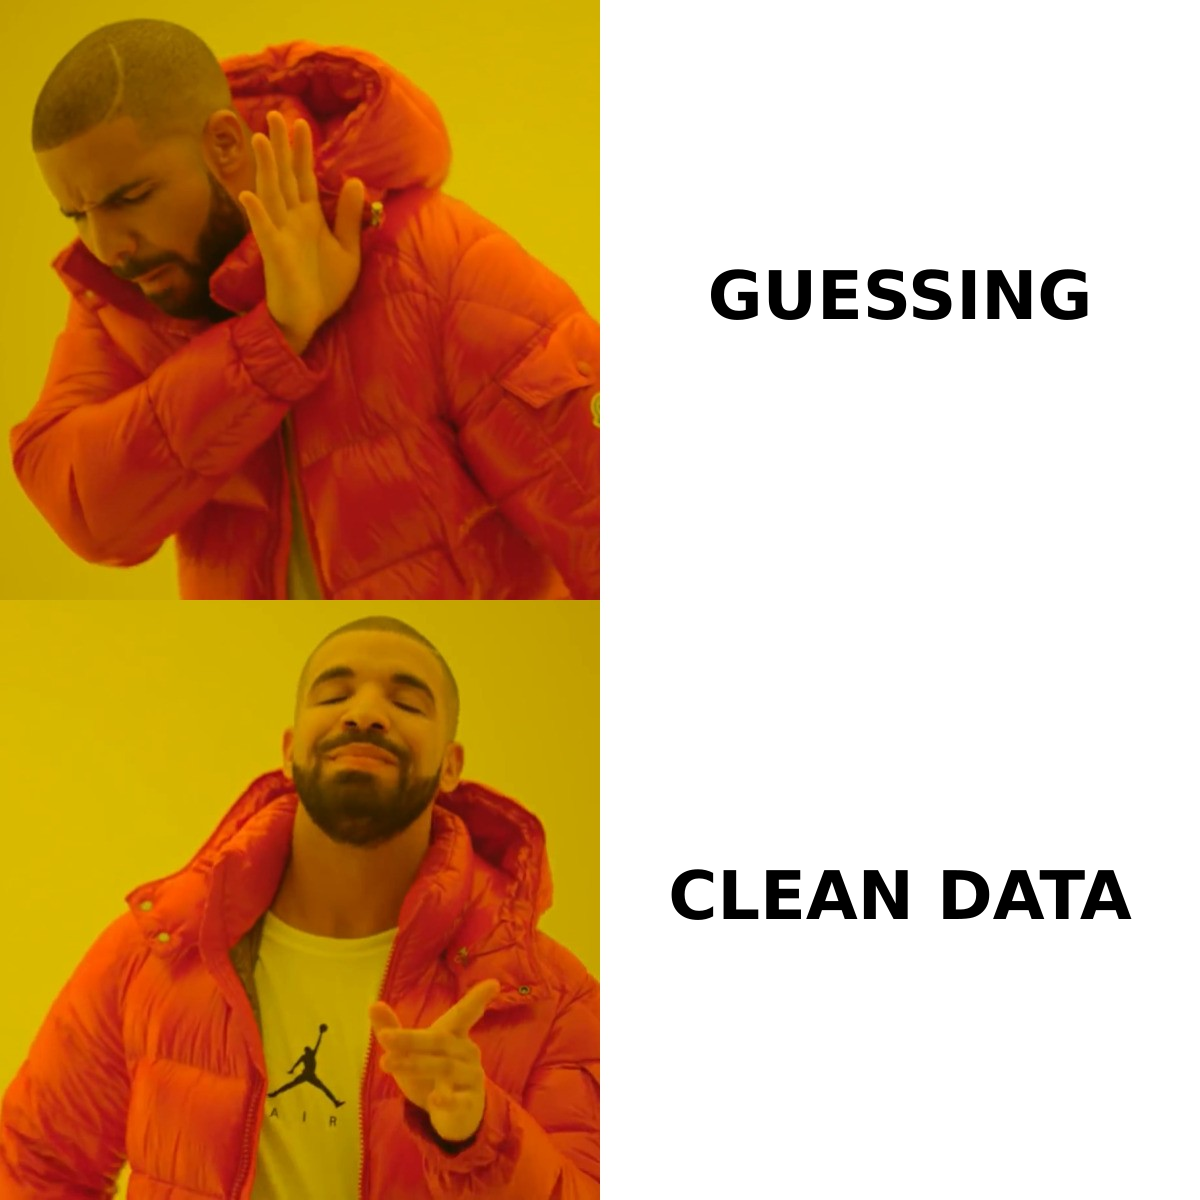
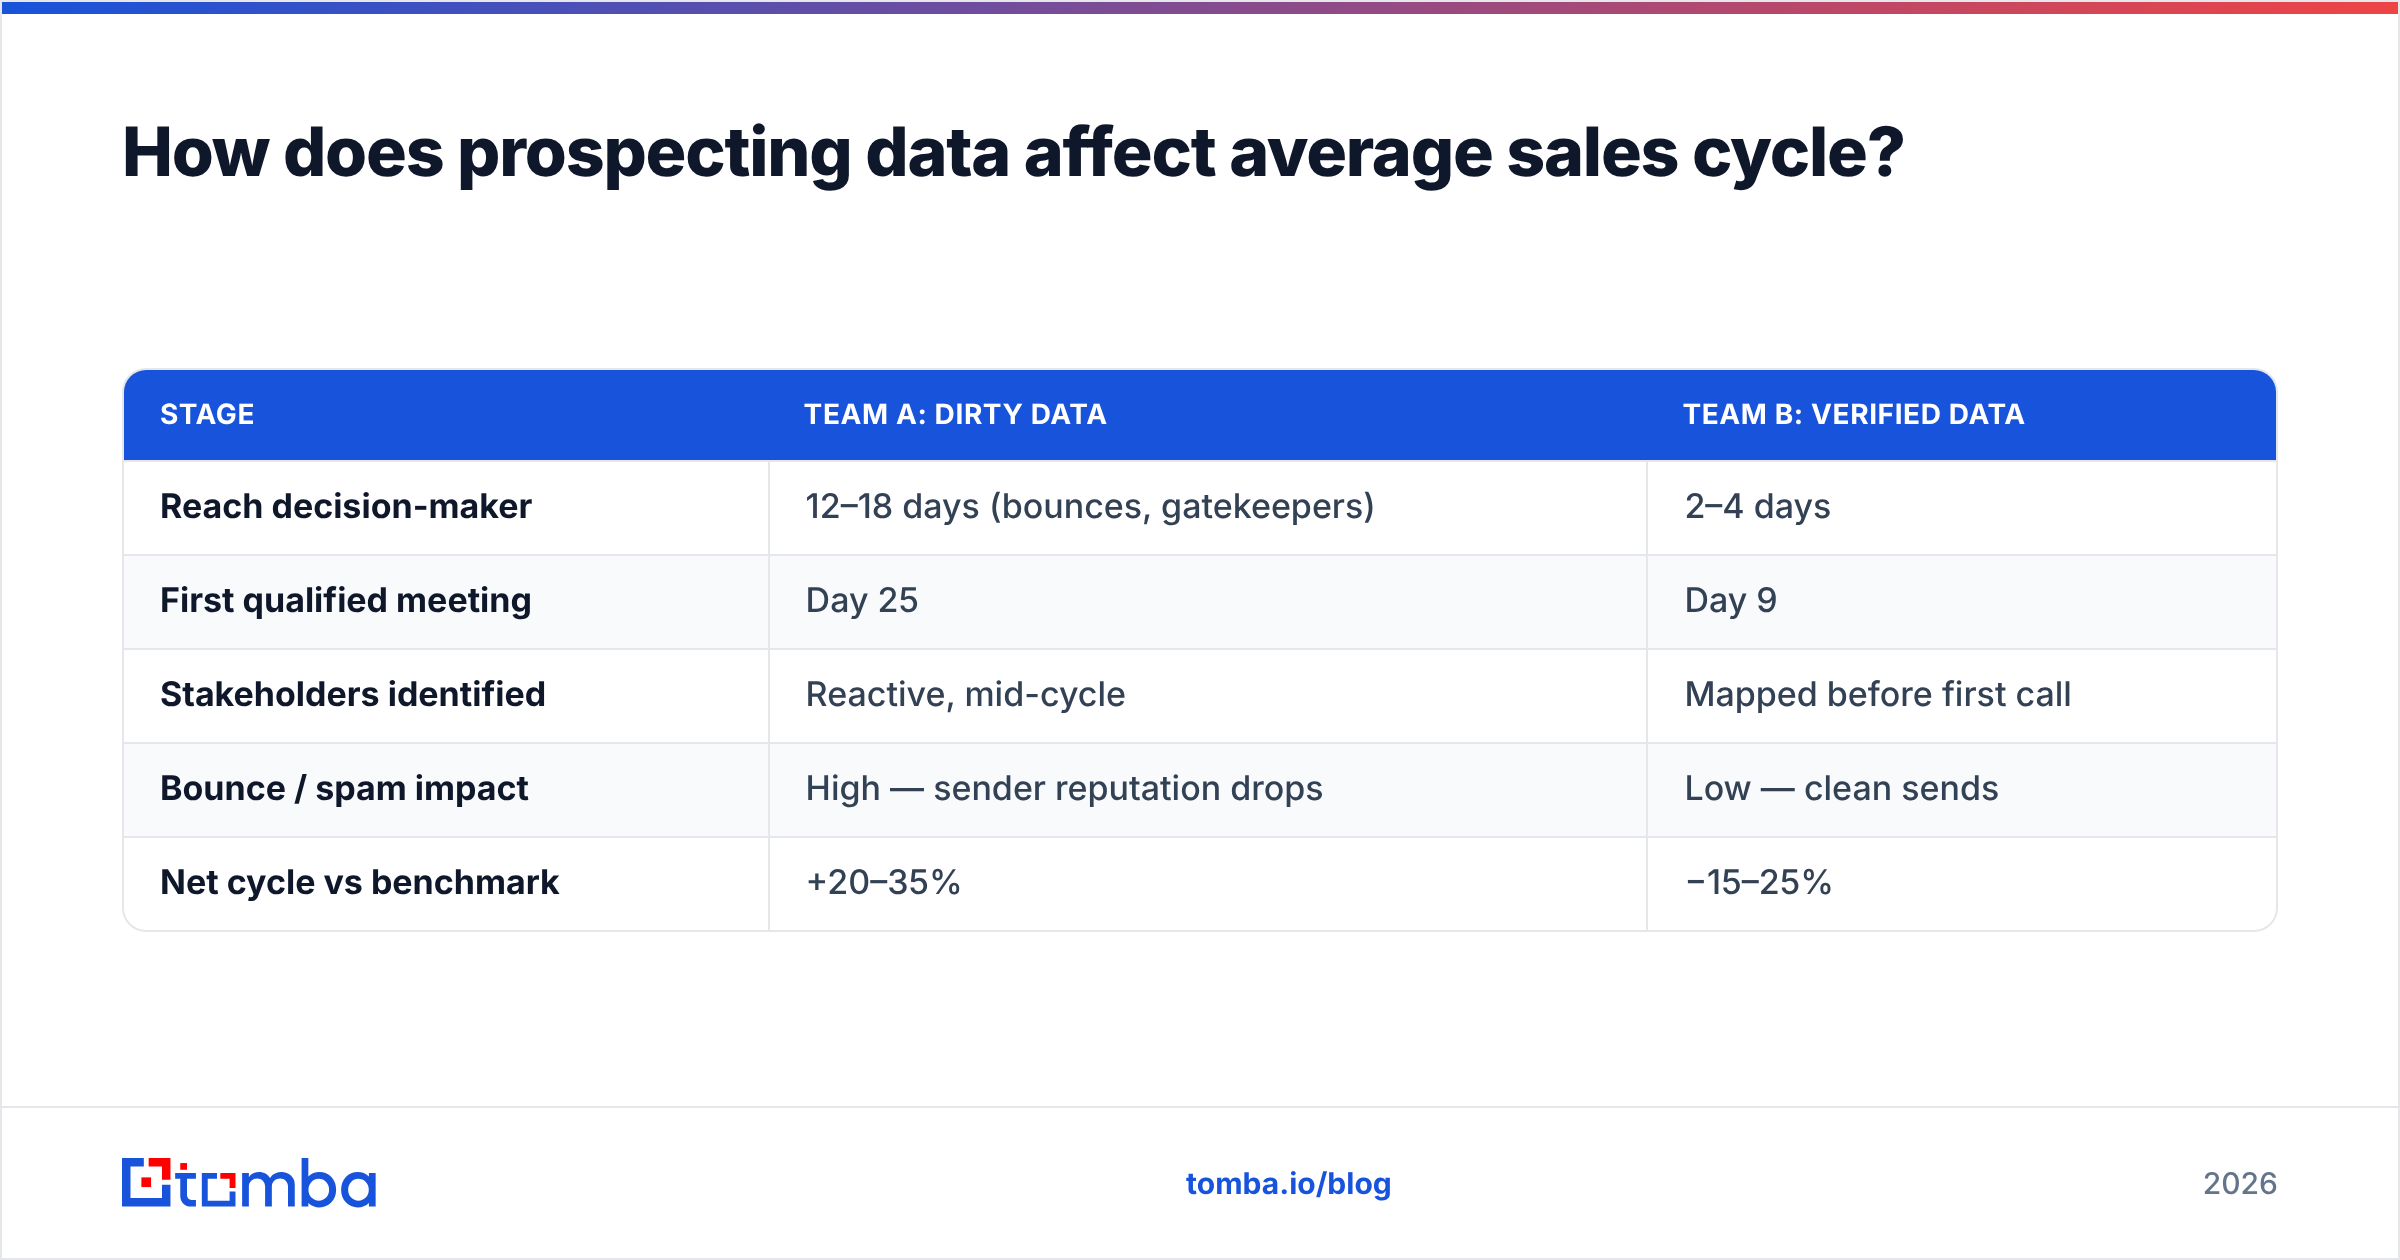
Data quality sits upstream of everything. If the contact is wrong, every downstream stage is delayed. Here's a side-by-side of how two teams with identical reps and identical product experience wildly different cycles based purely on data inputs.
| Stage | Team A: dirty data | Team B: verified data |
|---|---|---|
| Reach decision-maker | 12–18 days (bounces, gatekeepers) | 2–4 days |
| First qualified meeting | Day 25 | Day 9 |
| Stakeholders identified | Reactive, mid-cycle | Mapped before first call |
| Bounce / spam impact | High — sender reputation drops | Low — clean sends |
| Net cycle vs benchmark | +20–35% | −15–25% |
The difference isn't talent; it's inputs. When your list is full of catch-all domains and outdated titles, reps burn the first two weeks just trying to make contact. Verified emails and accurate titles collapse that window. This is why teams that invest in an email verifier and proper data enrichment routinely report shorter early-funnel stages — the deal starts moving on day two instead of day twenty.
It also protects deliverability. A list riddled with invalid addresses tanks your sender reputation, which means even your good emails land in spam, which extends every cycle on the board. Clean data is a compounding advantage.
How can you shorten your average sales cycle in 2026?#
Seven levers, roughly ordered by speed-to-impact:
- Tighten your ICP and qualification. Disqualify faster. A short cycle on a bad-fit deal is still a loss; the goal is fewer, better deals. Score leads before reps invest time.
- Start with verified contact data. Reach the actual decision-maker on the first attempt. Use a reliable email finder and verify before you send so the early stages don't stall on bounces.
- Multithread from day one. Map 4–6 stakeholders early. Single-threaded deals are the ones that vanish for a month when your champion goes dark.
- Use a mutual action plan. Co-author a timeline with the buyer that lists every step to signature, including procurement and security. Surfacing late-stage gates early prevents 30-day surprises.
- Remove friction from evaluation. Pre-built ROI cases, reference customers, and ready security documentation shave weeks off the proof stage.
- Automate the busywork. Sequencing, follow-up reminders, and CRM logging give reps more selling hours and stop deals from going cold between touches.
- Review stalled deals weekly. A simple "what's the next step and who owns it?" cadence catches drift before it becomes a dead quarter.
You won't pull all seven at once. Start with data and qualification — they're upstream of the rest, and improvements there ripple through every later stage. Check your Tomba pricing options if you want to test verified-data prospecting without a long commitment.
How do you benchmark your sales cycle against competitors?#
You can't see a competitor's CRM, so external benchmarks come from aggregated vendor data and analyst research. Treat them as directional. Sources worth checking include HubSpot's sales benchmarks, analyst coverage from Gartner on B2B buying behavior, and peer reviews on G2 that hint at how long evaluations take in your category.
The more reliable benchmark is internal and historical:
- Your own trailing 12 months, segmented by deal type, is the single best predictor of next quarter.
- Cohort comparison — are deals from Q1 closing faster than Q4? That tells you whether your process changes are working.
- Rep-level variance — if your top rep closes 20 days faster than the median, study what they do differently and systematize it.
The point of benchmarking isn't to feel good or bad about a number. It's to find the specific stage where you lag, then attack it. Most teams discover the lag lives in the first two stages — contact and qualification — which loops right back to data quality and targeting.
What metrics should you track alongside cycle length?#
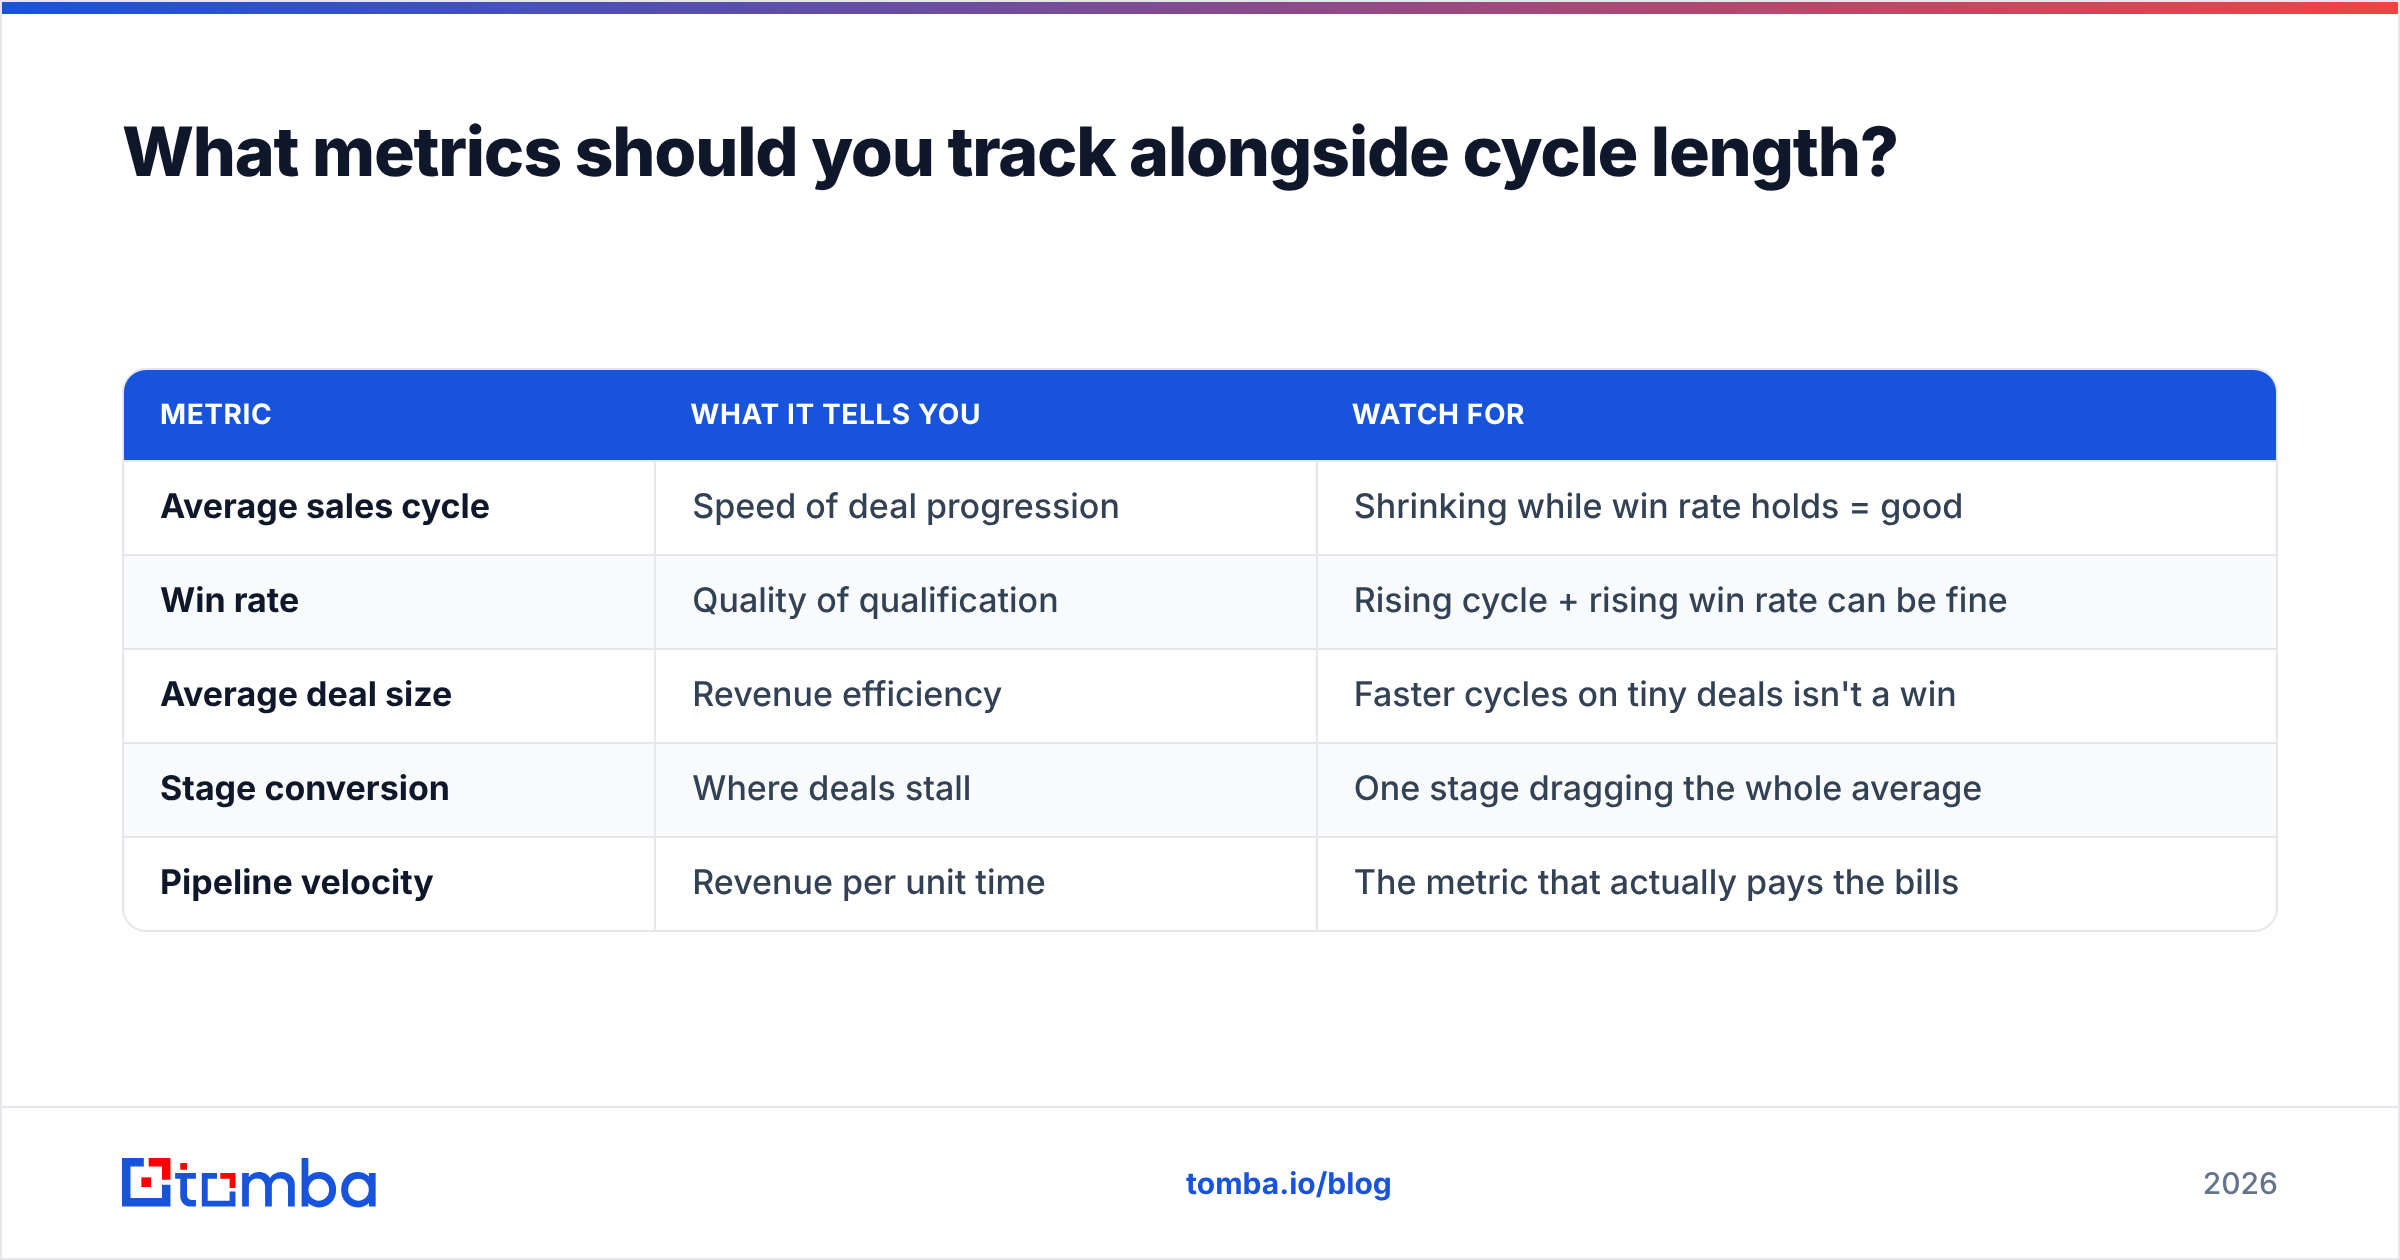
Cycle length in isolation is misleading. A team can "shorten" its cycle simply by closing only easy deals and walking away from big ones. Watch these together:
| Metric | What it tells you | Watch for |
|---|---|---|
| Average sales cycle | Speed of deal progression | Shrinking while win rate holds = good |
| Win rate | Quality of qualification | Rising cycle + rising win rate can be fine |
| Average deal size | Revenue efficiency | Faster cycles on tiny deals isn't a win |
| Stage conversion | Where deals stall | One stage dragging the whole average |
| Pipeline velocity | Revenue per unit time | The metric that actually pays the bills |
Pipeline velocity — deals × win rate × deal size ÷ cycle length — is the one that ties it all together. Shortening the cycle is only valuable if velocity goes up. Optimize for revenue per day, not for a vanity speed record.
The bottom line#
The average sales cycle is a planning tool, not a scoreboard. Know your segmented benchmark, measure it consistently, and attack the specific stage where you lag. For most teams that lag lives at the top of the funnel, where dirty data and loose targeting quietly add weeks before a real conversation ever happens.
Fix the inputs and the whole cycle compresses. If you want reps reaching the right decision-maker on the first attempt instead of the fifth, start with verified contact data. Tomba's Email Finder finds professional emails by domain, name, or company — with verification built in — so your early-funnel stages stop stalling on bounces and gatekeepers. The free tier gives you 25 searches a month to test it against your current list; paid plans start at $49/month when you're ready to scale. Faster contact, cleaner pipeline, shorter cycle.
// get started
Find, verify and enrich your first contacts today
Start on the free plan with 25 searches a month, then scale when your team is ready.
Free plan · No credit card required · GDPR & CCPA
// about the author