Average Selling Price (ASP): How to Calculate It in 2026
Average selling price (ASP) tells you what your deals are really worth. Learn the formula, benchmarks, and how to raise ASP without scaring off buyers.
Average selling price (ASP) is the number that quietly decides how big your business can get. Two companies can close the same number of deals and end the year millions apart — the gap is almost always ASP. Yet most sales teams track win rate, pipeline, and quota attainment obsessively while treating ASP as an afterthought. This guide fixes that.
TL;DR#
- Average selling price (ASP) is total revenue divided by the number of units (or deals) sold over a period. It tells you what a typical transaction is worth.
- The formula is simple, but the segmentation is where the value lives: track ASP by product, segment, channel, and rep — not just one blended number.
- Healthy SaaS ASP benchmarks in 2026 range from roughly $1,200/year for SMB self-serve up to $50,000+ for enterprise.
- You raise ASP through bundling, tiered packaging, multi-year terms, and selling to larger accounts — not just by hiking the list price.
- Bad CRM data silently corrupts ASP. Clean contact and account data is the foundation of every reliable revenue metric.
What is average selling price (ASP)?#
Average selling price is the mean price at which a product or service actually sells, across all transactions in a given window. Think of it like the average bill at a restaurant. The menu lists a $40 steak, but once you factor in the people who only ordered soup, the regulars who split an entrée, and the table that bought three bottles of wine, the real average check might be $31. That real number — not the menu price — is what tells the owner whether the restaurant can pay rent.
ASP is the same idea applied to your deals. Your list price or sticker price is the menu. ASP is what lands in the bank after discounts, downgrades, multi-unit deals, and promotions all wash through. It is one of the most important inputs to revenue forecasting, pricing strategy, and unit economics, because almost every other projection multiplies against it.
The metric shows up under a few names depending on the industry: ASP in hardware and SaaS, "average order value" (AOV) in e-commerce, "average deal size" in field sales. The math is nearly identical; the label changes with context.
How do you calculate average selling price?#
The core formula is one line:
Average Selling Price = Total Revenue ÷ Number of Units Sold
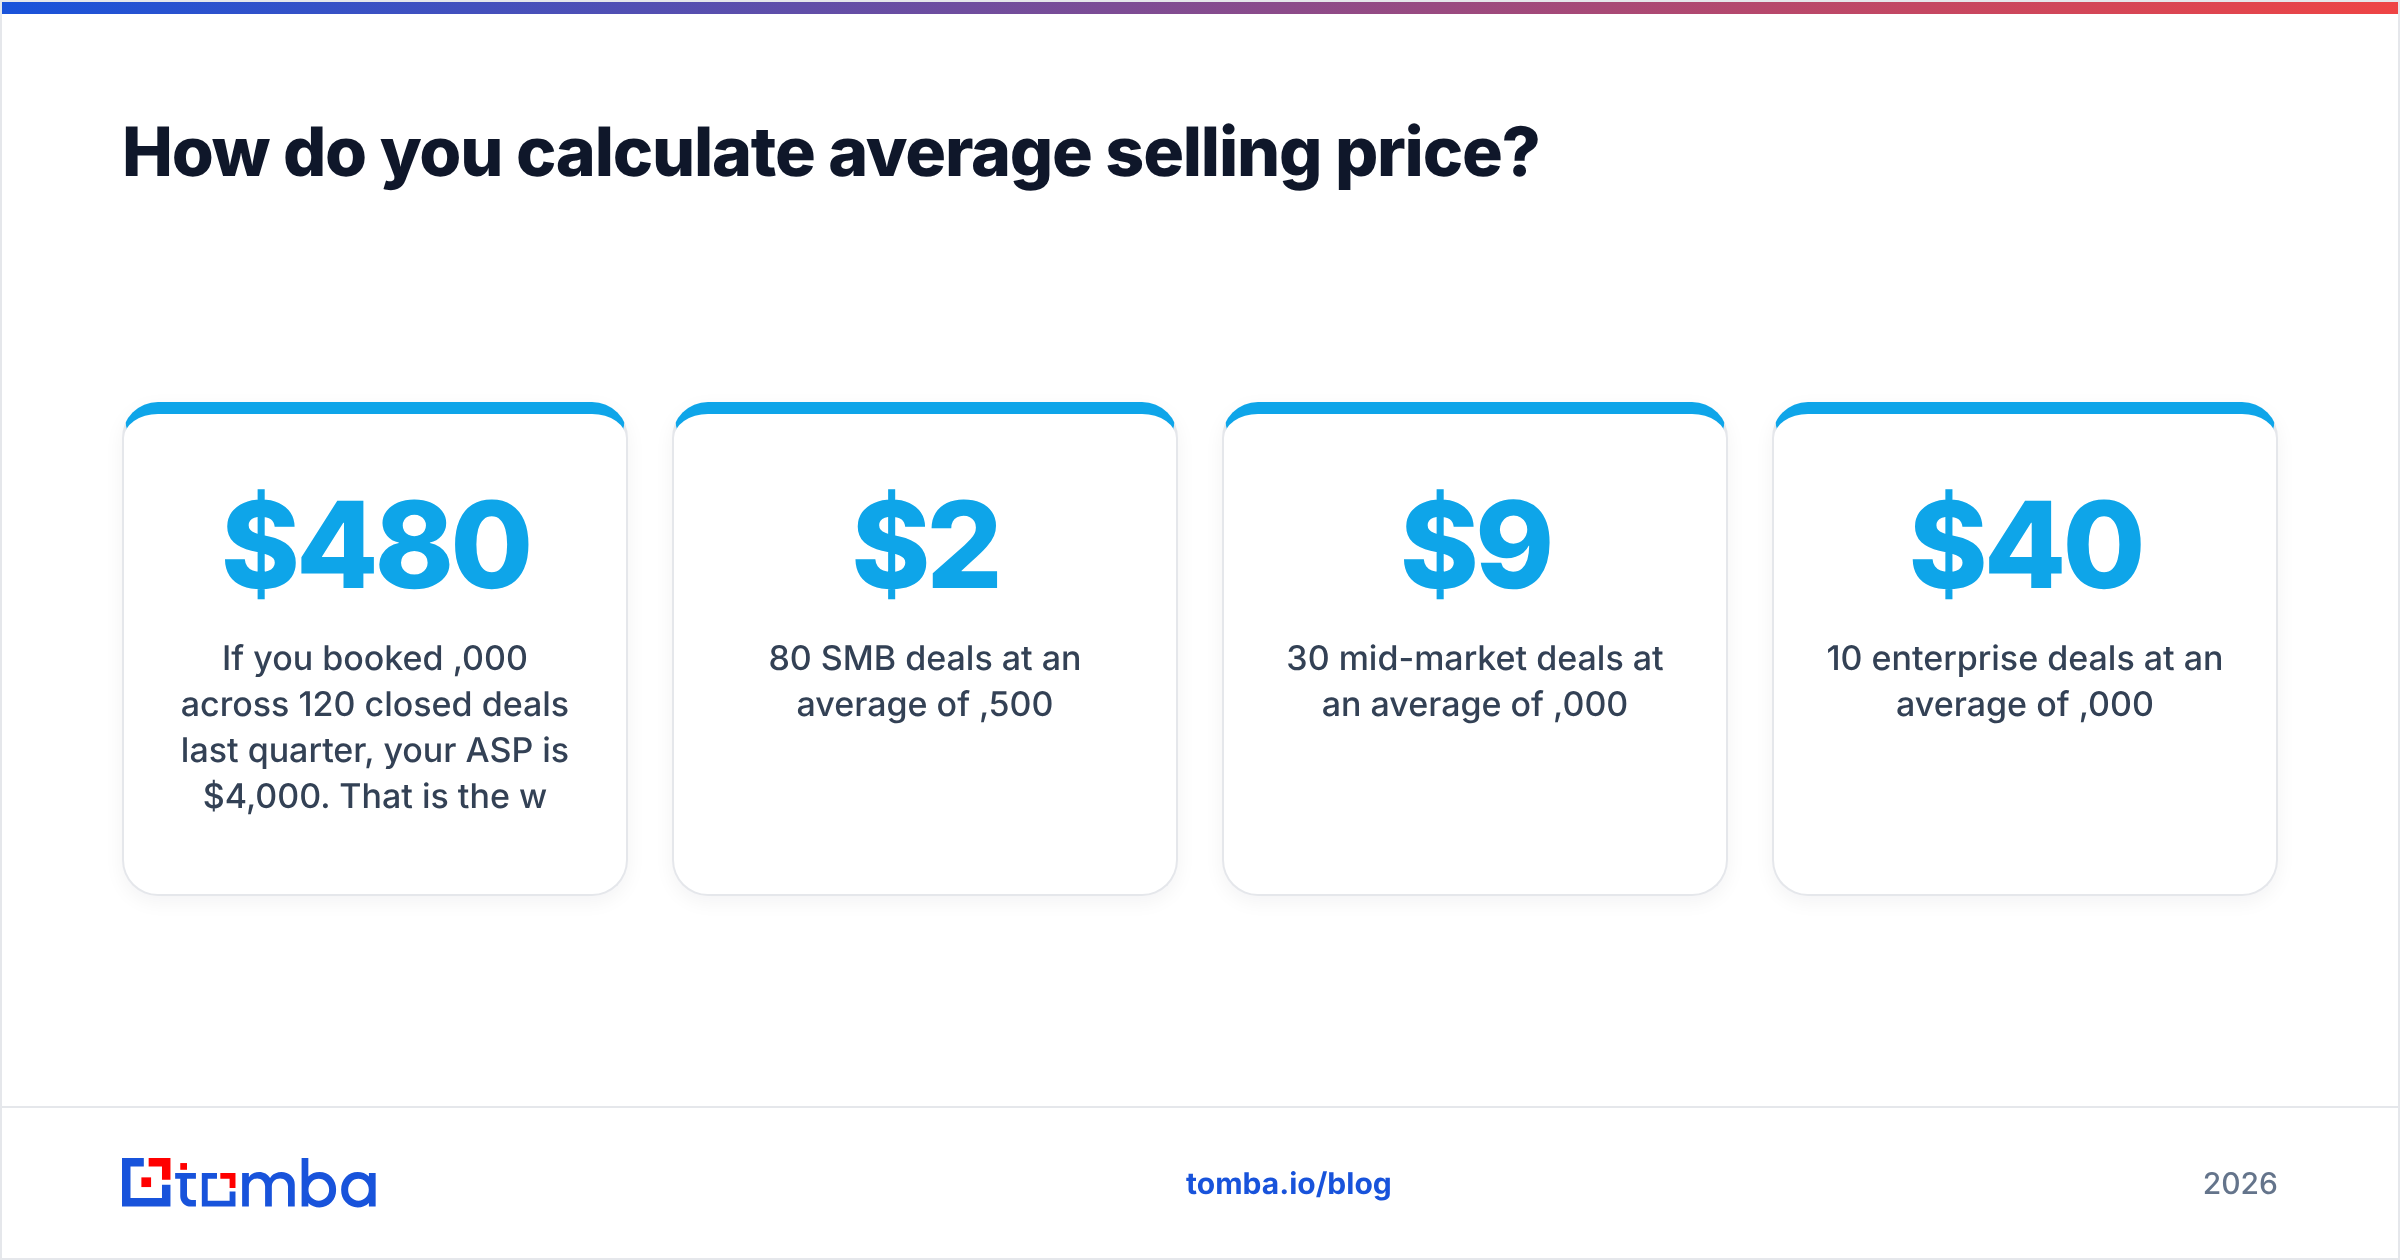
If you booked $480,000 across 120 closed deals last quarter, your ASP is $4,000. That is the whole calculation. The discipline is in deciding what goes into the numerator and denominator.
Here is a practical breakdown of the decisions that change the answer:
- Define the period. Monthly ASP swings wildly on low volume. Quarterly or trailing-12-month windows are more stable for B2B.
- Pick units vs. deals. A SaaS deal might include 50 seats. Decide whether you're averaging per-contract or per-seat — both are valid, they answer different questions.
- Choose gross or net. Net revenue (after discounts and refunds) gives the truest ASP. Gross overstates it.
- Segment before you blend. A single company-wide ASP hides everything useful. Break it down by tier, region, and rep.
- Exclude one-off noise. A single whale deal or a free pilot can distort a small sample. Note outliers separately.
- Reconcile against the CRM. Your ASP is only as accurate as the closed-won data feeding it — which is why account hygiene matters (more on that below).
A worked example#
Say a B2B software company closed the following in Q1:
- 80 SMB deals at an average of $2,500
- 30 mid-market deals at an average of $9,000
- 10 enterprise deals at an average of $40,000
Blended ASP = ($200,000 + $270,000 + $400,000) ÷ 120 = $7,250. But notice: the $7,250 blended figure describes no actual customer. That's why segment-level ASP ($2,500 / $9,000 / $40,000) is what you actually steer the business with.
What is a good average selling price benchmark in 2026?#
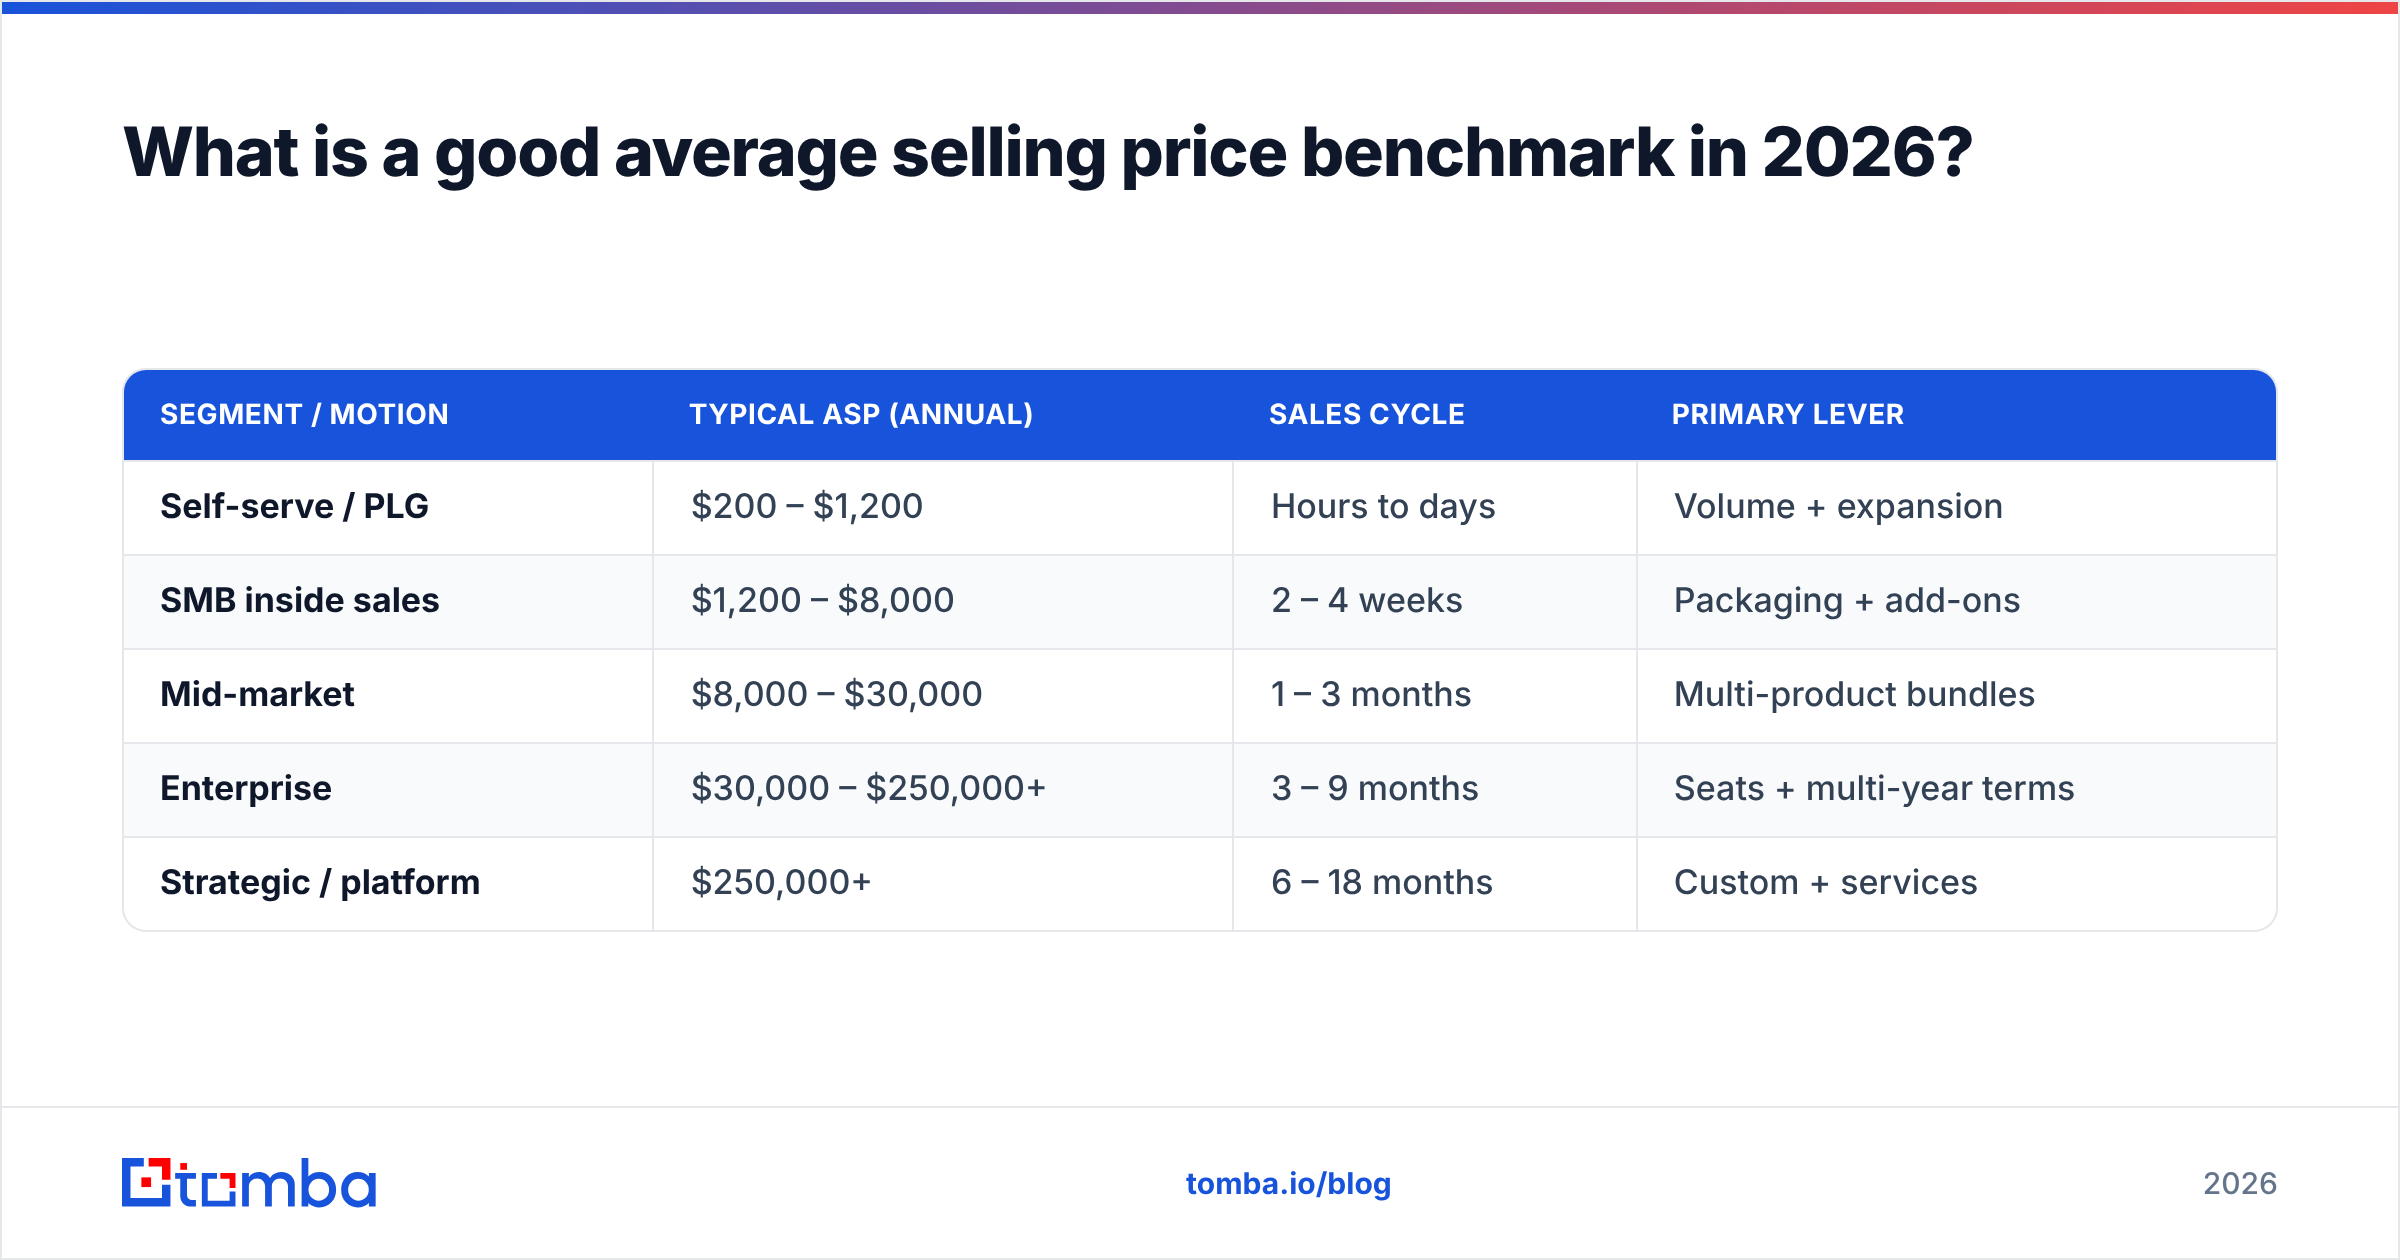
There is no universal "good" ASP — it depends entirely on your motion. A product-led SMB tool should have a low ASP and make money on volume; an enterprise platform should have a high ASP and a longer sales cycle. The table below shows realistic 2026 ranges by go-to-market model.
| Segment / motion | Typical ASP (annual) | Sales cycle | Primary lever |
|---|---|---|---|
| Self-serve / PLG | $200 – $1,200 | Hours to days | Volume + expansion |
| SMB inside sales | $1,200 – $8,000 | 2 – 4 weeks | Packaging + add-ons |
| Mid-market | $8,000 – $30,000 | 1 – 3 months | Multi-product bundles |
| Enterprise | $30,000 – $250,000+ | 3 – 9 months | Seats + multi-year terms |
| Strategic / platform | $250,000+ | 6 – 18 months | Custom + services |
Use these as orientation, not law. The number that matters most is your own ASP trend — quarter over quarter, by segment. A rising ASP with stable win rates is one of the cleanest signals of a healthy go-to-market engine. For broader context on how vendors price, the G2 software pricing benchmarks and Gartner market guides are reasonable external reference points.
Why does average selling price matter so much?#
Because ASP multiplies. It sits inside almost every model you care about:
- Revenue forecast = pipeline × win rate × ASP. A 10% ASP lift flows straight to the top line with no extra leads.
- CAC payback improves as ASP rises, because you recover acquisition cost faster per deal.
- Rep capacity planning depends on it — a team that needs 40 deals at $5K ASP needs only 20 deals at $10K ASP for the same quota.
- Valuation for SaaS leans on ASP stability; investors read rising ASP as evidence of pricing power and upmarket motion.
This is also where your win rate and ASP have to be read together. Discounting to win more deals lifts win rate but can quietly erode ASP until total revenue stalls. The healthy version is the opposite: ASP climbs while win rate holds.
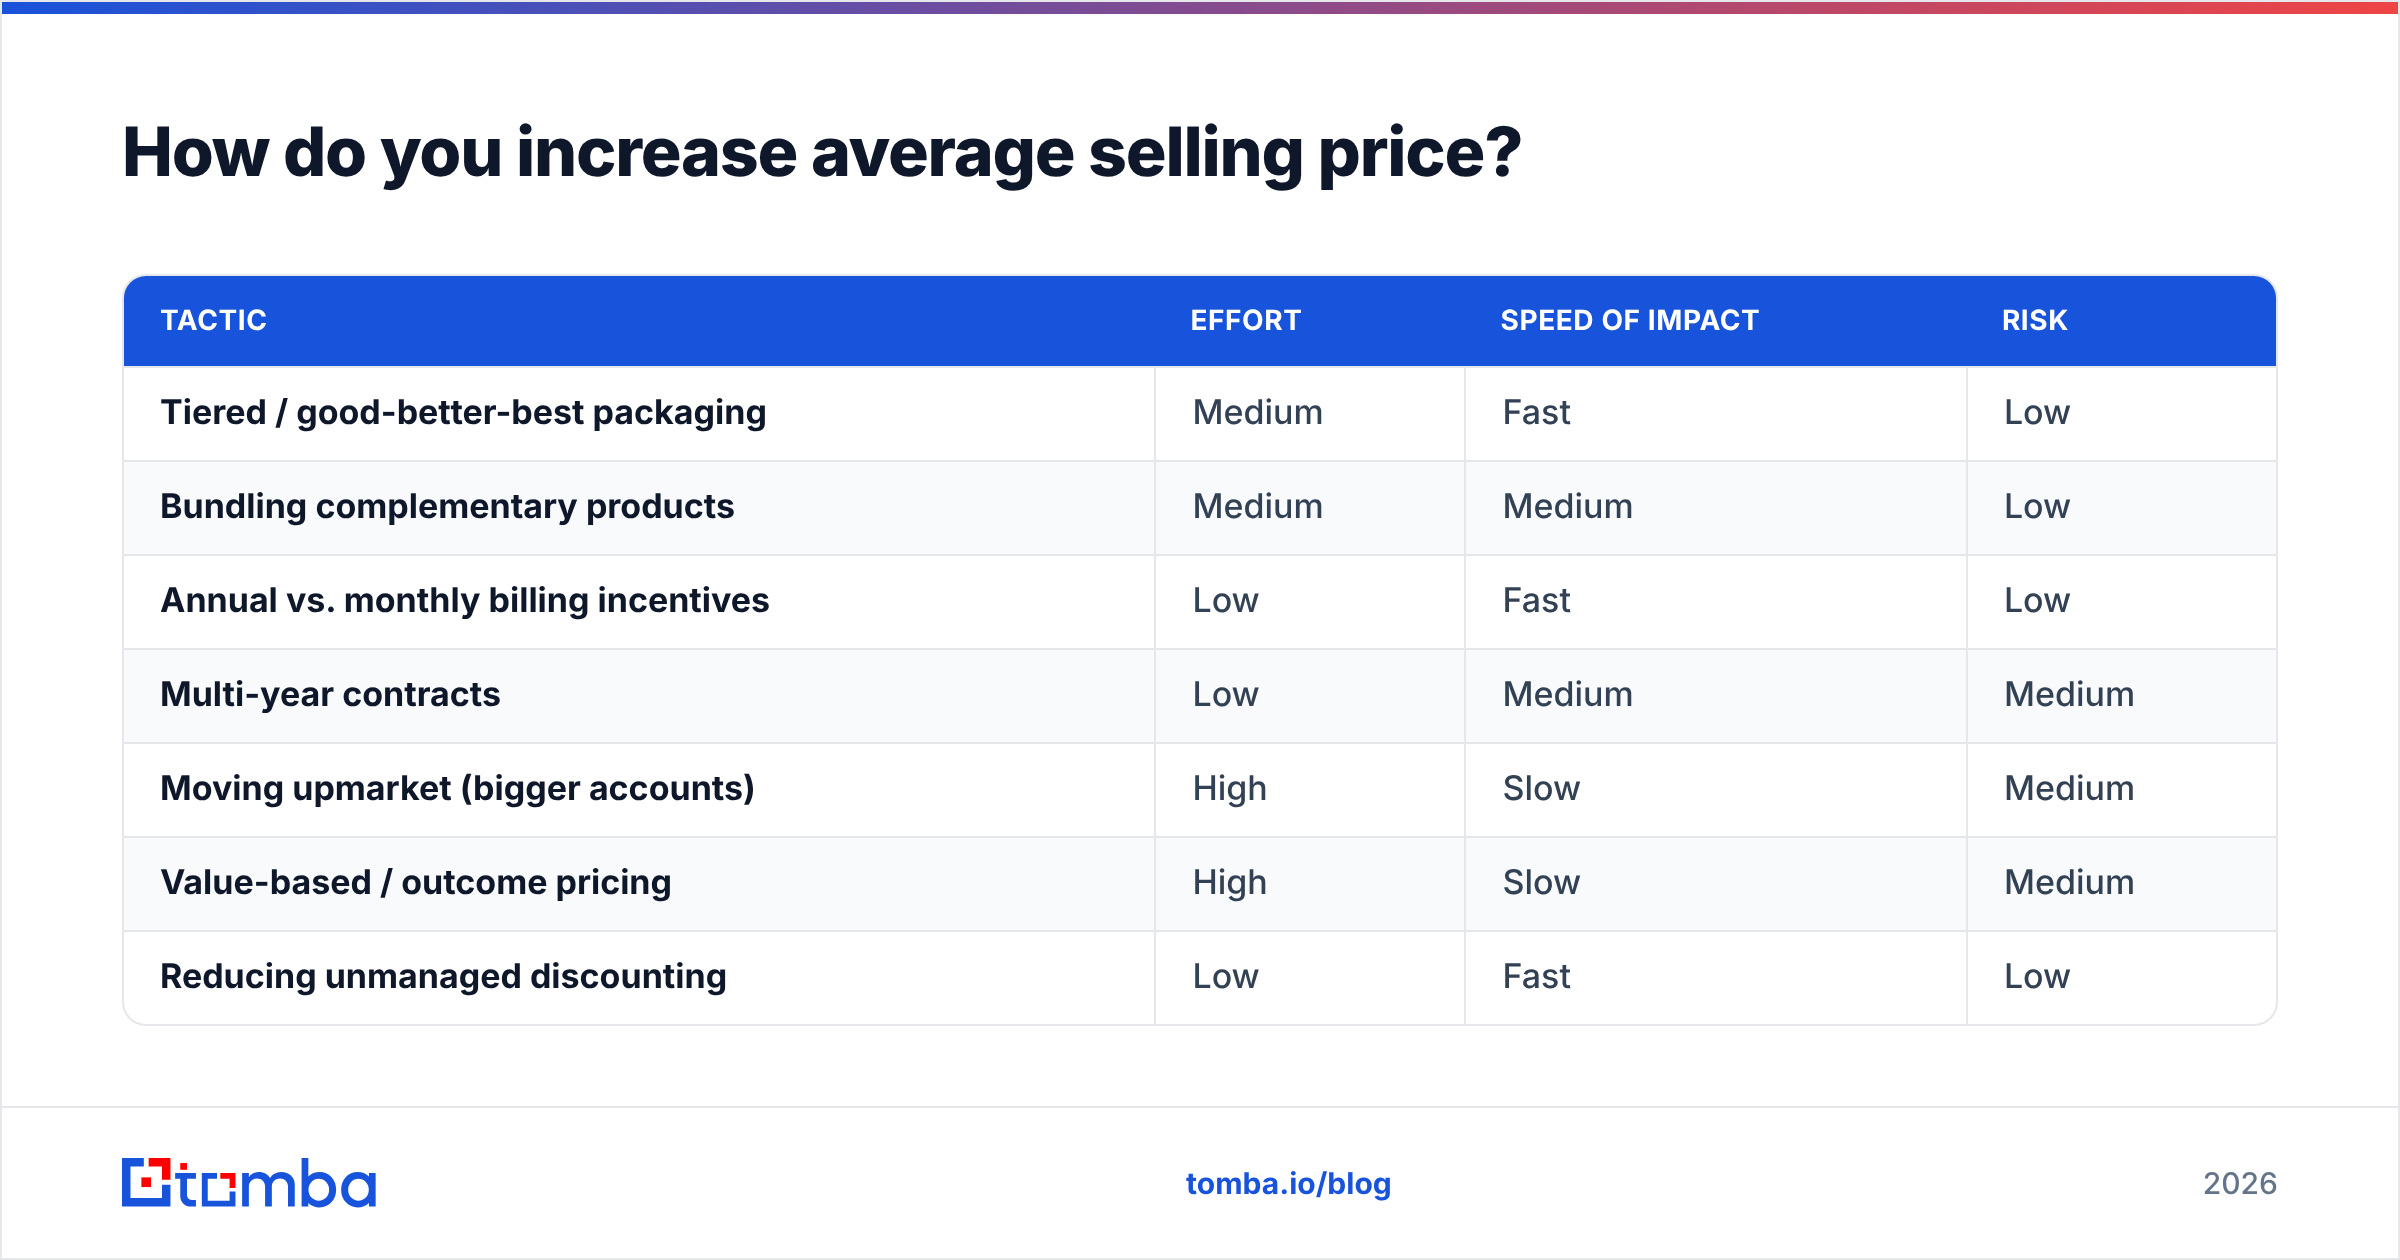
How do you increase average selling price?#
You raise ASP in two broad ways: sell the same thing for more, or sell more valuable things. The second is almost always more durable. Here are the proven levers, roughly in order of how fast they work.
| Tactic | Effort | Speed of impact | Risk |
|---|---|---|---|
| Tiered / good-better-best packaging | Medium | Fast | Low |
| Bundling complementary products | Medium | Medium | Low |
| Annual vs. monthly billing incentives | Low | Fast | Low |
| Multi-year contracts | Low | Medium | Medium |
| Moving upmarket (bigger accounts) | High | Slow | Medium |
| Value-based / outcome pricing | High | Slow | Medium |
| Reducing unmanaged discounting | Low | Fast | Low |
A few of these deserve emphasis. Discount discipline is the cheapest ASP win available — most teams leak 5–15% of ASP to discounts that were never needed to close the deal. Packaging is the most repeatable: a clean good-better-best structure nudges a predictable share of buyers up a tier. And moving upmarket is the highest ceiling, but it changes everything — your targeting, your data, your messaging. HubSpot's research on sales pricing strategy is a solid primer if you're rebuilding packaging from scratch.
How does data quality affect average selling price?#
Directly — and it's the lever most teams ignore. ASP is a calculated metric, which means it inherits every error in the data underneath it. If your CRM is full of duplicate accounts, mis-tagged segments, and deals attributed to the wrong product line, your ASP is fiction. You'll "optimize" against a number that doesn't reflect reality.
There's also an acquisition angle. Moving upmarket — the single highest ASP lever — depends on reaching larger, harder-to-find buyers. You can't lift ASP into the enterprise band if your top-of-funnel only ever surfaces SMB contacts. That's where prospecting data does real work:
- Accurate, verified contacts mean reps spend time selling to qualified larger accounts instead of chasing bounces.
- Data enrichment appends firmographics (company size, revenue, industry) so you can target the higher-ASP segments deliberately rather than by luck.
- A clean, deduplicated B2B database keeps your closed-won records — and therefore your ASP math — trustworthy.
Put plainly: you cannot raise a metric you cannot measure correctly. Data hygiene is the unglamorous prerequisite for every ASP tactic above it.
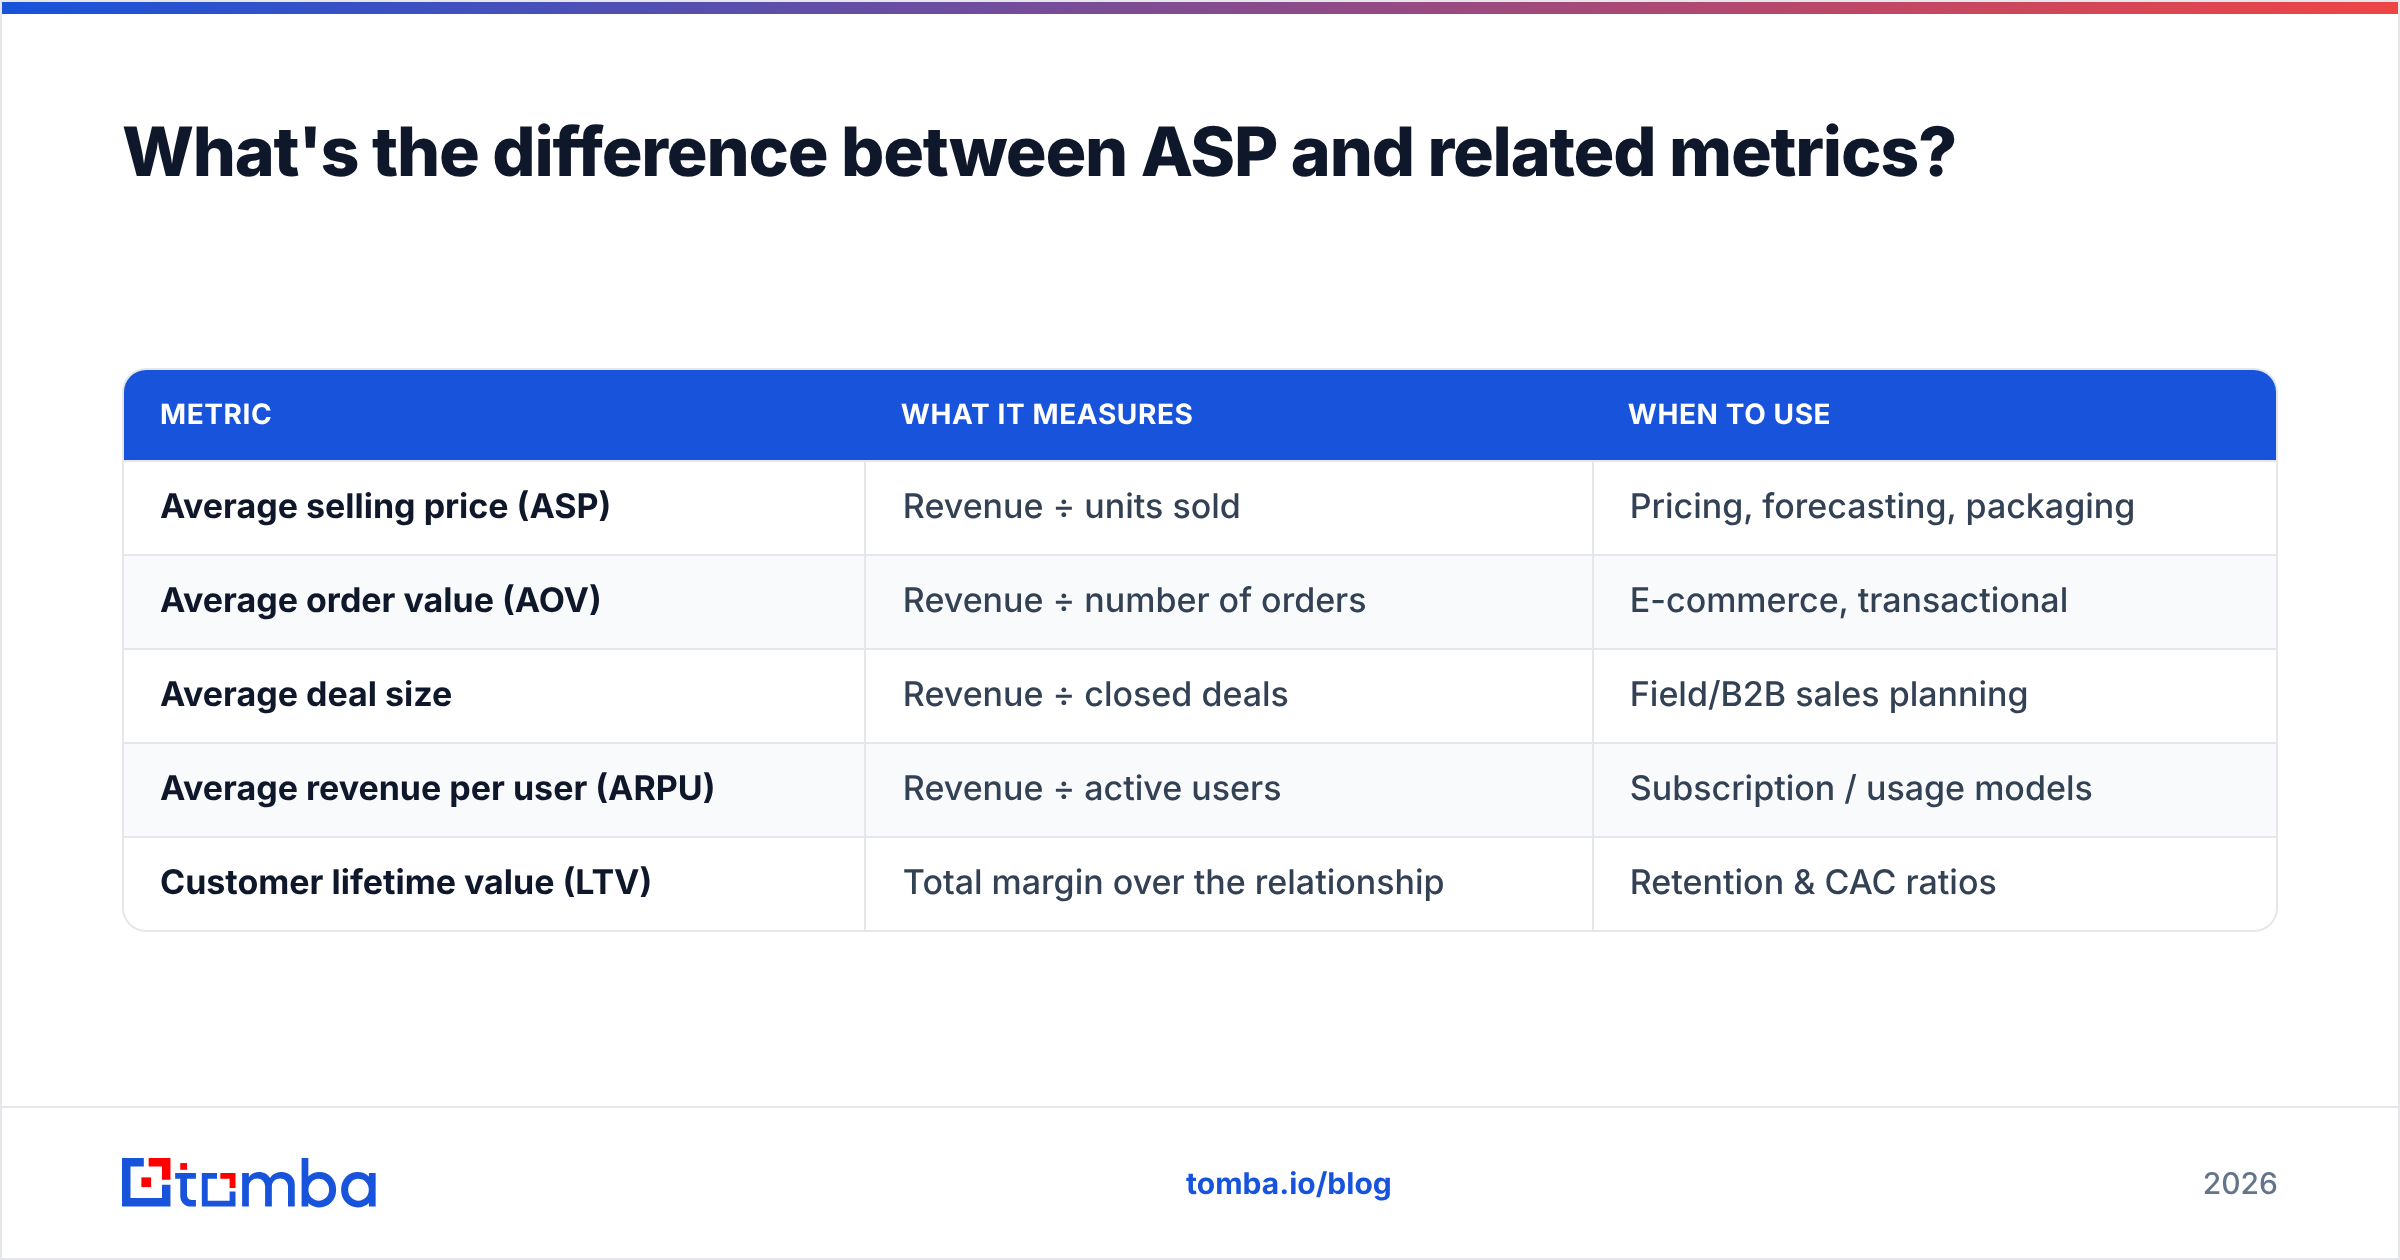
What's the difference between ASP and related metrics?#
ASP gets confused with a handful of neighbors. Here's how they separate:
| Metric | What it measures | When to use |
|---|---|---|
| Average selling price (ASP) | Revenue ÷ units sold | Pricing, forecasting, packaging |
| Average order value (AOV) | Revenue ÷ number of orders | E-commerce, transactional |
| Average deal size | Revenue ÷ closed deals | Field/B2B sales planning |
| Average revenue per user (ARPU) | Revenue ÷ active users | Subscription / usage models |
| Customer lifetime value (LTV) | Total margin over the relationship | Retention & CAC ratios |
The key distinction: ASP and AOV are transaction-level snapshots, while ARPU and LTV are relationship-level over time. A subscription business needs both — ASP to understand the entry deal, LTV to understand the full economics. Mixing them up leads to underpricing, because you justify a low ASP with a high LTV that hasn't materialized yet.
How often should you review average selling price?#
Review blended ASP monthly for direction, and segmented ASP quarterly for decisions. Monthly catches drift early — a sudden ASP drop often signals unauthorized discounting or a mix shift toward smaller deals before it shows up in revenue. Quarterly segmented reviews are where you actually act: re-tier packaging, adjust target accounts, or coach reps whose deal sizes lag the team.
Tie the review to your CRM's closed-won pipeline so the number is always reconciled against source data, not a stale spreadsheet. If you're pulling contact and account data into that CRM, keeping it verified and current prevents the slow rot that makes quarter-over-quarter ASP comparisons meaningless.
Common mistakes that distort ASP#
- Blending everything into one number. A single company-wide ASP hides the segment story entirely.
- Ignoring discounts. Tracking list price instead of net realized price overstates ASP and hides margin leakage.
- Letting outliers dominate. One whale on low volume can inflate ASP and mask a weak quarter.
- Forgetting mix shift. ASP can fall purely because you sold more small deals — not because pricing changed.
- Trusting dirty CRM data. Duplicates and mis-tagged deals quietly poison the calculation.
Final takeaway and where to start#
Average selling price is the highest-leverage number most teams underuse. Calculate it correctly (net revenue, segmented, reconciled to source data), benchmark it against your motion rather than a vanity target, and then move it deliberately through packaging, discount discipline, and an upmarket push.
That upmarket push is the part that depends on prospecting data. To consistently reach the larger accounts that raise your ASP, you need verified contacts at the companies that fit your higher tiers. Tomba Email Finder helps you find and verify professional emails by company and domain, so your reps spend their time selling to the right, higher-value buyers instead of cleaning up bounces. Pair it with enrichment to target the segments that lift your ASP — and check the Tomba pricing plans, starting free at 25 searches a month and scaling to Starter at $49/mo when you're ready to grow your pipeline upmarket.
Ready to find emails that actually work?
Join 150,000+ professionals who stopped guessing and started sending. Free credits on signup — no credit card required.
Get the Tomba newsletter
Practical outbound tactics and product updates — once every two weeks.
About the author