B2B Conversion Rates in 2026: Benchmarks and How to Improve
What counts as a good B2B conversion rate in 2026? See real benchmarks by channel and funnel stage, plus the data-quality fixes that move the needle fastest.
B2B conversion rates are the percentage of prospects who move from one funnel stage to the next, all the way to closed-won. They are the cleanest signal you have for whether your pipeline is healthy or quietly leaking revenue. The problem is that most teams compare themselves to the wrong number, fix the wrong stage, and never touch the input that distorts every rate in the funnel: the quality of their contact data.
This guide gives you real 2026 benchmarks by channel and stage, the math to calculate your own rates correctly, and a prioritized list of fixes that actually move conversion.
TL;DR#
- Median B2B website-to-lead conversion sits around 2–3%, lead-to-MQL near 30–40%, and MQL-to-closed-won between 1% and 6% depending on deal size and motion.
- A "good" rate is relative. Self-serve SaaS, enterprise sales, and high-ticket services have completely different benchmarks. Compare against your motion, not a generic average.
- Bad data is the silent conversion killer. Bounced emails, wrong contacts, and stale records inflate your top-of-funnel and crater downstream rates.
- The fastest wins are usually mid-funnel — speed-to-lead, follow-up cadence, and reaching the right person — not another landing-page color test.
- Clean inputs first. Verified emails and enriched contact records raise every conversion rate that depends on actually reaching a human.
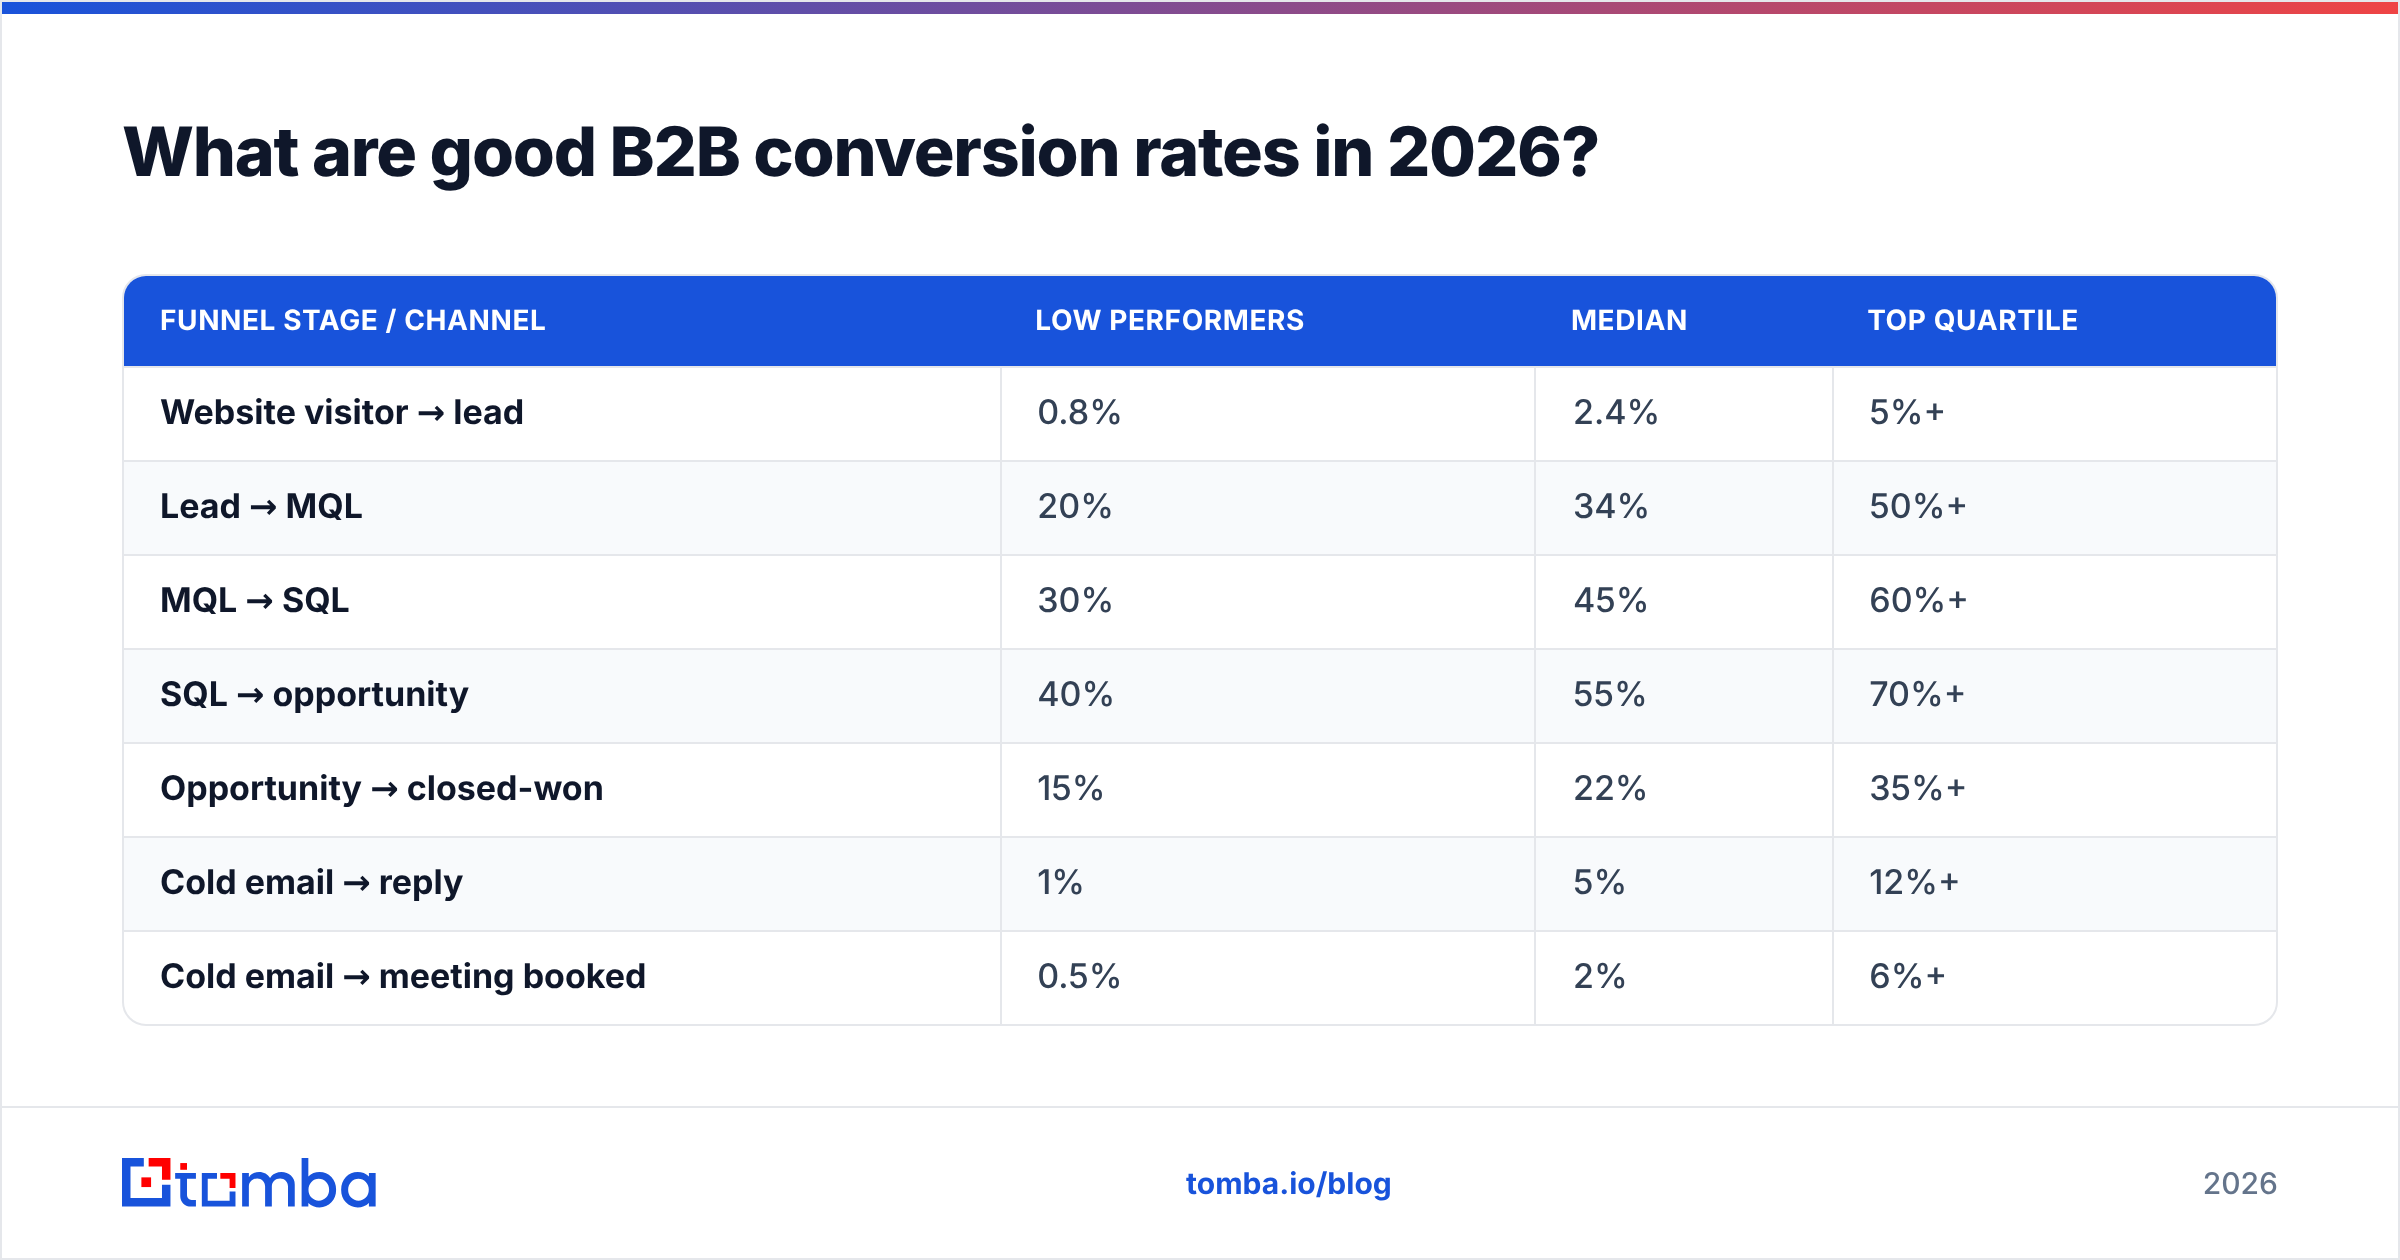
What are good B2B conversion rates in 2026?#
The honest answer: "good" depends on your channel, deal size, and sales motion. A 2% conversion rate is a disaster for a product-led free trial and a triumph for outbound cold email into enterprise accounts.
That said, you need reference points. Below are blended 2026 benchmarks drawn from public B2B reporting and aggregated vendor data. Treat them as a starting line, not a finish line.
| Funnel stage / channel | Low performers | Median | Top quartile |
|---|---|---|---|
| Website visitor → lead | 0.8% | 2.4% | 5%+ |
| Lead → MQL | 20% | 34% | 50%+ |
| MQL → SQL | 30% | 45% | 60%+ |
| SQL → opportunity | 40% | 55% | 70%+ |
| Opportunity → closed-won | 15% | 22% | 35%+ |
| Cold email → reply | 1% | 5% | 12%+ |
| Cold email → meeting booked | 0.5% | 2% | 6%+ |
A few things jump out. First, the biggest drop-offs cluster at the very top (visitor-to-lead) and the very bottom (opportunity-to-won). Second, channel matters enormously: organic and referral leads routinely convert 2–3x better than paid or cold-sourced leads because intent is higher.
For deeper definitions of the metrics behind these stages, the Tomba B2B glossary breaks down terms like marketing qualified lead and win rate without the jargon.
How do you calculate B2B conversion rates correctly?#
Conversion rate is simple arithmetic, but the denominator is where teams lie to themselves.
The base formula:
Conversion rate = (conversions ÷ total entries at that stage) × 100
The five rules that keep the number honest:
- Match the time window. If you count this month's closed deals against this month's new leads, you mix cohorts. Long B2B cycles mean today's wins came from leads sourced months ago. Use cohort-based tracking.
- Count people, not events. One prospect who fills three forms is one lead, not three. Deduplicate before you divide.
- Exclude junk from the denominator carefully. Bots and obvious spam inflate "visitors"; fake form-fills inflate "leads." But don't quietly delete real misses to flatter the rate.
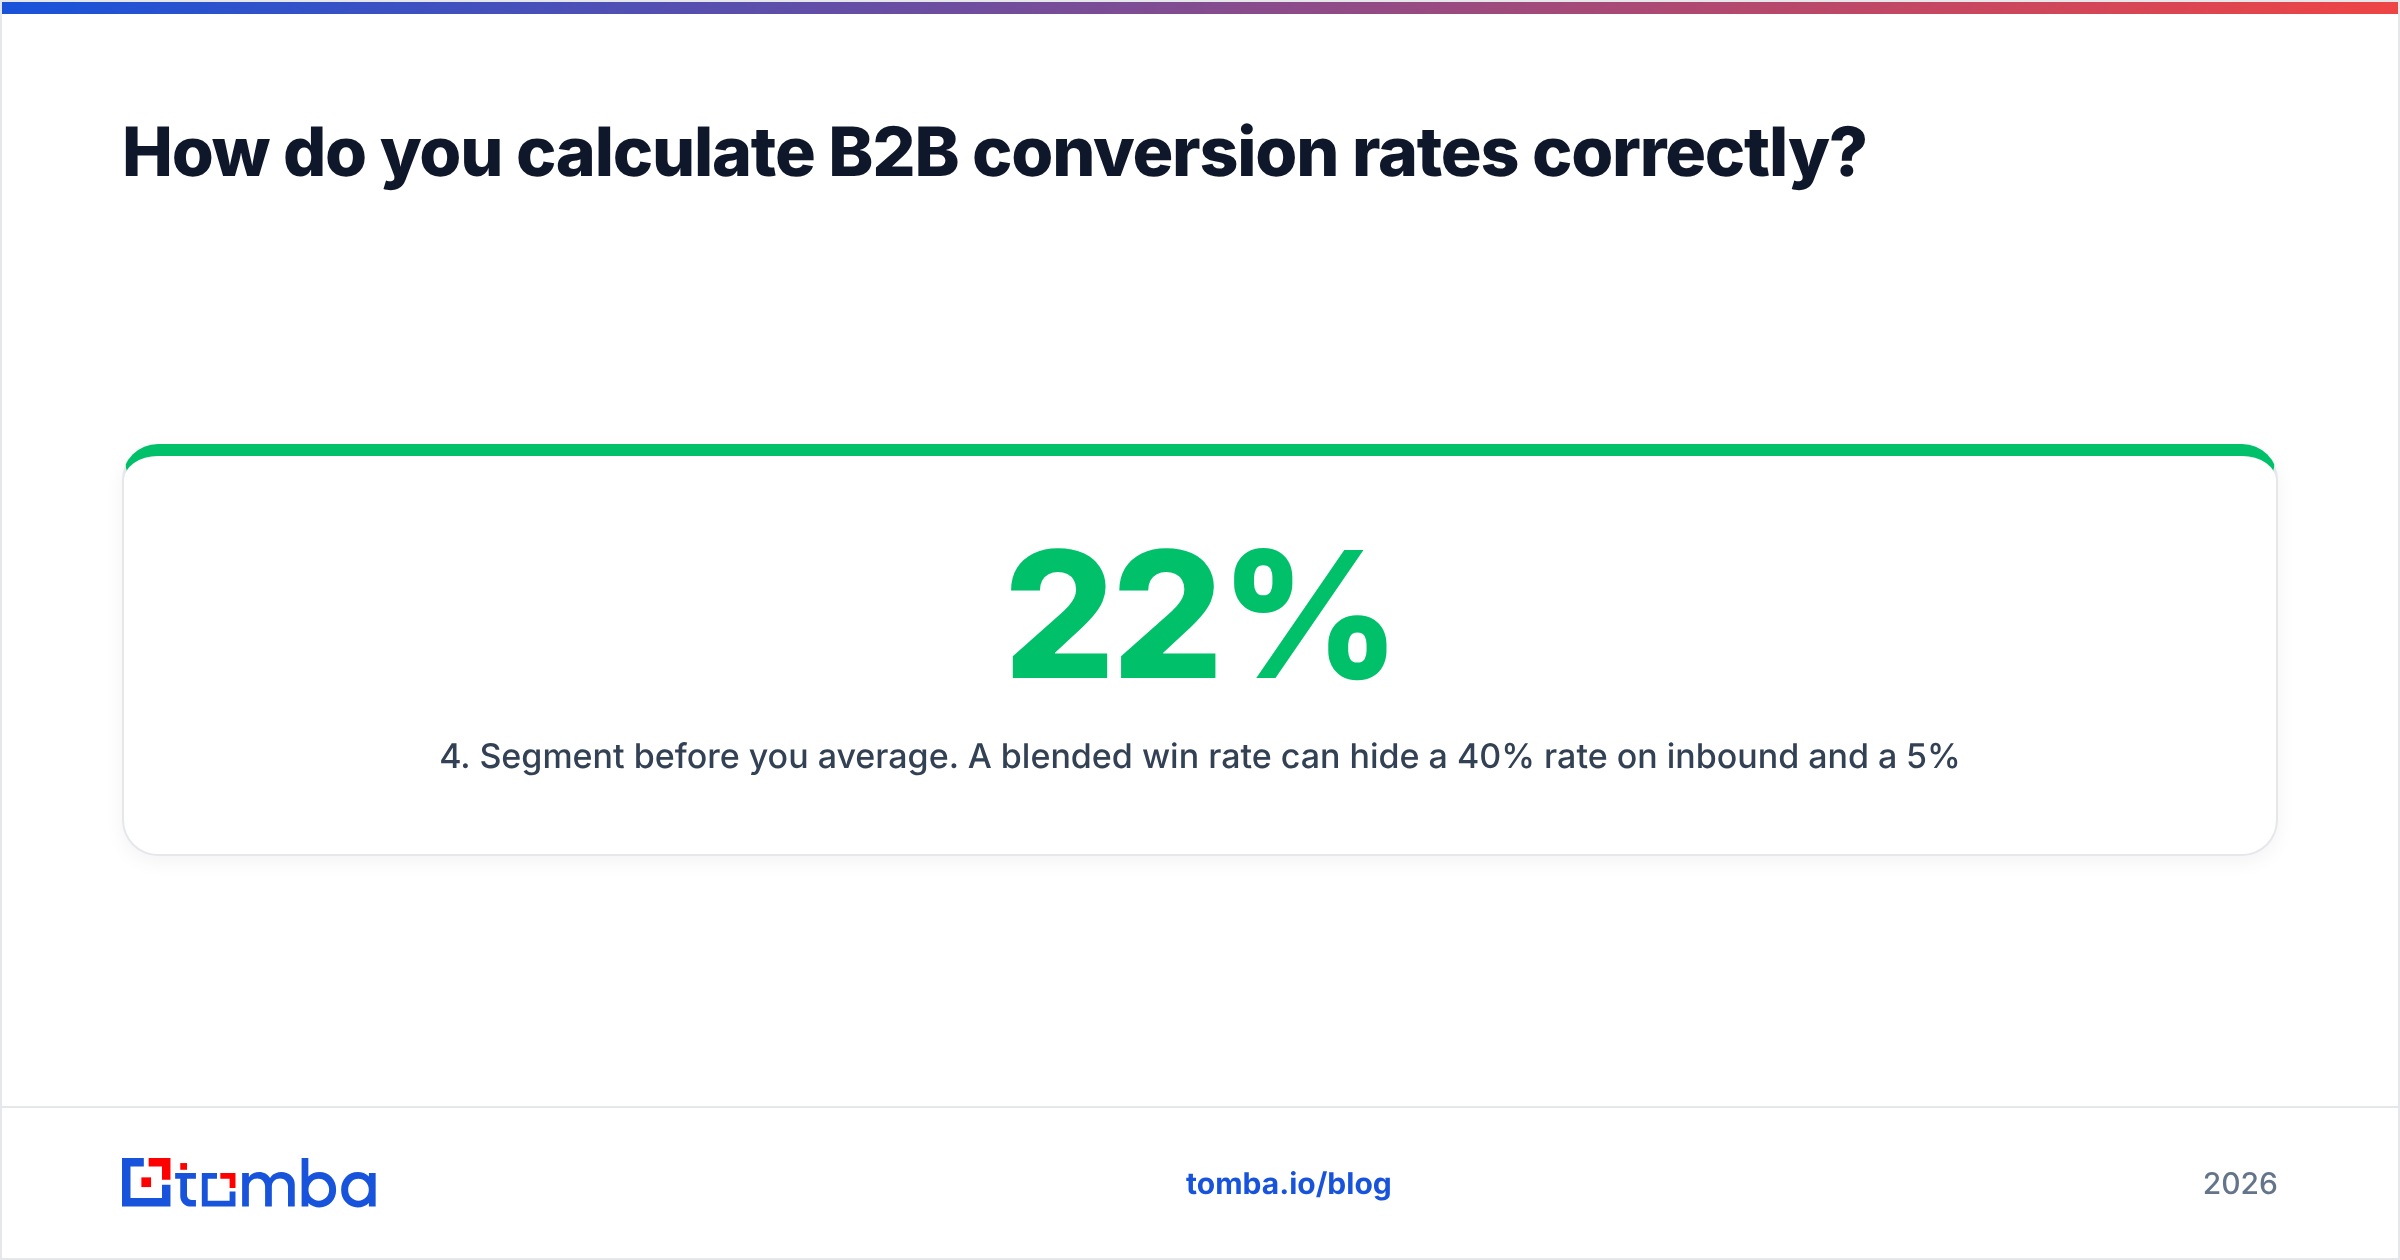
- Segment before you average. A blended 22% win rate can hide a 40% rate on inbound and a 5% rate on outbound. The average tells you nothing actionable.
- Tie every stage to a single source of truth. If marketing and sales count MQLs differently, your handoff rate is fiction.
Think of it like measuring a leaky bucket. The total flow out the bottom is meaningless until you know which seam is leaking and how fast. Stage-by-stage rates are how you find the seam.
Why are your B2B conversion rates lower than the benchmarks?#
Most underperformance traces back to one of four root causes, and only one of them is "the offer is bad."
- You're reaching the wrong person. A perfect pitch sent to a junior coordinator who can't buy converts at near zero. Title and seniority targeting beats clever copy.
- You can't reach anyone at all. Bounced and invalid emails never get counted as a "miss" — they vanish. If 25% of your list bounces, your real reply rate is far worse than your dashboard shows.
- You're too slow. Speed-to-lead is brutal in B2B. Responding within five minutes versus an hour can multiply contact rates. Most teams average hours or days.
- You quit too early. The majority of B2B replies come after the first message. Teams that stop at one or two touches leave most of their conversions on the table.
Notice that three of these four are upstream of any copywriting or design work. That's why "optimize the landing page" is usually the wrong first move.

Which B2B conversion rate should you fix first?#
Fix the stage with the worst rate relative to its benchmark and the highest volume flowing through it. That's it — don't optimize a stage that's already top-quartile, and don't pour effort into a stage that only 12 people reach per quarter.
Here's the priority framework most RevOps teams converge on:
- Reachability — Are your contacts real and current? This gates everything downstream. Start here because it's cheap and high-leverage.
- Targeting fit — Are you contacting people who match your ICP and have buying authority? Wrong-fit leads cap every later stage.
- Speed and cadence — How fast do you respond, and how many quality touches do you make? Mid-funnel mechanics convert known interest into meetings.
- Message and offer — Only after the above is the copy/offer test worth running, because now you're measuring it against a clean, well-targeted, well-followed-up audience.
The order matters. Running a subject-line A/B test on a list that's 25% invalid means you're measuring noise. Clean the inputs, then measure the message.
How does data quality change your B2B conversion rates?#
Data quality is the multiplier sitting underneath every rate in the funnel. It rarely shows up on a conversion dashboard, which is exactly why it's so often ignored.
Walk through the mechanics. You buy or scrape a list of 1,000 contacts. If 250 emails are invalid, your outbound platform attempts 1,000 sends but only 750 can ever land. Worse, the bounces hammer your sender reputation, so some of the valid 750 land in spam. Now your "5% reply rate" is calculated against 1,000 — but the real denominator of deliverable, seen messages might be 600. Your true performance is masked, and your domain reputation is quietly degrading.
This is why verification and enrichment aren't "nice to have." Running every address through an email verifier before send removes invalids from the equation, protects deliverability, and gives you a denominator you can trust. Layering in data enrichment — title, company size, location — lets you segment so you measure ICP-fit conversion instead of a meaningless blended average.
The compounding effect is real. According to research aggregated by HubSpot, companies that prioritize lead quality over raw volume consistently report higher downstream conversion and shorter cycles. Analyst coverage from Gartner similarly ties go-to-market efficiency to data accuracy and CRM hygiene.

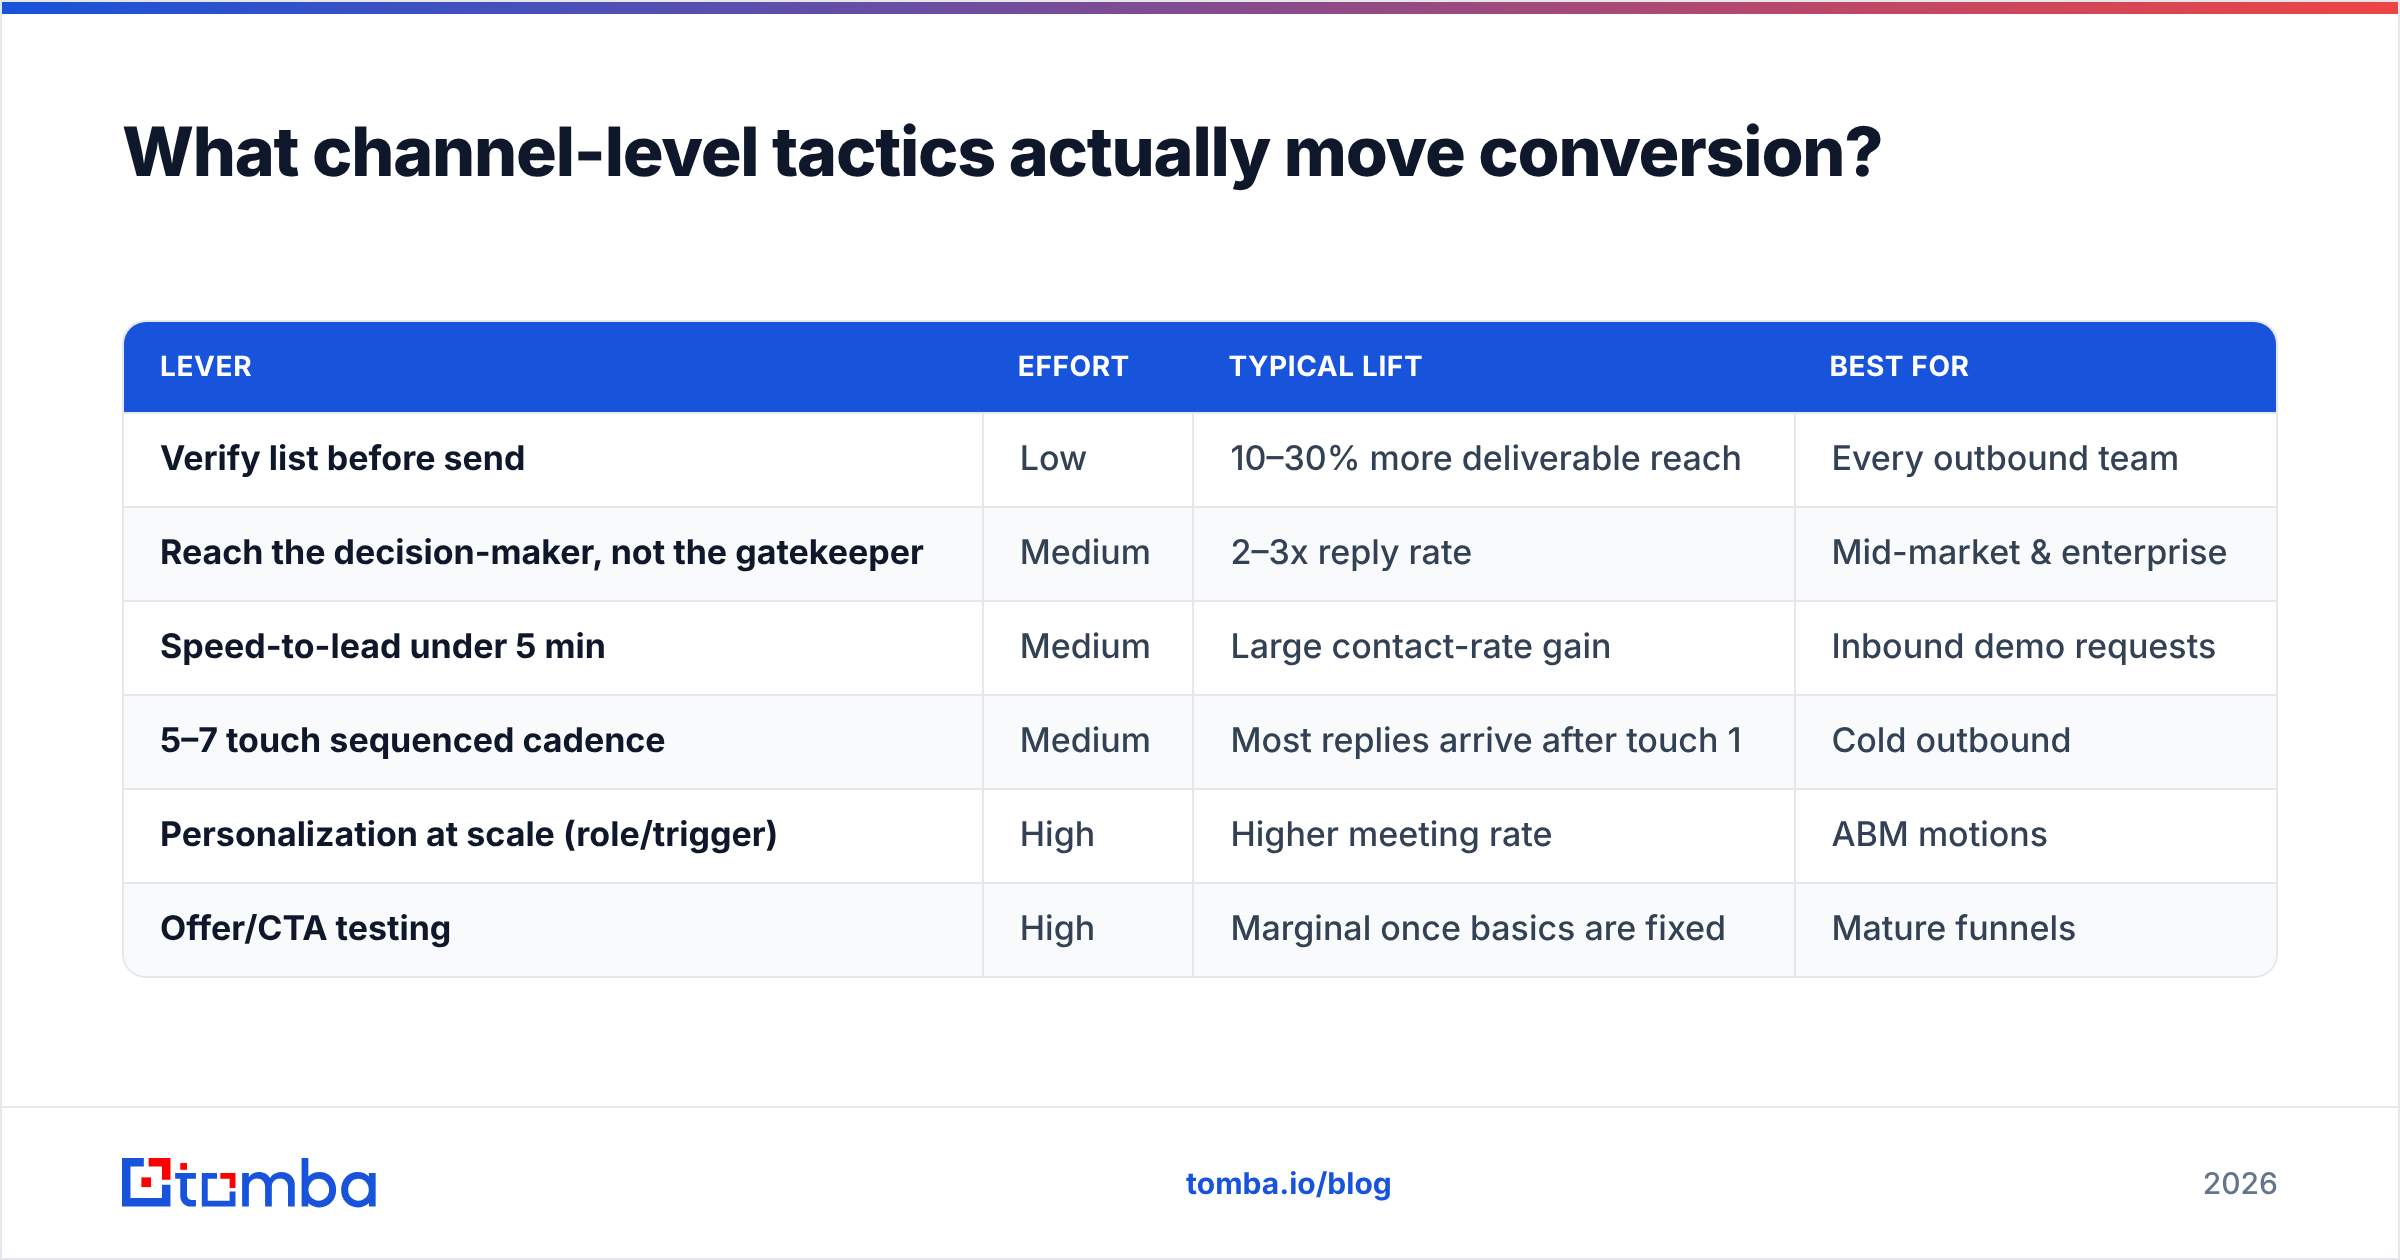
What channel-level tactics actually move conversion?#
Once your data is clean, these are the levers with the best effort-to-impact ratio in 2026.
| Lever | Effort | Typical lift | Best for |
|---|---|---|---|
| Verify list before send | Low | 10–30% more deliverable reach | Every outbound team |
| Reach the decision-maker, not the gatekeeper | Medium | 2–3x reply rate | Mid-market & enterprise |
| Speed-to-lead under 5 min | Medium | Large contact-rate gain | Inbound demo requests |
| 5–7 touch sequenced cadence | Medium | Most replies arrive after touch 1 | Cold outbound |
| Personalization at scale (role/trigger) | High | Higher meeting rate | ABM motions |
| Offer/CTA testing | High | Marginal once basics are fixed | Mature funnels |
A pattern emerges: the low-effort, high-impact rows are all about reaching the right person reliably. That's a data problem before it's a creative one. You can compare your reply benchmarks against the definitions in Tomba's guide to response rate to see whether your numbers are healthy or hiding a reachability issue.
For inbound, the single highest-leverage change most teams can make is speed. Tools like G2 consistently rank speed-to-lead as a top driver of demo-to-opportunity conversion, yet median response times remain measured in hours. Closing that gap rarely requires new headcount — just routing and alerting that already exist in most CRMs.
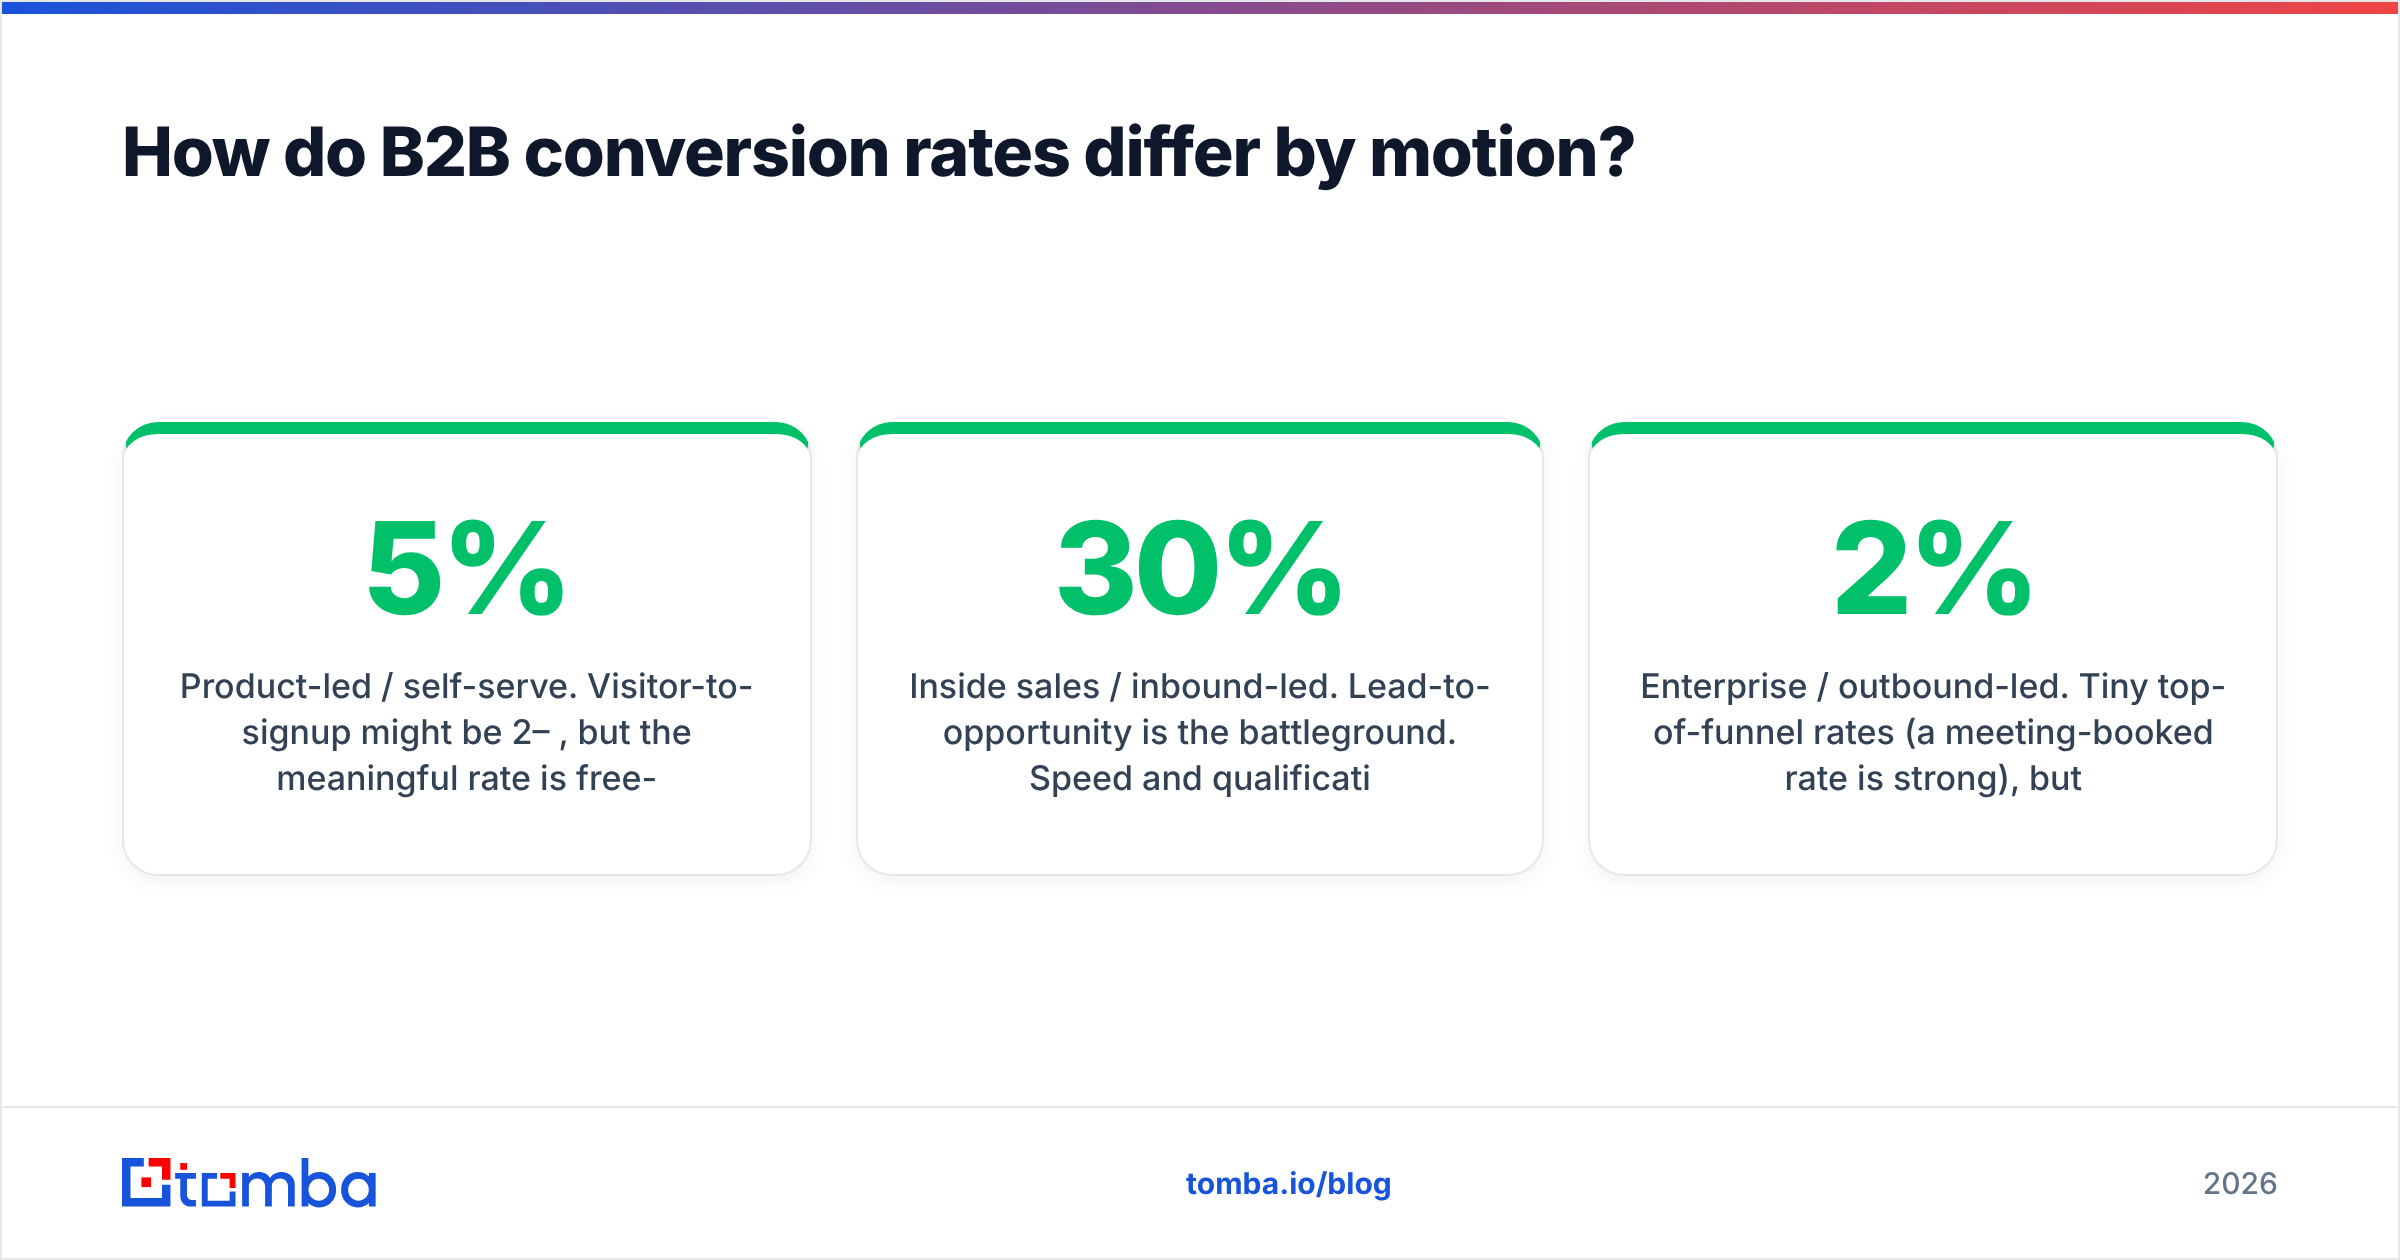
How do B2B conversion rates differ by motion?#
A self-serve product, an inside-sales motion, and a field-sales enterprise deal are three different sports. Holding them to the same benchmark guarantees a wrong conclusion.
- Product-led / self-serve. Visitor-to-signup might be 2–5%, but the meaningful rate is free-to-paid, often 2–5% for freemium and 15–25% for free trials. Volume is high; touch is low.
- Inside sales / inbound-led. Lead-to-opportunity is the battleground. Speed and qualification dominate. Win rates of 20–30% on well-qualified SQLs are common.
- Enterprise / outbound-led. Tiny top-of-funnel rates (a 2% meeting-booked rate is strong), but large deal sizes justify deep personalization and multi-threading. Here, reaching the right five people inside an account matters more than reaching 500 random contacts.
The takeaway: define your benchmark by your motion, then optimize the stage that's furthest below its own peer group. Borrowing a PLG benchmark to judge an enterprise outbound team is how good teams get told they're failing.
Putting it together: a 30-day conversion audit#
If you want a concrete plan, run this sequence over a month.
- Week 1 — Measure honestly. Pull stage-by-stage rates segmented by channel and motion. Deduplicate. Fix the denominators.
- Week 2 — Clean the inputs. Verify your active outbound lists, enrich for ICP fields, and remove invalids. Re-baseline your reply and contact rates against the clean list.
- Week 3 — Fix the worst stage. Pick the lowest rate relative to its benchmark with real volume. Apply the matching lever from the table above.
- Week 4 — Re-measure and lock it in. Compare clean-list rates to your week-1 baseline. Document the new benchmark so the next test measures against reality, not noise.
You'll usually find that the biggest single jump comes from steps 2 and 3 combined — reaching more of the right people — not from any individual creative change.
Start with the input you control: accurate contacts#
Every B2B conversion rate that depends on reaching a human is capped by whether you have the right, verified contact in the first place. You can't optimize your way past a list that's a quarter invalid.
Tomba's Email Finder helps you build that clean input: find professional email addresses by domain, name, or company, then verify them before they ever hit your sequence — so your reply rates reflect real performance instead of a polluted denominator. Pair it with verification and enrichment, and start every conversion measurement from solid ground. See Tomba pricing (free tier with 25 searches/month, Starter at $49/mo) to test it against your own funnel this week.
Fix the data, then fix the funnel. The benchmarks will follow.
Ready to find emails that actually work?
Join 150,000+ professionals who stopped guessing and started sending. Free credits on signup — no credit card required.
Get the Tomba newsletter
Practical outbound tactics and product updates — once every two weeks.
About the author