B2B Data Analytics in 2026: Metrics, Tools, and Strategy
A practical 2026 guide to B2B data analytics: the metrics that matter, the tooling stack, data quality, and how to turn pipeline numbers into revenue decisions.
(title rendered separately)
TL;DR
- B2B data analytics is the discipline of collecting, cleaning, and modeling company and contact data so revenue teams can predict pipeline, prioritize accounts, and prove what works.
- The four metric families that matter: pipeline health, conversion velocity, data quality, and attribution. Everything else is vanity.
- Your stack splits into four layers — sources, warehouse, modeling, and activation. Buy the boring layers, build the differentiated ones.
- Garbage in, garbage out is not a cliché: ~30% of B2B contact data decays every year, so enrichment and verification are part of analytics, not separate from it.
- Start with one decision you want to make better next quarter, then work backward to the data you need.
What is B2B data analytics?#
B2B data analytics is the practice of turning raw account, contact, and activity data into decisions that move revenue. Think of it like a fitness tracker for your go-to-market engine: the raw signals (steps, heart rate) mean nothing until they're modeled into something you act on (you're under-training, sleep more). In B2B, the raw signals are firmographics, intent, email engagement, and CRM stage changes — and the "decision" is which accounts to chase, which messaging to send, and where pipeline is leaking.
It differs from B2C analytics in three ways. The buying unit is a committee, not a person, so you model accounts and contacts together. Deal cycles run months, so attribution windows are long and noisy. And volumes are smaller, so a single dirty record skews a dashboard far more than it would across millions of consumer rows.
That last point is why data quality sits at the center of any serious B2B program. You can have the best dashboards in the world, but if half your contacts bounced last quarter, your "engagement rate" is fiction.
)
Which B2B data analytics metrics actually matter?#
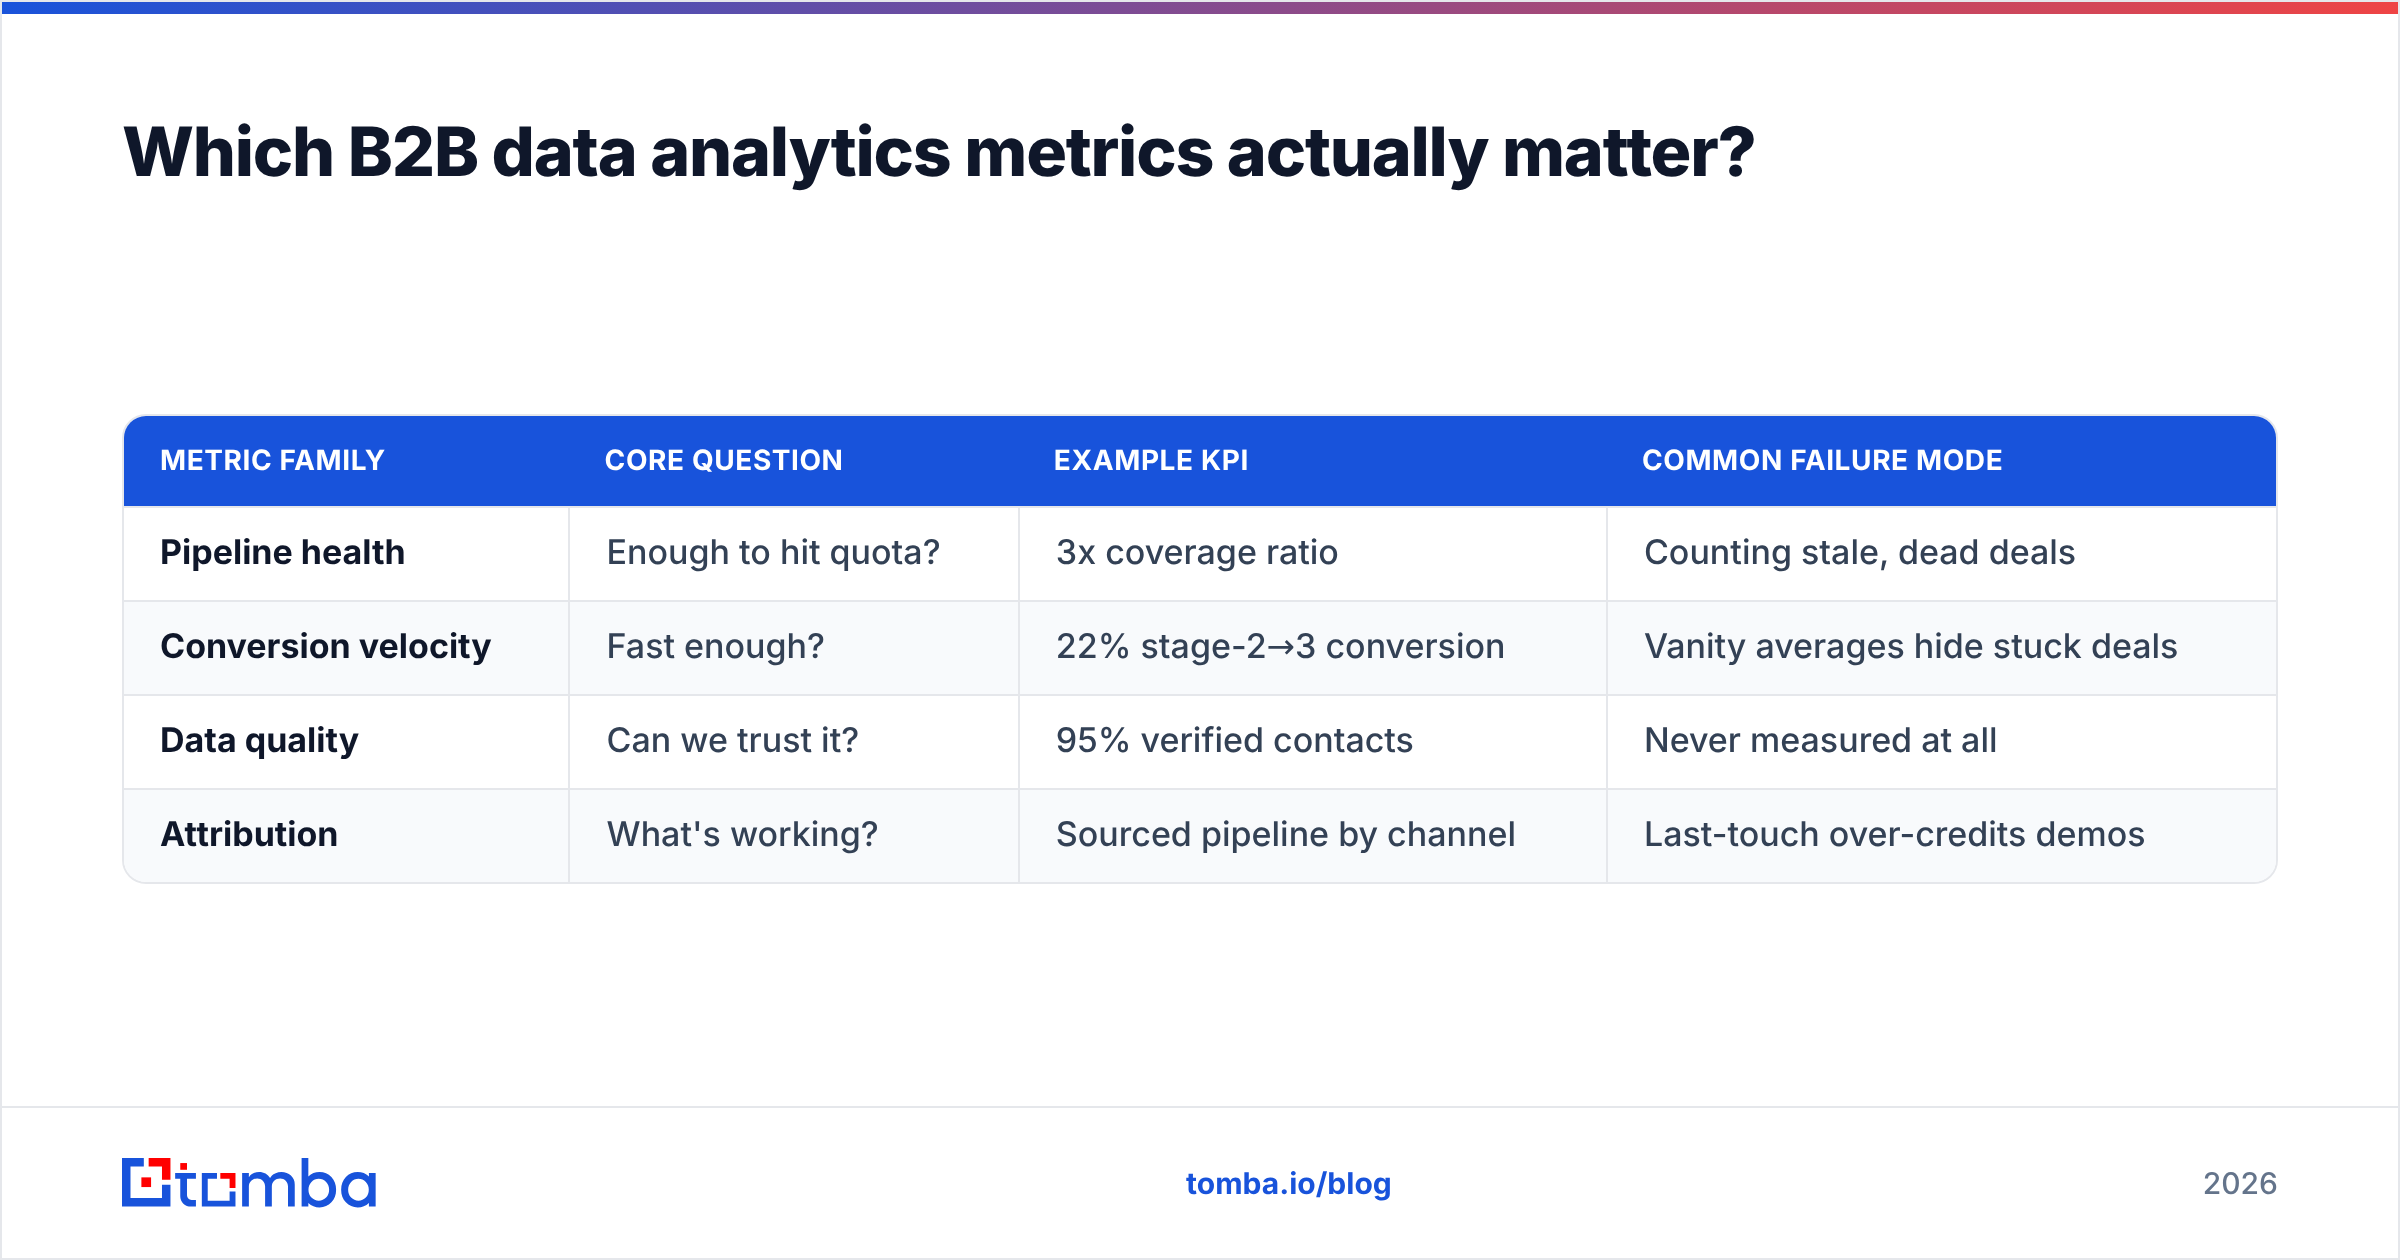
Most teams drown in metrics. The fix is to group them into four families, each tied to a question a leader actually asks.
- Pipeline health — Is there enough qualified pipeline to hit the number? Track pipeline coverage (open pipeline ÷ quota), stage distribution, and aging deals. A 3x coverage ratio that's all stuck in stage 1 is not healthy.
- Conversion velocity — How fast and how often do deals advance? Track stage-to-stage conversion, average deal cycle, and your overall win rate. Velocity problems are usually qualification problems in disguise.
- Data quality — Can you trust the numbers above? Track contact verification rate, enrichment coverage, duplicate rate, and field completeness. This is the family most teams skip and most regret skipping.
- Attribution — What's actually generating pipeline? Track sourced vs. influenced pipeline, channel ROI, and response rate by segment. Multi-touch beats first/last-touch for committees.
The discipline isn't collecting all of these. It's picking the two or three that map to a decision you make every week and ignoring the rest until those are trustworthy.
| Metric family | Core question | Example KPI | Common failure mode |
|---|---|---|---|
| Pipeline health | Enough to hit quota? | 3x coverage ratio | Counting stale, dead deals |
| Conversion velocity | Fast enough? | 22% stage-2→3 conversion | Vanity averages hide stuck deals |
| Data quality | Can we trust it? | 95% verified contacts | Never measured at all |
| Attribution | What's working? | Sourced pipeline by channel | Last-touch over-credits demos |
Notice data quality threads through every row. A coverage ratio built on duplicate accounts is inflated; an attribution model fed by bounced contacts misroutes budget.
What does a B2B data analytics stack look like?#
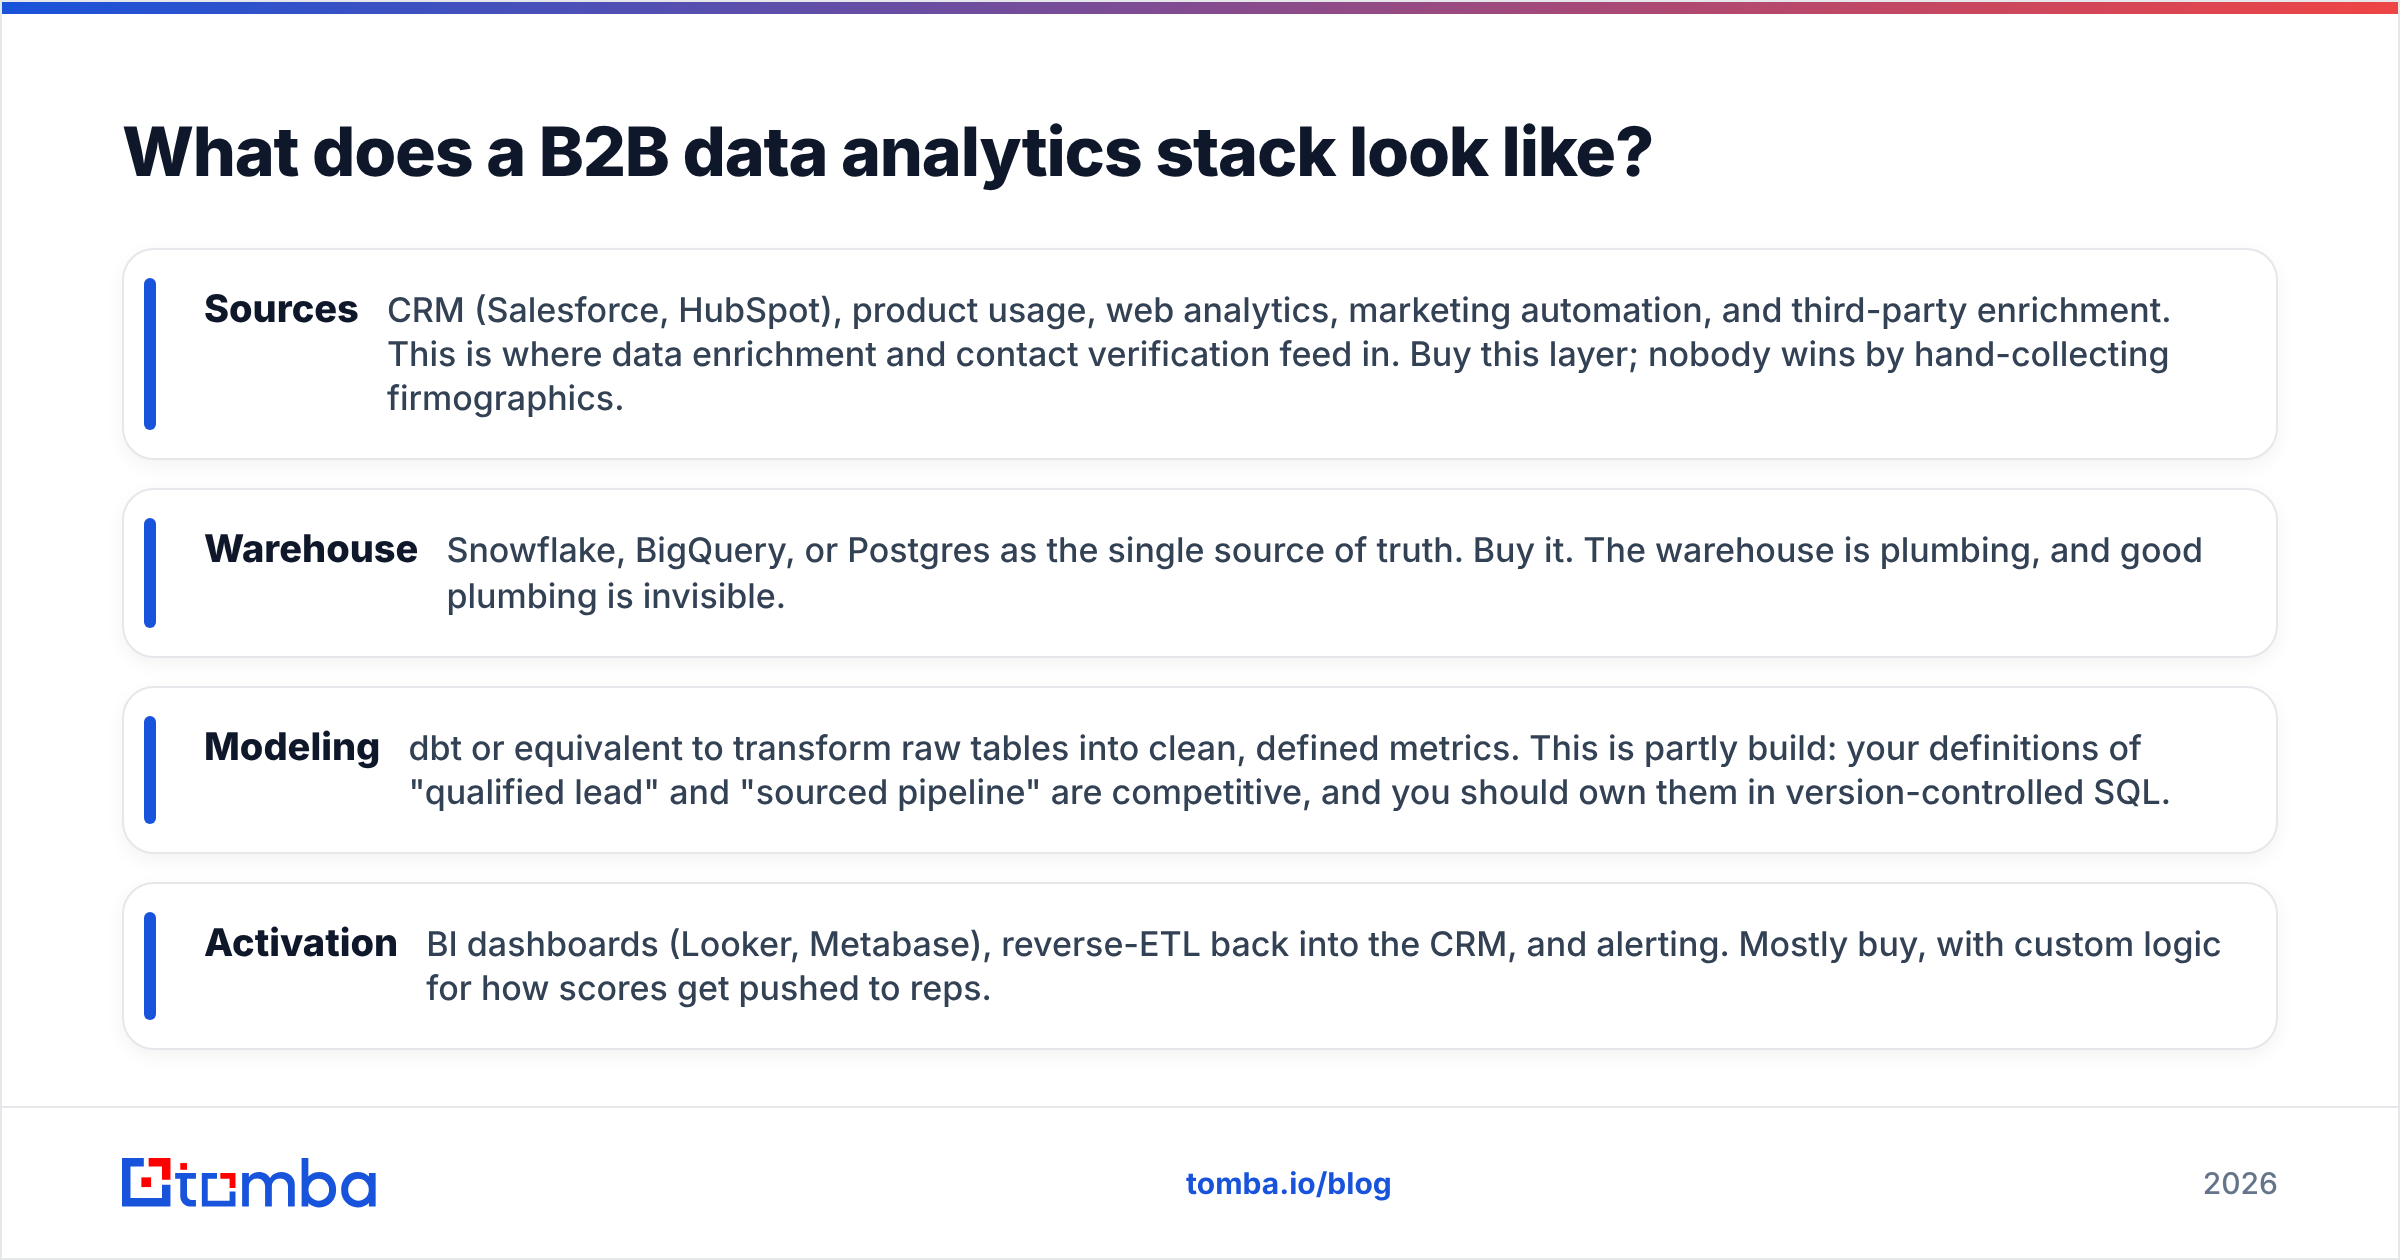
A modern stack has four layers, and you make a buy-vs-build decision at each.
- Sources — CRM (Salesforce, HubSpot), product usage, web analytics, marketing automation, and third-party enrichment. This is where data enrichment and contact verification feed in. Buy this layer; nobody wins by hand-collecting firmographics.
- Warehouse — Snowflake, BigQuery, or Postgres as the single source of truth. Buy it. The warehouse is plumbing, and good plumbing is invisible.
- Modeling — dbt or equivalent to transform raw tables into clean, defined metrics. This is partly build: your definitions of "qualified lead" and "sourced pipeline" are competitive, and you should own them in version-controlled SQL.
- Activation — BI dashboards (Looker, Metabase), reverse-ETL back into the CRM, and alerting. Mostly buy, with custom logic for how scores get pushed to reps.
The principle: buy the boring layers, build the differentiated ones. Your warehouse is not a competitive advantage. Your definition of an ideal-customer-profile fit score, encoded in modeling, can be.
A frequent mistake is starting at the dashboard layer. Teams buy a shiny BI tool, point it at a messy CRM, and produce confident-looking charts on top of broken data. Start at sources and modeling; the dashboard is the easy part.
)
How do you keep B2B analytics data clean?#
Data decay is the silent killer of B2B analytics. Industry estimates from vendors like HubSpot and others put B2B contact decay at roughly 22–30% per year — people change jobs, companies get acquired, domains change. If you set up a beautiful dashboard in January and never refresh the underlying data, by Q4 a third of it is wrong.
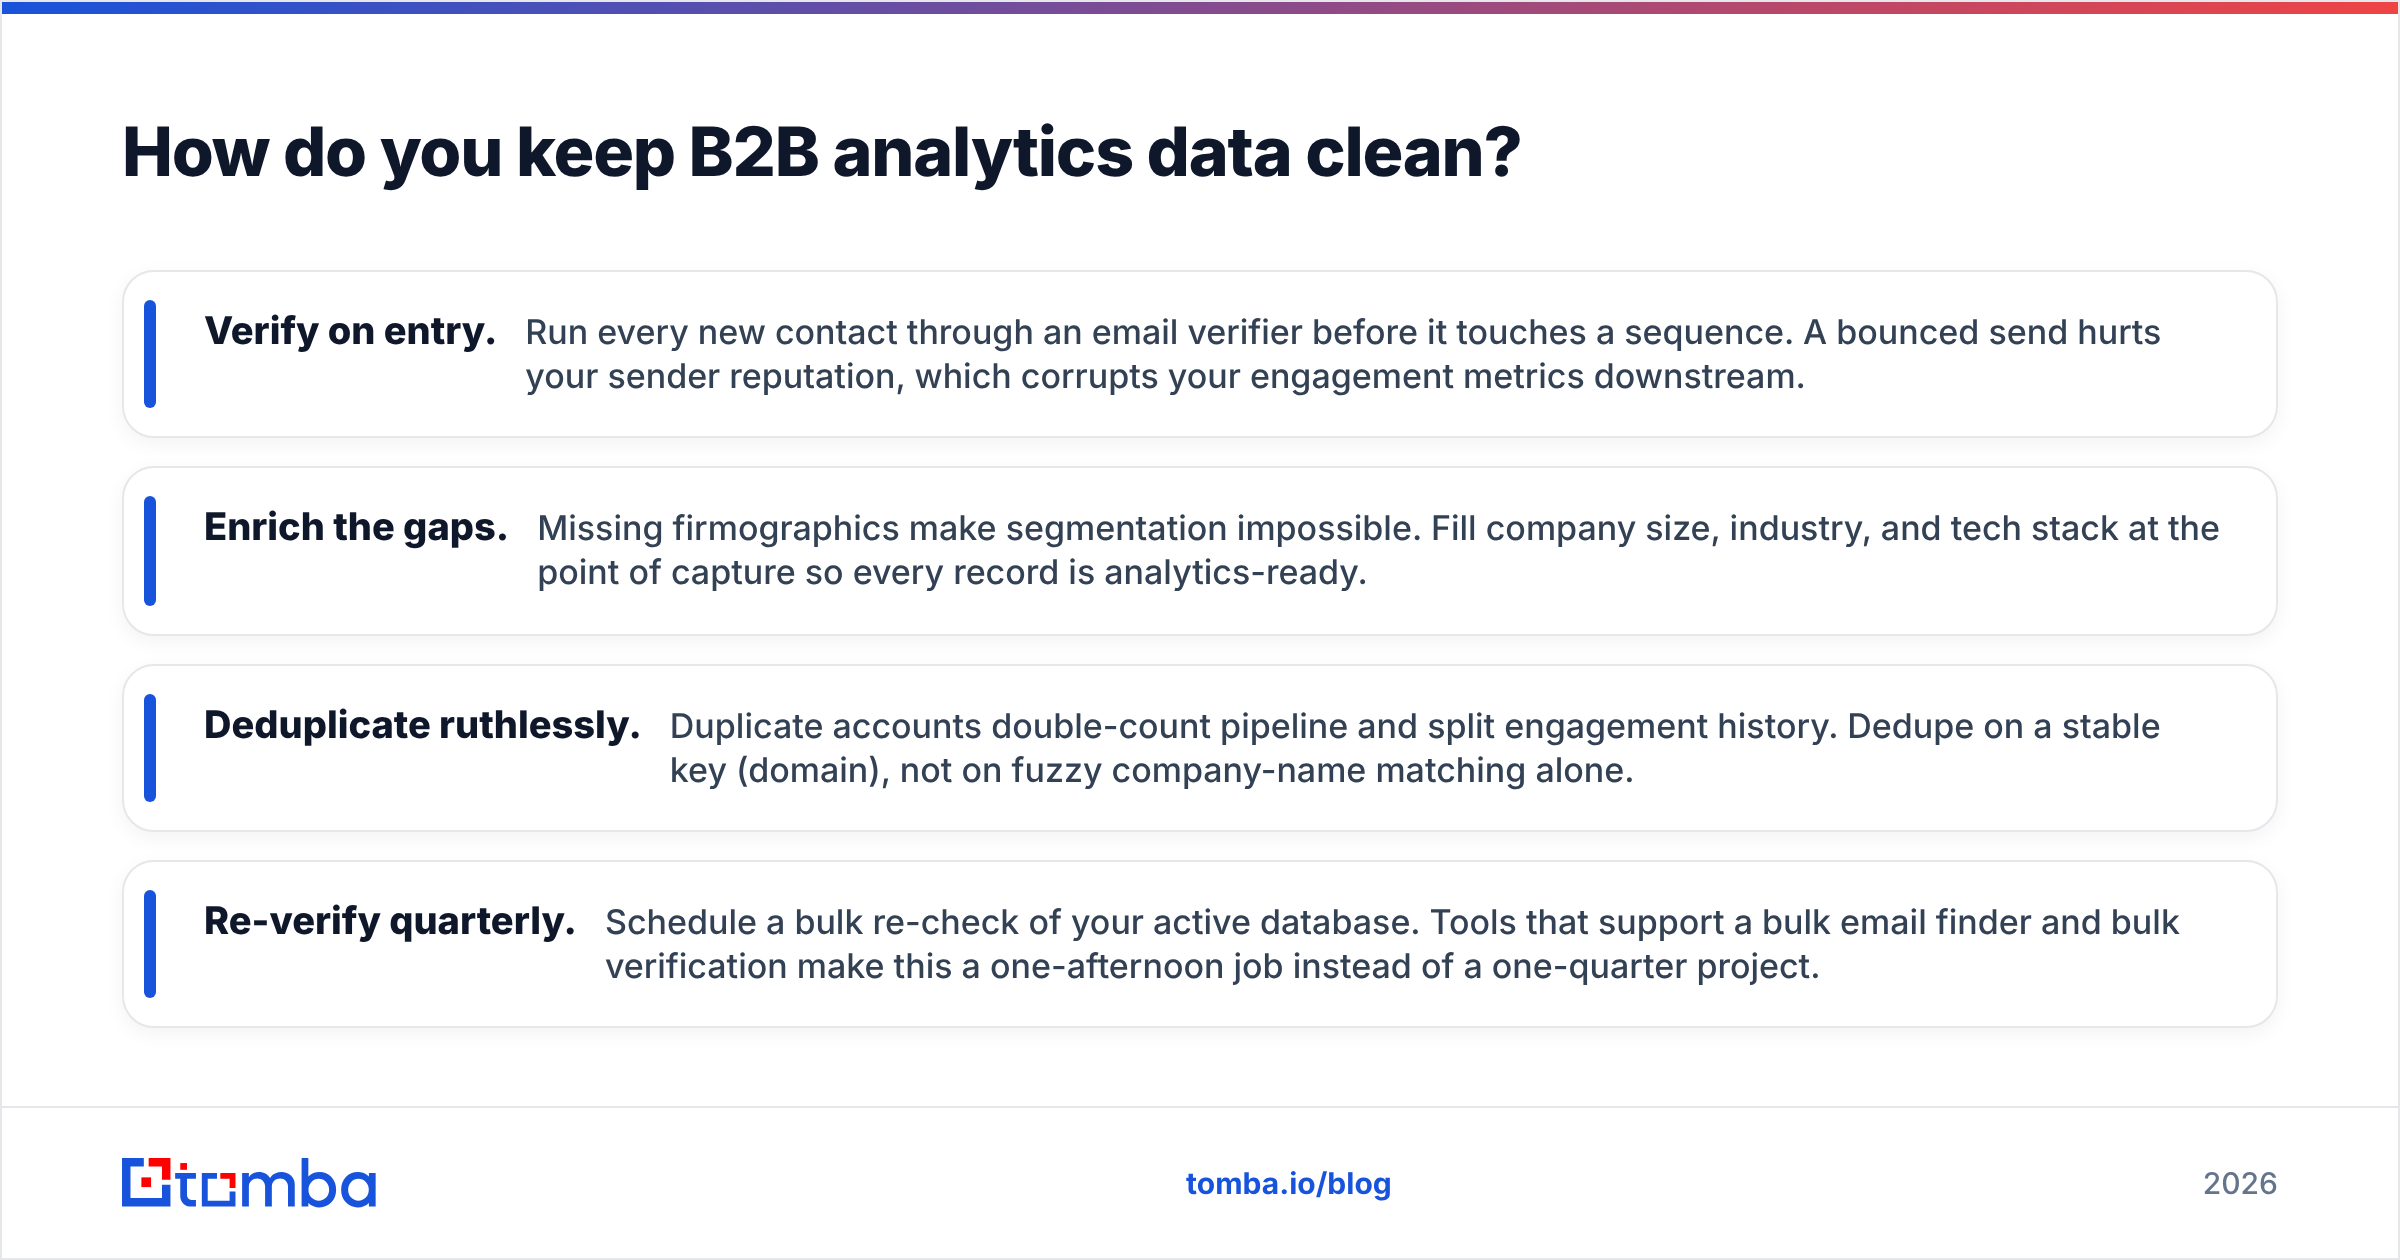
Treat data hygiene as a recurring process, not a one-time cleanup:
- Verify on entry. Run every new contact through an email verifier before it touches a sequence. A bounced send hurts your sender reputation, which corrupts your engagement metrics downstream.
- Enrich the gaps. Missing firmographics make segmentation impossible. Fill company size, industry, and tech stack at the point of capture so every record is analytics-ready.
- Deduplicate ruthlessly. Duplicate accounts double-count pipeline and split engagement history. Dedupe on a stable key (domain), not on fuzzy company-name matching alone.
- Re-verify quarterly. Schedule a bulk re-check of your active database. Tools that support a bulk email finder and bulk verification make this a one-afternoon job instead of a one-quarter project.
The payoff is compounding. Clean inputs make every metric in the four families more trustworthy, which makes every decision built on those metrics defensible. Dirty inputs do the opposite — quietly, until a board meeting exposes it.
How is AI changing B2B data analytics in 2026?#
The honest answer: AI is making the modeling and activation layers faster, not replacing the need for clean data. Three shifts are real in 2026.
First, predictive scoring has gone mainstream. Propensity-to-buy and churn-risk models that used to require a data-science team are now packaged features in mid-market platforms. They're genuinely useful — but they're only as good as the training data, which loops back to hygiene.
Second, natural-language querying lets a revenue leader ask "which closed-won deals had a champion at VP level?" and get an answer without writing SQL. This lowers the barrier to analytics but raises the stakes on metric definitions: if "closed-won" means three different things across your tables, the AI will confidently average them.
Third, enrichment is increasingly automated and API-first. Instead of batch uploads, teams pipe an email finder API directly into their data flow so records are enriched the moment they're created. According to analyst coverage from firms like Gartner, the shift toward real-time, embedded data services is one of the defining RevTech trends of the mid-2020s.
The teams winning with AI aren't the ones with the fanciest models. They're the ones whose underlying data is clean enough that the models tell the truth.
How do you turn analytics into pipeline decisions?#
A dashboard nobody acts on is a screensaver. The bridge from analytics to action is a simple loop: define the decision, instrument the data, set a threshold, and route the action.
Here's a concrete example. Suppose your decision is "which accounts should SDRs prioritize this week?"
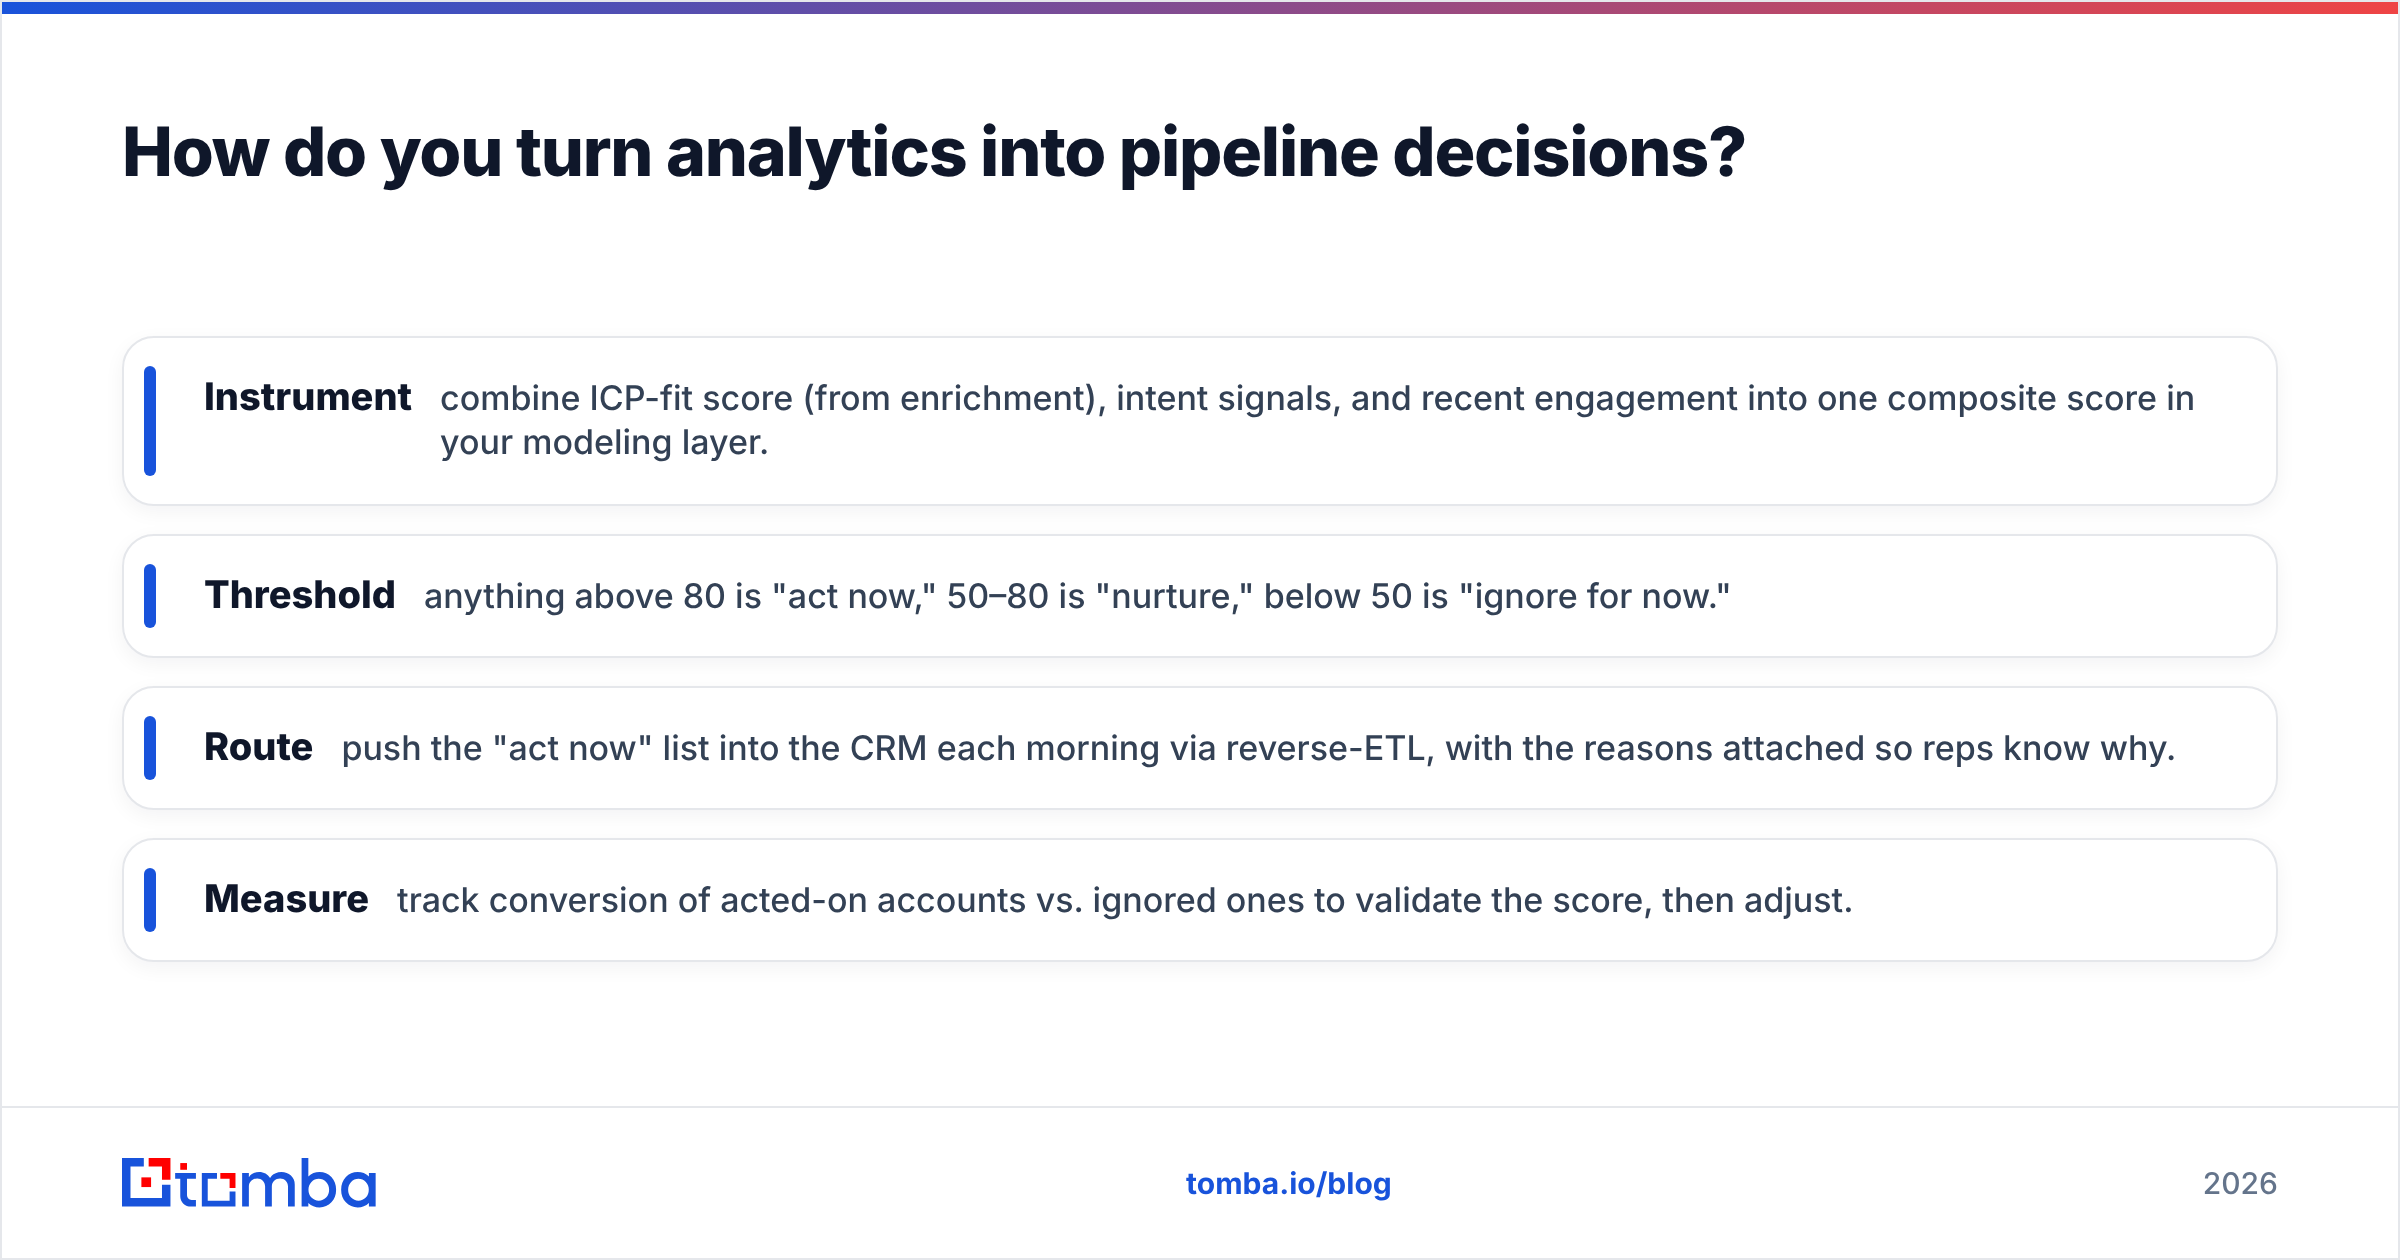
- Instrument — combine ICP-fit score (from enrichment), intent signals, and recent engagement into one composite score in your modeling layer.
- Threshold — anything above 80 is "act now," 50–80 is "nurture," below 50 is "ignore for now."
- Route — push the "act now" list into the CRM each morning via reverse-ETL, with the reasons attached so reps know why.
- Measure — track conversion of acted-on accounts vs. ignored ones to validate the score, then adjust.
That loop is the whole game. It's also why you need verified contact data feeding the top: an "act now" account with no reachable contacts is a dead end. This is where pairing analytics with a solid domain search and find email addresses workflow turns a prioritized list into actual conversations.
For pricing-sensitive teams building this in-house, the cost of the data layer matters. You can review Tomba pricing to size the enrichment and verification piece against your record volume — the Free tier (25 searches/mo) is enough to prototype the loop before you commit budget.
What are common B2B data analytics mistakes?#
A short list of the failures that show up most often:
- Measuring everything, deciding nothing. Forty-KPI dashboards signal effort, not insight. Cut to the metrics tied to a weekly decision.
- Trusting averages. An average deal cycle of 60 days can hide a bimodal split of 20-day and 120-day deals that need totally different plays.
- Ignoring data freshness. Stale data doesn't announce itself. Re-verification schedules are non-negotiable.
- Last-touch attribution for committee buys. A six-person buying committee touched by ten channels cannot be credited to the final demo. Use multi-touch.
- Building dashboards before defining metrics. If "qualified lead" isn't defined in code, every chart using it is suspect.
Most of these trace back to the same root: treating analytics as a reporting function instead of a decision function. Reporting describes the past. Analytics changes what you do next.
Conclusion: start with one decision#
Don't boil the ocean. Pick one decision your revenue team makes repeatedly — account prioritization, channel budget, or rep coaching — and build the smallest reliable data pipeline that improves it. Get the data clean, define the metric in code, set a threshold, route the action, and measure the lift. Then add the next decision.
The teams that win at B2B data analytics in 2026 aren't the ones with the most data. They're the ones whose data they can trust, fed by verified, enriched contact records at the source.
That source layer is where Tomba fits. The Tomba Email Finder gives you verified, analytics-ready contact data by domain, name, or company — so the firmographics and emails feeding your dashboards are accurate from the moment a record is created, not 30% wrong by Q4. Start on the Free tier, wire it into your pipeline via the API, and build your analytics on a foundation you can defend.
Ready to find emails that actually work?
Join 150,000+ professionals who stopped guessing and started sending. Free credits on signup — no credit card required.
Get the Tomba newsletter
Practical outbound tactics and product updates — once every two weeks.
About the author