B2B Lead Conversion Rates in 2026: Benchmarks & Fixes
What counts as a good B2B lead conversion rate in 2026? Real benchmarks by stage and channel, plus the data and process fixes that actually move the number.
You can have a full pipeline and still miss quota. The number that decides which it is — quota or shortfall — is your conversion rate, and most B2B teams track it badly: one blended percentage that hides where deals actually leak.
This post breaks B2B lead conversion rates down by stage, channel, and industry, gives you 2026 benchmarks to compare against, and shows the specific fixes that lift each step. The shortcut most teams miss: better contact data raises every downstream rate at once.
TL;DR#
- A "good" overall B2B lead-to-customer rate sits around 2–5%, but that single number is useless without stage-level detail.
- The biggest leaks are usually MQL→SQL and SQL→Opportunity — handoff and qualification problems, not top-of-funnel volume.
- Bad contact data quietly caps every stage: wrong emails kill reply rates, which shrink every downstream conversion.
- You lift conversion faster by fixing the funnel you have than by buying more leads — speed-to-lead, tight ICP, and verified data do most of the work.
- Benchmark by channel and segment, never against a generic blended average.
What is a B2B lead conversion rate?#
A B2B lead conversion rate is the percentage of leads that move from one funnel stage to the next. Think of it like a series of doorways: every prospect who walks in the front door has to pass through several more before they sign. Each doorway has its own pass-through rate, and the product of all of them is your overall conversion.
The basic formula for any single step:
Conversion rate = (contacts who advanced ÷ contacts who entered the stage) × 100
So if 1,000 leads become 120 MQLs, your lead→MQL rate is 12%. The mistake is collapsing the whole journey into one "lead-to-customer" figure. That blended number tells you something is wrong but never where. Stage-level rates tell you which doorway is jammed.
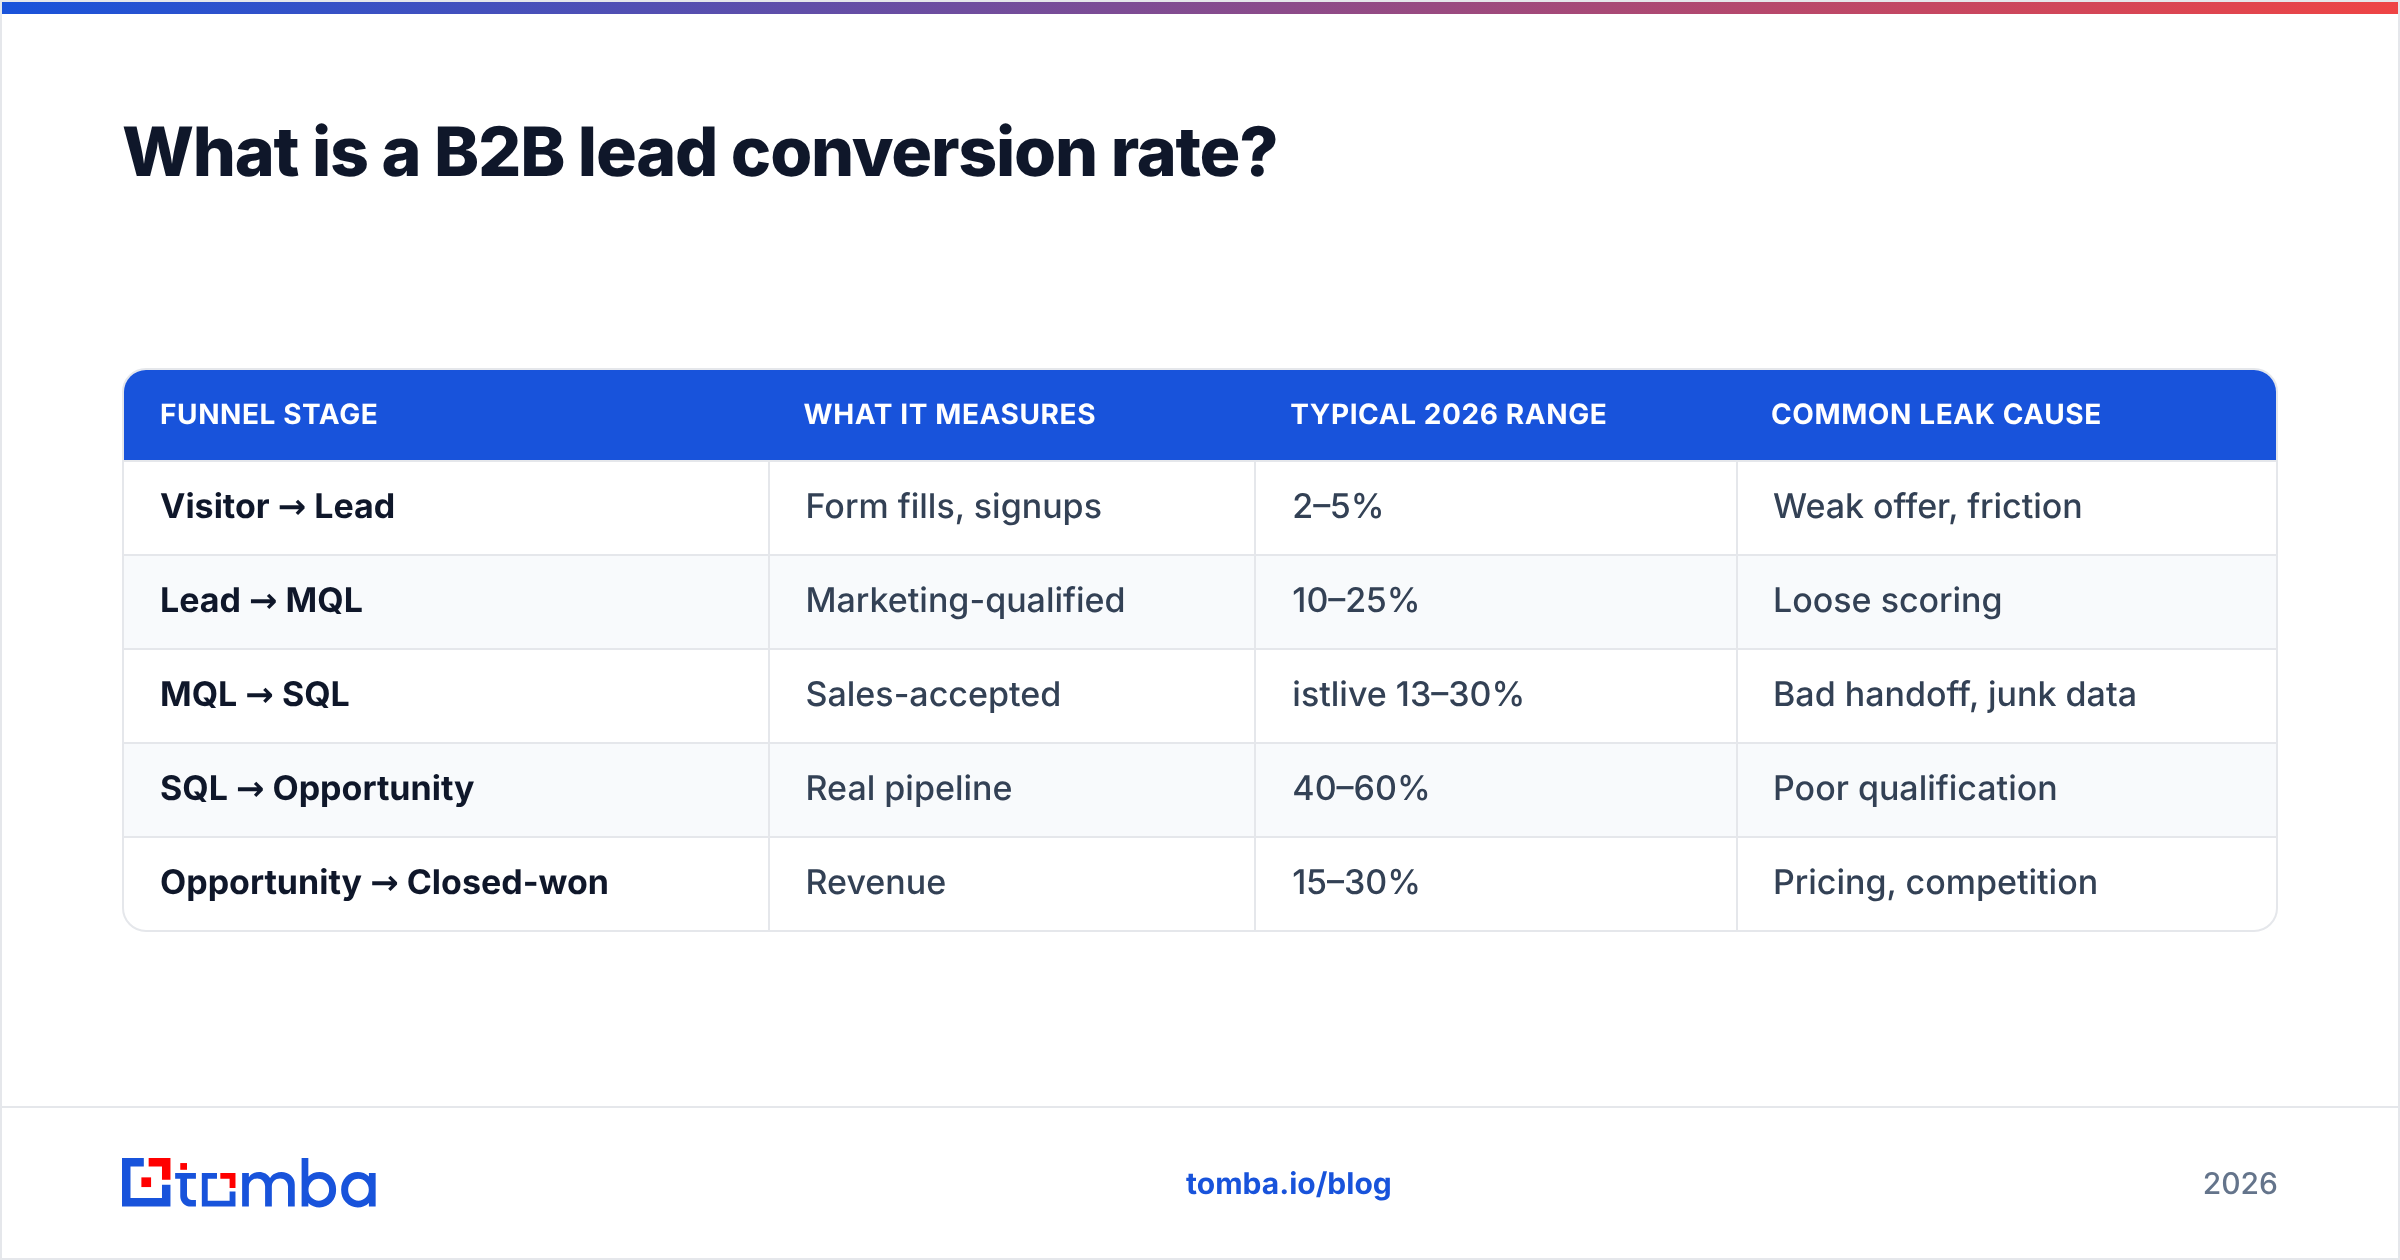
Here are the stages most B2B teams measure, with realistic 2026 ranges for a mid-market SaaS or services motion:
| Funnel stage | What it measures | Typical 2026 range | Common leak cause |
|---|---|---|---|
| Visitor → Lead | Form fills, signups | 2–5% | Weak offer, friction |
| Lead → MQL | Marketing-qualified | 10–25% | Loose scoring |
| MQL → SQL | Sales-accepted | istlive 13–30% | Bad handoff, junk data |
| SQL → Opportunity | Real pipeline | 40–60% | Poor qualification |
| Opportunity → Closed-won | Revenue | 15–30% | Pricing, competition |
Multiply a plausible chain — 4% × 18% × 25% × 50% × 22% — and your visitor-to-customer rate is roughly 0.02%. That is why volume alone never fixes a leaky funnel: each weak doorway compounds.
What is a good B2B lead conversion rate in 2026?#
The honest answer: "good" depends on your channel, deal size, and source quality, but there are defensible reference points. A widely cited benchmark across B2B is a lead-to-customer rate near 2–5% for blended inbound, with high-intent channels running much higher and cold outbound much lower.
The trap is comparing yourself to an average that includes motions nothing like yours. A self-serve product with a $30/month plan and a $120k enterprise contract live in the same "B2B" bucket and convert nothing alike. Segment first, then judge.
Use these as directional 2026 benchmarks by source:
| Lead source | Lead→MQL | MQL→Customer | Notes |
|---|---|---|---|
| Inbound demo request | 35–50% | 20–30% | Highest intent |
| Content / gated asset | 10–20% | 3–8% | Needs nurture |
| Webinar | 15–25% | 5–12% | Mid-intent |
| Paid search | 8–18% | 4–10% | Intent varies by keyword |
| Cold outbound | 1–5% | 1–3% | Volume game, data-sensitive |
| Referral | 50–70% | 30–50% | Trust pre-built |
If your referral leads convert like cold outbound, you have a follow-up or data problem, not a demand problem. According to HubSpot's sales benchmark research, response time and lead source explain more variance in conversion than almost any creative variable.
Why are your B2B conversion rates lower than benchmark?#
Most underperformance traces back to five fixable causes. Walk them in order — they compound.
- Bad or stale contact data. If 20–30% of your emails bounce or route to the wrong person, every reply-rate-dependent stage drops before a rep even speaks. This is the silent ceiling on conversion.
- Slow speed-to-lead. Contacting a fresh inbound lead within five minutes versus an hour can cut your qualification odds by an order of magnitude. Leads cool fast.
- Loose ICP and scoring. When marketing passes anyone who downloads an ebook, sales drowns in low-fit MQLs and the MQL→SQL rate collapses.
- Weak handoff. Context lost between marketing and sales forces reps to restart discovery, and prospects churn out of the gap.
- One-touch follow-up. Most B2B deals need 5–8 touches; teams that quit after two leave the majority of convertible pipeline on the table.
Notice that two of the top three are data problems. You can write better emails all year, but if they land in the wrong inbox, conversion never moves. Verified, enriched contact records are the foundation the rest of the playbook stands on. A quick pass through an email verifier before a campaign protects your sender reputation and keeps your reply rate — and every stage after it — intact.
How do you calculate and track conversion by stage?#
Track each doorway separately, then watch the trend, not the single snapshot. A stage rate that drops month over month is an early warning long before revenue reflects it.
A clean tracking setup needs four things:
- Defined stage entry/exit criteria. Everyone must agree what makes a lead an MQL versus an SQL. Ambiguity makes the numbers meaningless.
- A single source of truth. Your CRM should own stage transitions so marketing and sales read the same data.
- Cohort views. Measure conversion by the month leads entered, not the month they closed, or long sales cycles will distort everything.
- Channel and segment splits. Always be able to filter by source, industry, and deal size.
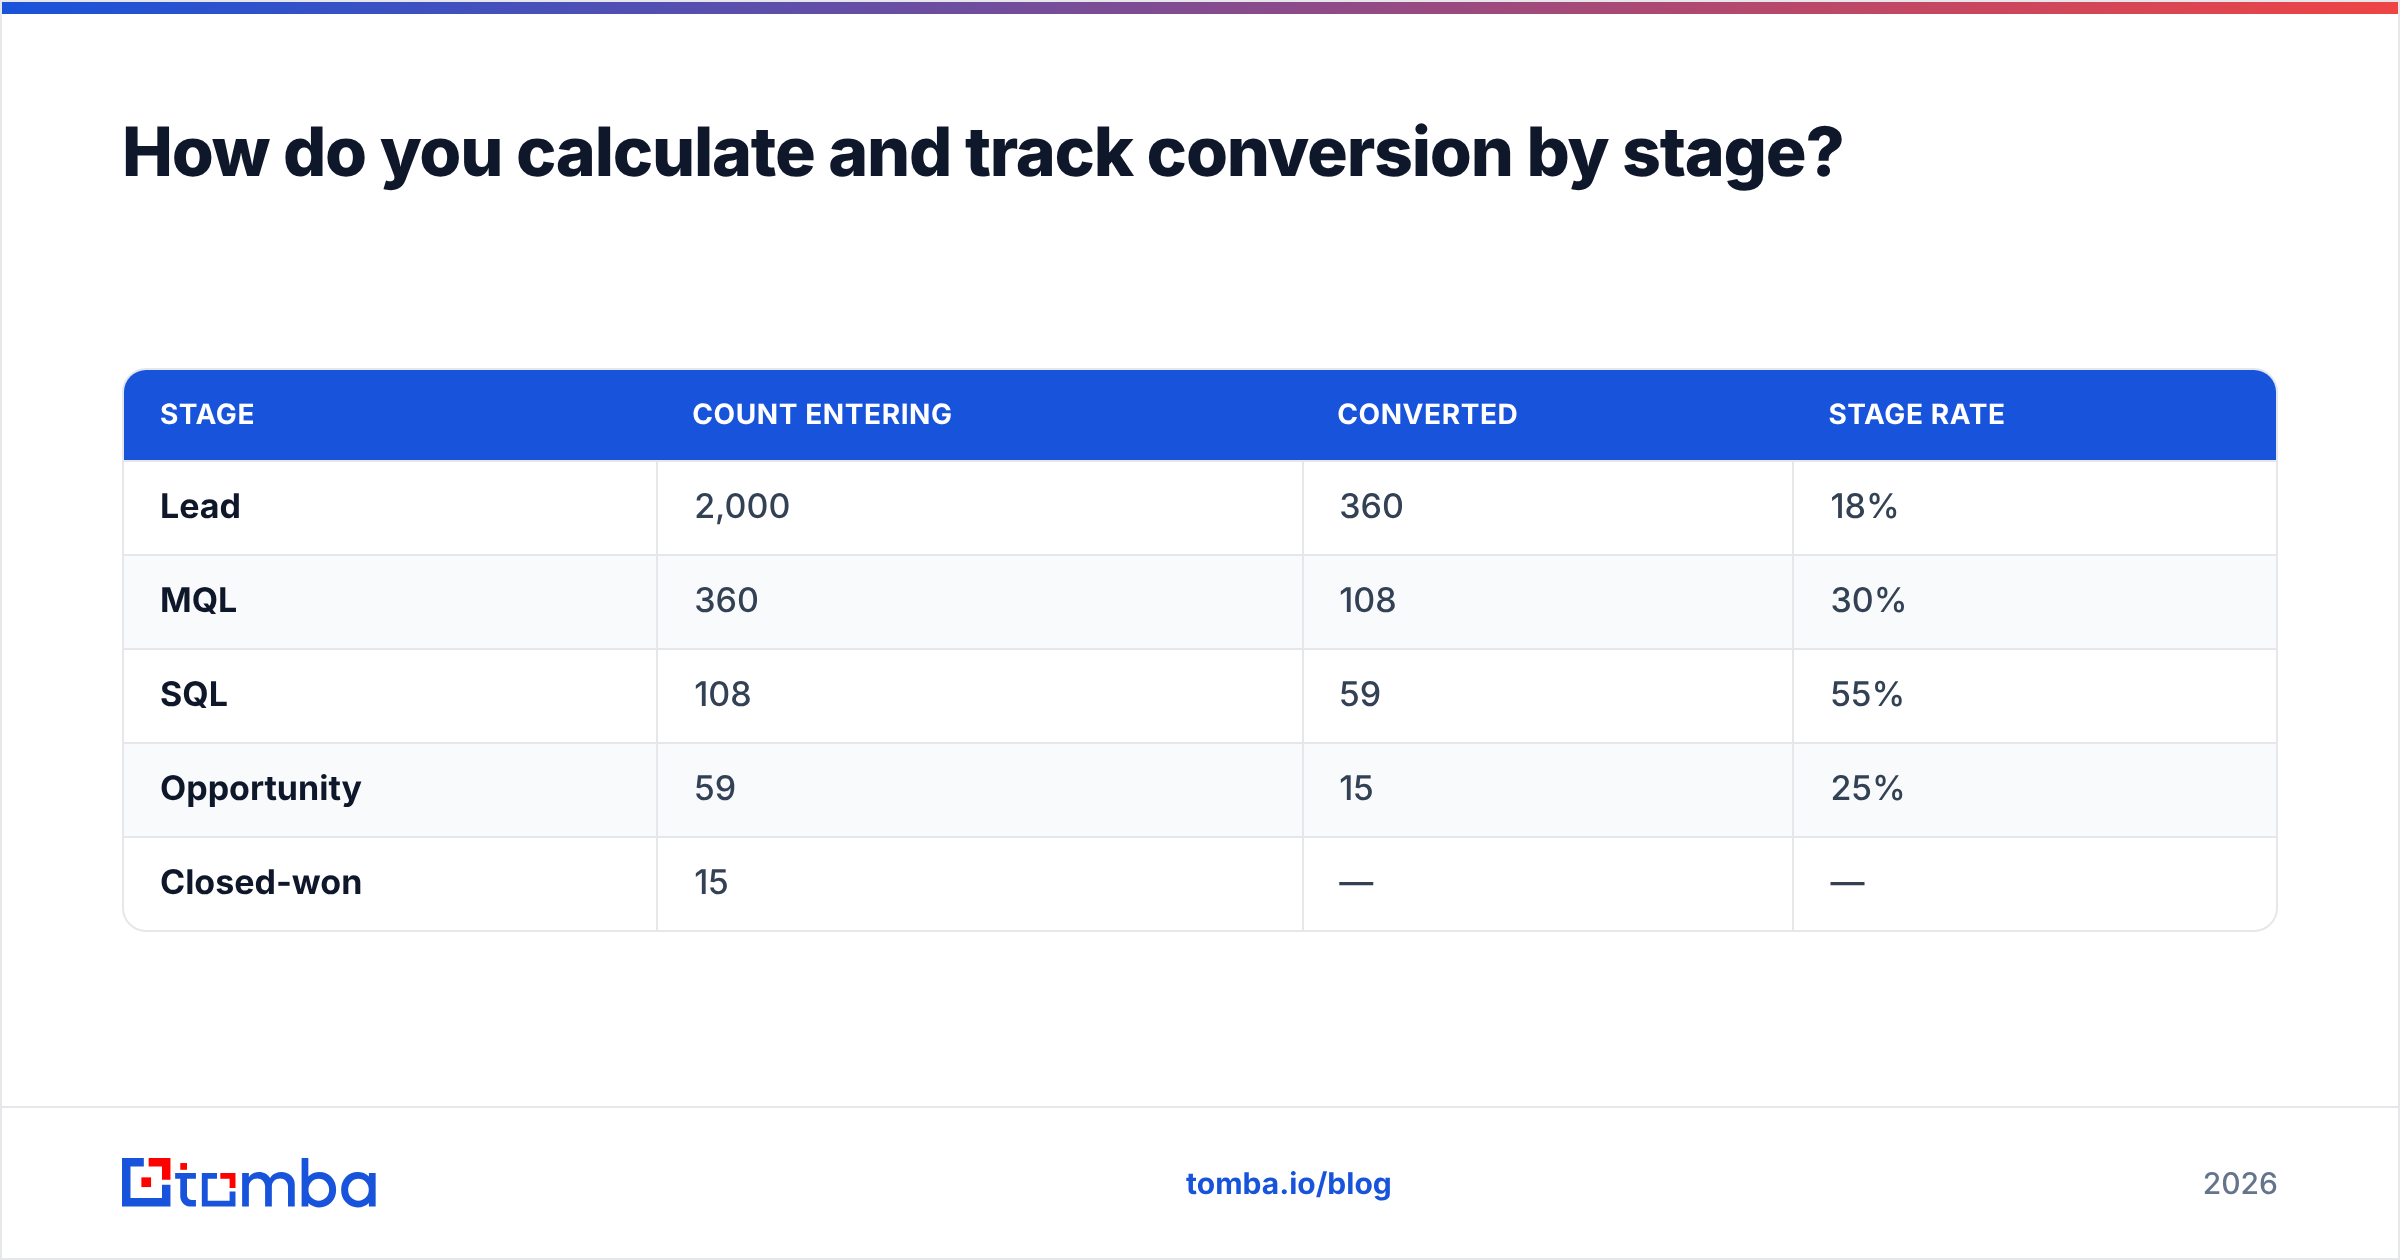
Here is a worked example. Say a quarter starts with 2,000 leads:
| Stage | Count entering | Converted | Stage rate |
|---|---|---|---|
| Lead | 2,000 | 360 | 18% |
| MQL | 360 | 108 | 30% |
| SQL | 108 | 59 | 55% |
| Opportunity | 59 | 15 | 25% |
| Closed-won | 15 | — | — |
Overall lead→customer here is 15 ÷ 2,000 = 0.75%. The weakest doorway is Opportunity→Closed-won at 25%, so that is where a point of improvement returns the most revenue — not the top of the funnel, where everyone instinctively wants to pour more leads.
Salesforce's pipeline guidance makes the same point: optimizing the lowest-converting stage with the highest deal value beats chasing raw lead volume nearly every time.
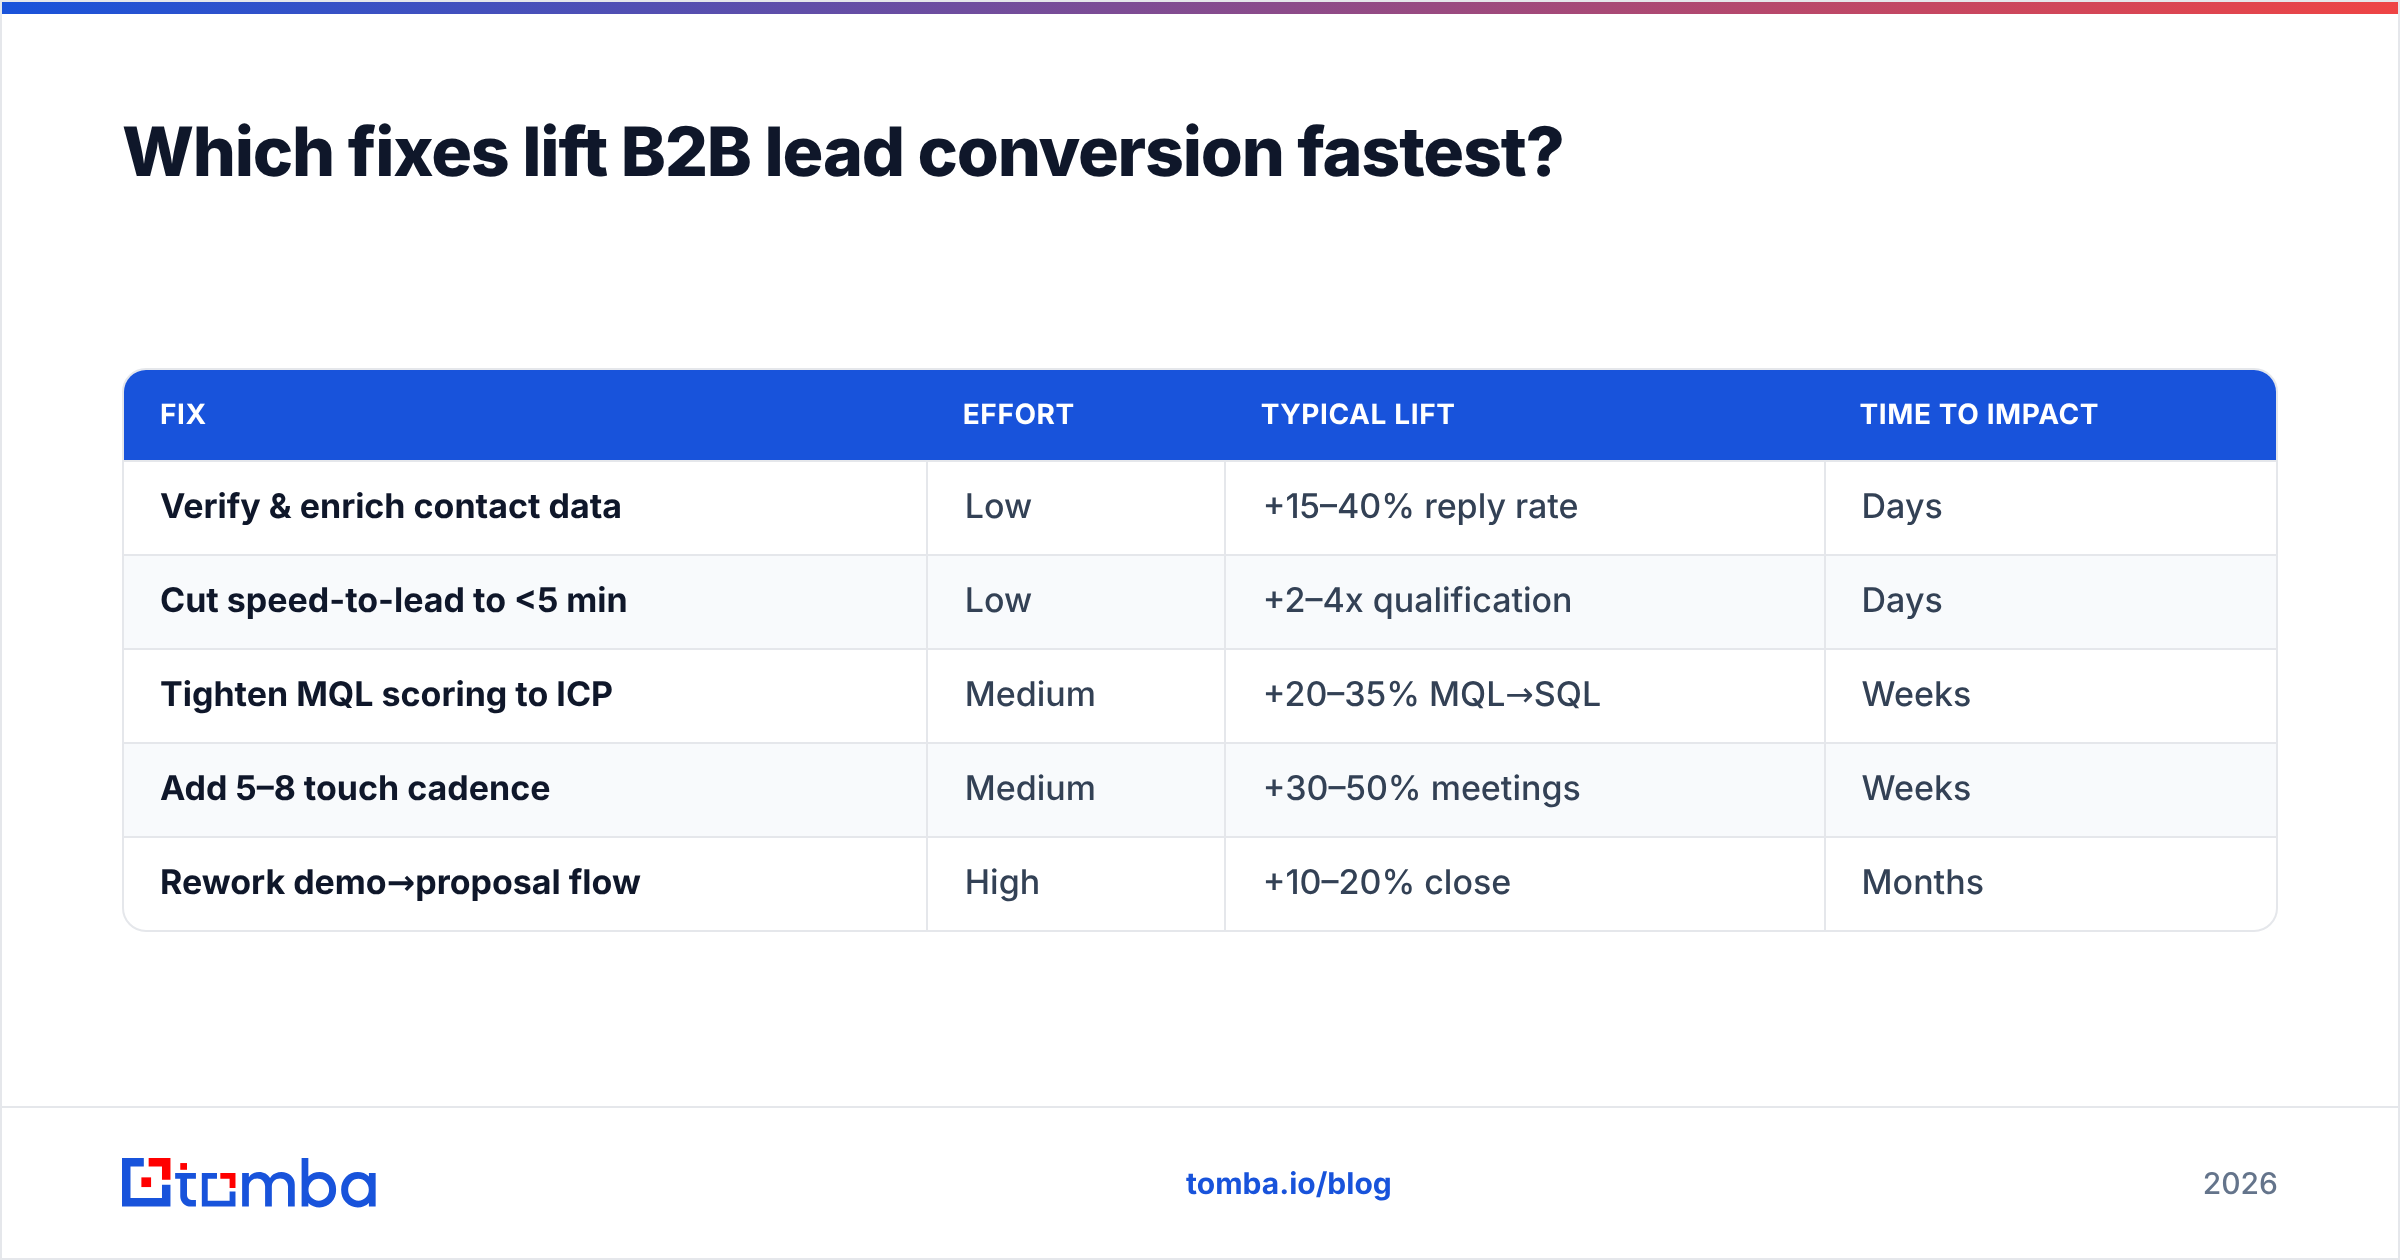
Which fixes lift B2B lead conversion fastest?#
Rank fixes by effort-to-impact. The cheapest, fastest wins are almost always data and process, not new tooling or rebranded campaigns.
| Fix | Effort | Typical lift | Time to impact |
|---|---|---|---|
| Verify & enrich contact data | Low | +15–40% reply rate | Days |
| Cut speed-to-lead to <5 min | Low | +2–4x qualification | Days |
| Tighten MQL scoring to ICP | Medium | +20–35% MQL→SQL | Weeks |
| Add 5–8 touch cadence | Medium | +30–50% meetings | Weeks |
| Rework demo→proposal flow | High | +10–20% close | Months |
Start at the top. Clean data is the rare fix that lifts every downstream stage simultaneously, because every stage after first contact depends on actually reaching the right person. Pulling verified addresses with an email finder and running a bulk verify before launch routinely recovers reply rates that teams had written off as "the market being slow."
Speed-to-lead is the second-cheapest lever. Route inbound to a rep — or an automated first touch — within minutes. The conversion gap between a five-minute and a one-hour response is larger than almost any messaging change you could test, and Gartner's demand-gen research consistently ranks responsiveness above creative as a conversion driver.
Then tighten the top of the funnel. A smaller, better-fit MQL pool converts harder than a bloated one, and it stops your reps from burning hours on prospects who were never going to buy. Pair tighter scoring with data enrichment so every MQL arrives with firmographics, role, and verified contact details already attached — reps spend their time selling, not researching.
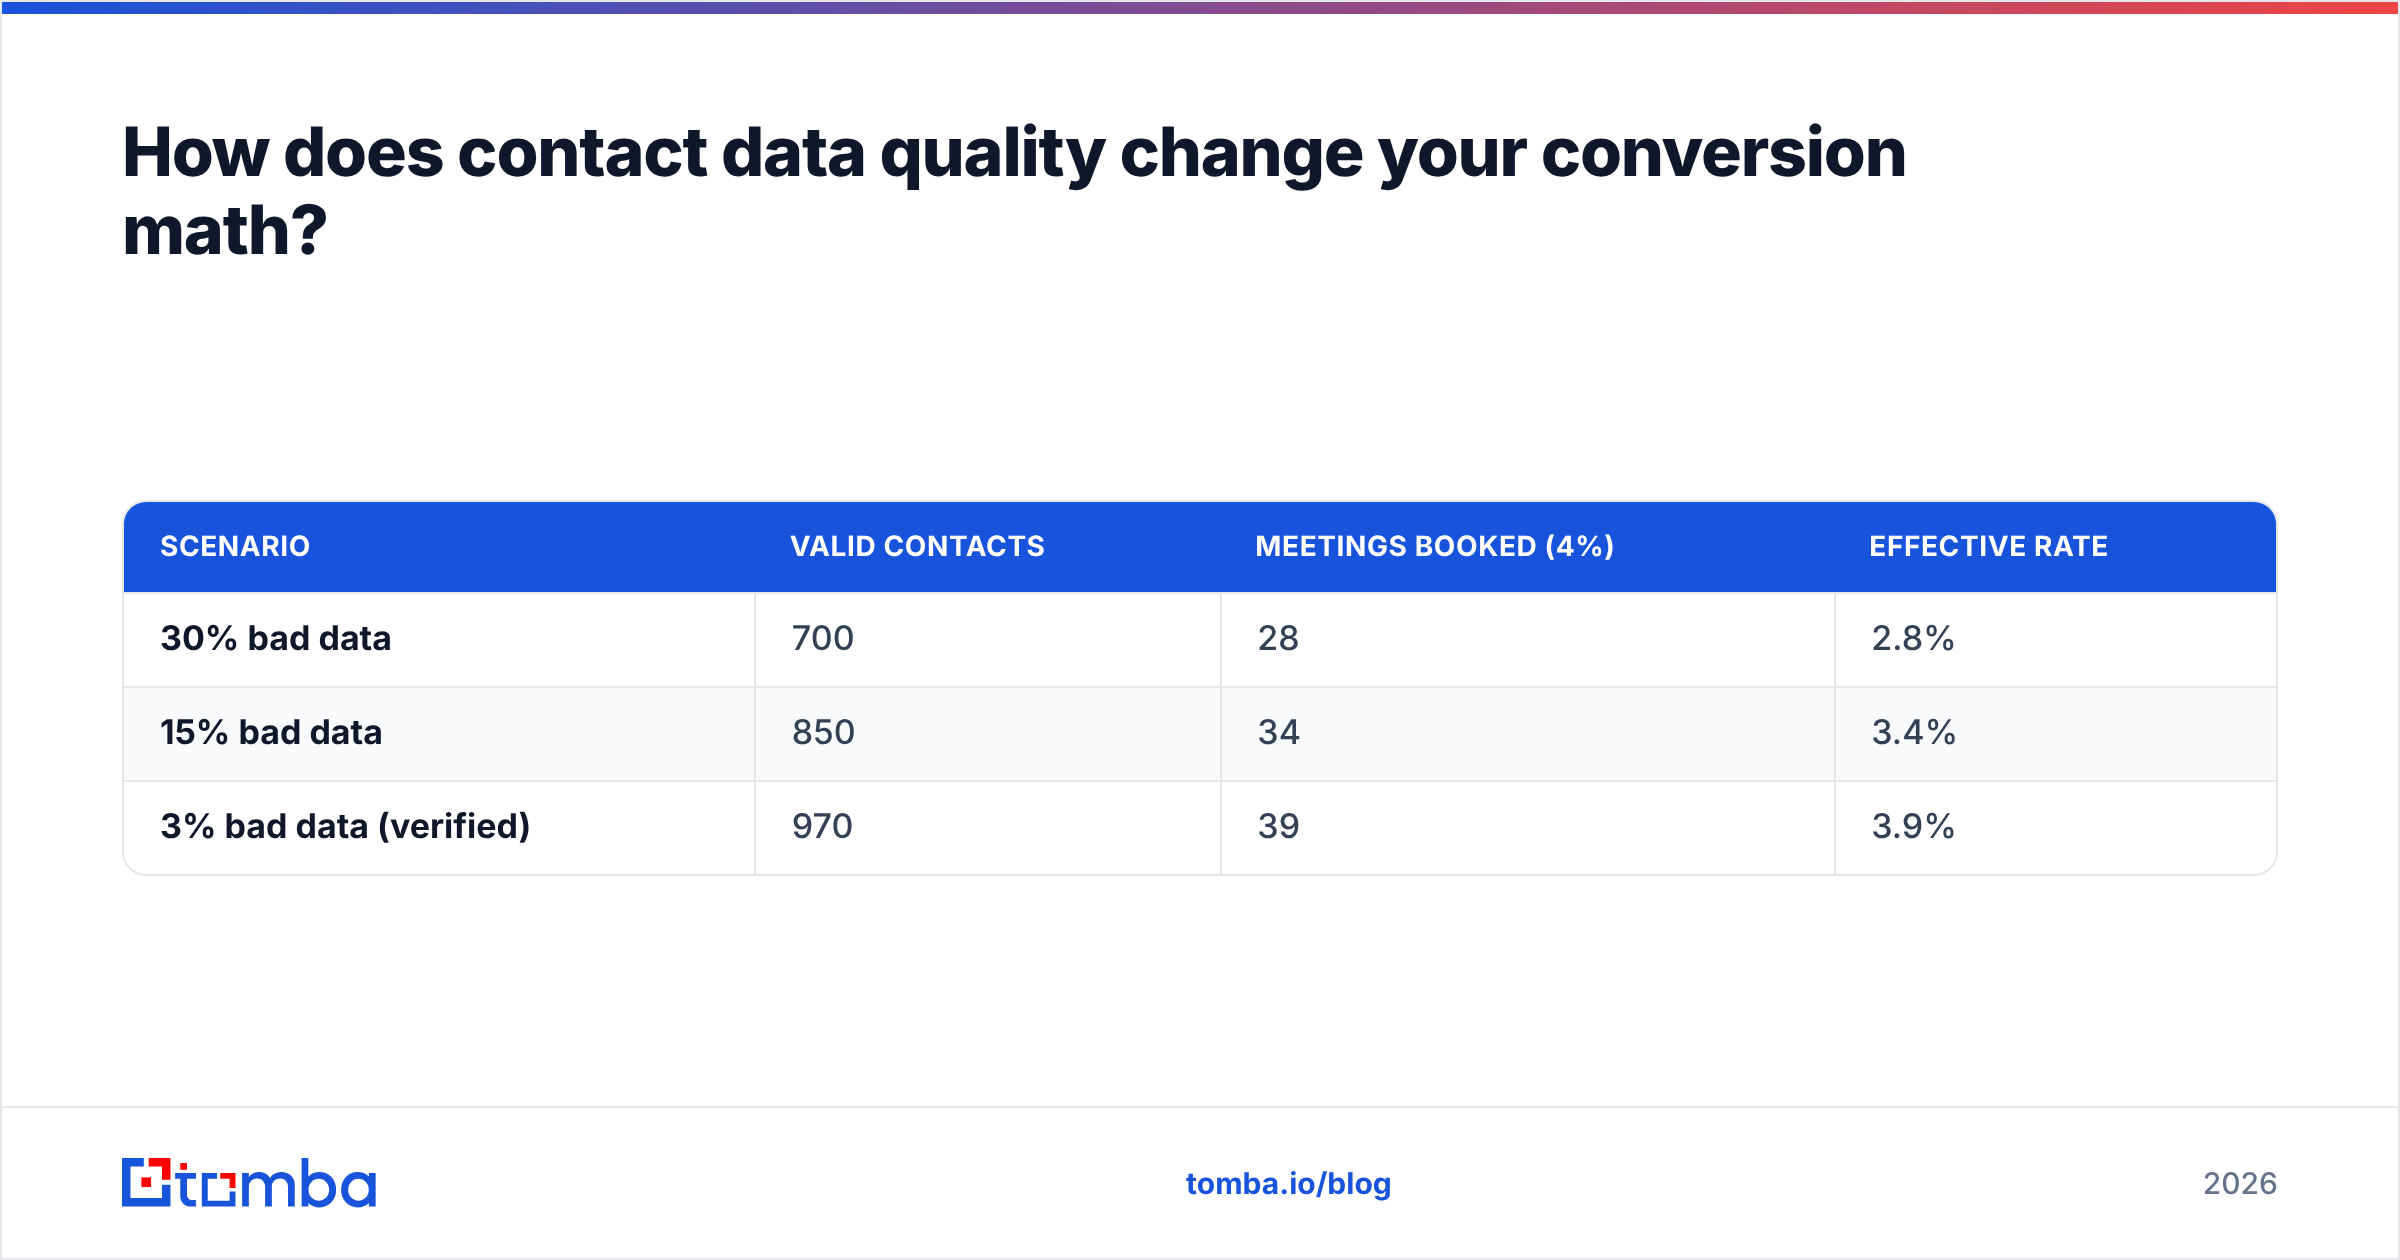
How does contact data quality change your conversion math?#
Data quality is the multiplier hiding under every stage rate. Here is the math that makes it concrete.
Imagine 1,000 cold leads and a campaign that, with perfect data, would book meetings from 4% of contacts. Watch what bad data does:
| Scenario | Valid contacts | Meetings booked (4%) | Effective rate |
|---|---|---|---|
| 30% bad data | 700 | 28 | 2.8% |
| 15% bad data | 850 | 34 | 3.4% |
| 3% bad data (verified) | 970 | 39 | 3.9% |
Same copy, same offer, same reps — a 39% swing in meetings, purely from list hygiene. And this understates the real damage, because high bounce rates also drag down your deliverability, which suppresses the inbox placement of even your valid sends. Bad data poisons the well twice.
This is why the leanest path to better B2B lead conversion rates is rarely "generate more leads." It is "stop losing the leads you already have to wrong, stale, or unverified contact records." Verify before you send, enrich so you reach decision-makers instead of generic inboxes, and re-validate your database on a schedule — contact data decays at roughly 25–30% per year as people change jobs.
If you want a deeper read on what separates accurate providers, this comparison of where Tomba gets its data explains why source diversity and real-time verification matter more than raw database size. A bigger database full of dead addresses converts worse than a smaller, verified one.
What conversion metrics should you report to leadership?#
Report the few numbers that drive decisions, not a dashboard nobody reads. Leadership needs to see where revenue leaks and what a fix is worth.
- Stage-by-stage conversion with trend arrows — shows where the funnel is tightening or leaking.
- Conversion by channel and segment — tells you where to spend the next dollar.
- Cost per converted customer by source — reframes "expensive" channels that actually convert.
- Speed-to-lead median — a leading indicator that moves before revenue does.
- Data health (bounce rate, % enriched) — the upstream metric that explains downstream swings.
Tie each metric to a dollar figure. "Our MQL→SQL rate fell 6 points" is abstract; "that 6-point drop is $180k of pipeline this quarter" gets budget. The win rate and response rate glossary entries are useful shared definitions if your team argues about what each term means.
Frequently asked questions#
What is the average B2B lead conversion rate? Blended lead-to-customer rates typically land around 2–5%, but this varies enormously by channel. Inbound demo requests can exceed 25% MQL-to-customer, while cold outbound often runs 1–3%. Always benchmark against your own channel and segment.
Is a 10% conversion rate good for B2B? At the lead→MQL or MQL→SQL stage, 10–25% is normal and healthy. As a blended lead-to-customer rate, 10% would be exceptional — likely a high-intent or referral-heavy motion. Specify the stage before judging.
How do I improve B2B conversion without more leads? Fix data quality first (verify and enrich contacts), cut speed-to-lead under five minutes, tighten MQL scoring to your ICP, and extend follow-up to 5–8 touches. These lift the funnel you already have.
How often should I clean my contact database? At least quarterly, ideally continuously. B2B contact data decays 25–30% per year as people change roles, so a list verified six months ago is already meaningfully degraded.
Start with the data layer#
If you only change one thing this quarter, fix your contact data — it is the multiplier under every stage rate in this post. Verify the addresses you have, enrich them so you reach actual decision-makers, and stop letting bounces cap your reply rate before a rep ever speaks.
Tomba's Email Finder gives you verified, source-traceable professional emails by name, company, or domain, with verification built in so your lists stay clean before launch. Start on the free tier (25 searches/month) to test accuracy on your own ICP, then scale on a paid plan from $49/month once the lift in your conversion rates pays for itself. Better data in, more deals out — that is the cheapest growth lever you have.
Ready to find emails that actually work?
Join 150,000+ professionals who stopped guessing and started sending. Free credits on signup — no credit card required.
Get the Tomba newsletter
Practical outbound tactics and product updates — once every two weeks.
About the author