B2B Lead Generation KPIs: 12 Metrics That Matter in 2026
Tracking the wrong numbers quietly drains your pipeline. Here are the 12 B2B lead generation KPIs that actually predict revenue in 2026 — with benchmarks and formulas.
(rendered separately)
Most B2B teams measure activity. The teams that hit number measure conversion. The gap between those two habits is where pipeline quietly leaks every quarter.
TL;DR
- The only B2B lead generation KPIs worth a dashboard are the ones that connect a marketing action to a closed dollar — lead-to-customer rate, CAC, pipeline velocity, and cost per SQL.
- Vanity metrics (raw lead volume, impressions, MQL count in isolation) feel productive but rarely correlate with revenue.
- Benchmark yourself against funnel-stage conversion, not against another company's totals — context is everything.
- Bad contact data corrupts almost every KPI downstream, so data accuracy is a metric in its own right.
- Track 12 KPIs at most. More than that and nobody acts on any of them.
What are B2B lead generation KPIs?#
B2B lead generation KPIs are the measurable signals that tell you whether your demand-gen engine is turning attention into qualified pipeline and, eventually, revenue. Think of them as the dashboard in a car: speed, fuel, and engine temperature each mean nothing alone, but together they tell you if you'll reach the destination.
A KPI is different from a metric. You can measure a thousand things; a KPI is the handful you've decided actually steer the business. If a number changes and nobody changes a decision because of it, it's a metric, not a KPI.
The useful ones cluster into four groups:
- Volume KPIs — how many leads, MQLs, and SQLs you generate. Necessary but dangerous in isolation.
- Conversion KPIs — the rate at which leads move from one stage to the next. This is where most insight lives.
- Efficiency KPIs — what each stage costs you (CPL, cost per SQL, CAC). These keep finance happy.
- Quality KPIs — lead score accuracy, data accuracy, and win rate by source. These separate good pipeline from busy pipeline.
)
Which lead generation KPIs actually predict revenue?#
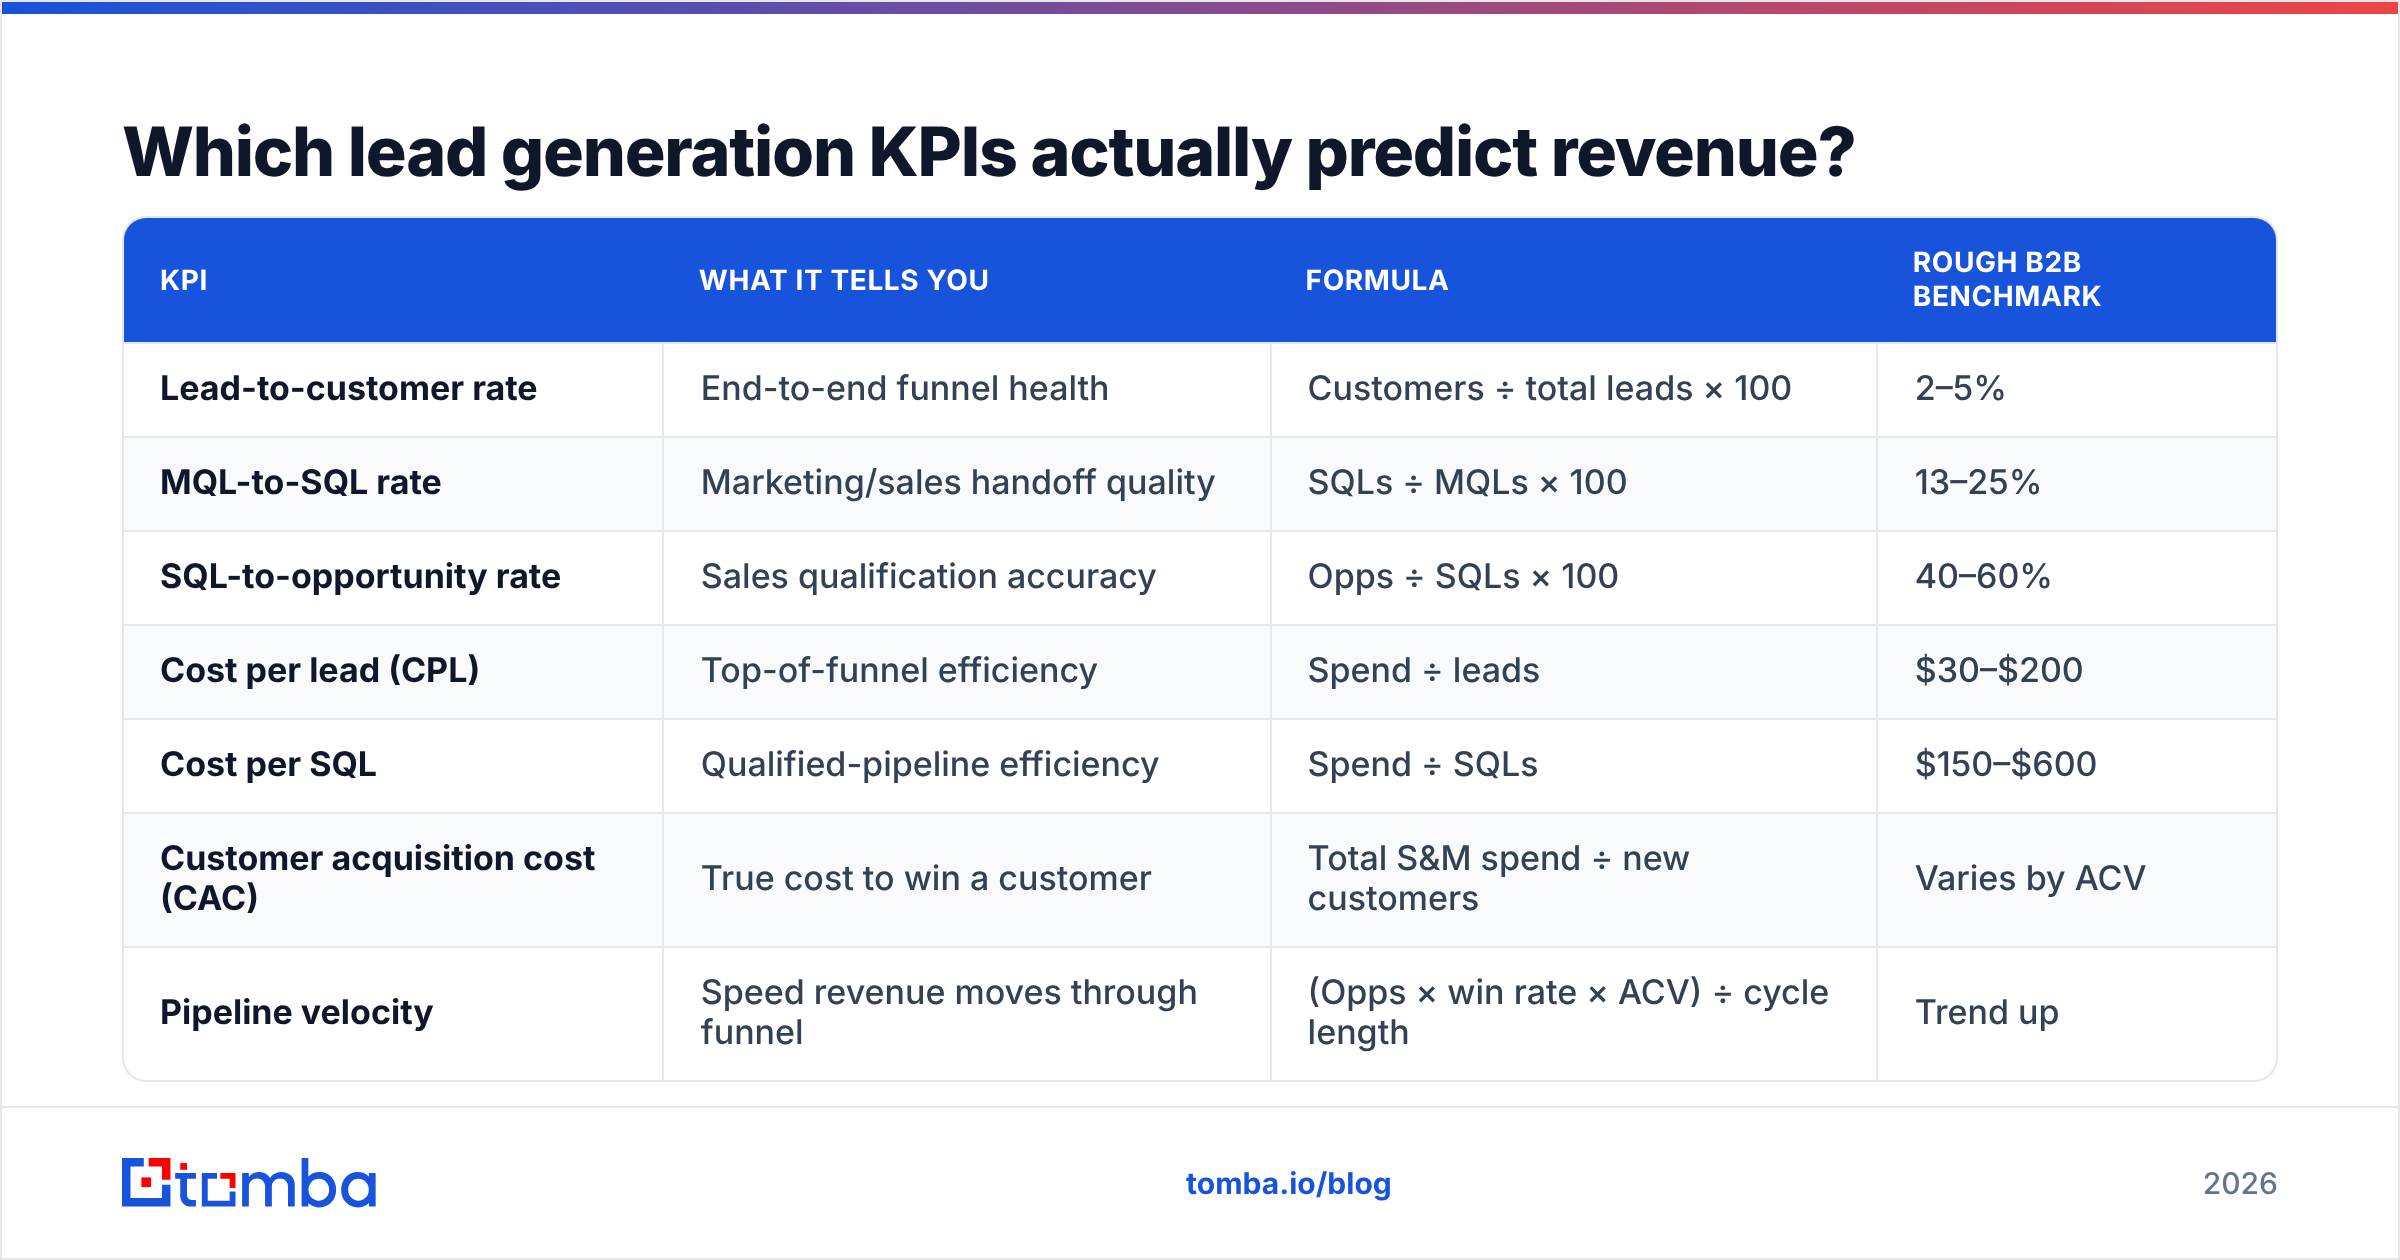
Conclusion first: conversion-rate and efficiency KPIs predict revenue far better than volume KPIs. A pile of 10,000 leads tells you nothing; a 4% lead-to-customer rate tells you exactly how many deals 10,000 leads will produce.
Here are the 12 that earn their place on a dashboard.
| KPI | What it tells you | Formula | Rough B2B benchmark |
|---|---|---|---|
| Lead-to-customer rate | End-to-end funnel health | Customers ÷ total leads × 100 | 2–5% |
| MQL-to-SQL rate | Marketing/sales handoff quality | SQLs ÷ MQLs × 100 | 13–25% |
| SQL-to-opportunity rate | Sales qualification accuracy | Opps ÷ SQLs × 100 | 40–60% |
| Cost per lead (CPL) | Top-of-funnel efficiency | Spend ÷ leads | $30–$200 |
| Cost per SQL | Qualified-pipeline efficiency | Spend ÷ SQLs | $150–$600 |
| Customer acquisition cost (CAC) | True cost to win a customer | Total S&M spend ÷ new customers | Varies by ACV |
| Pipeline velocity | Speed revenue moves through funnel | (Opps × win rate × ACV) ÷ cycle length | Trend up |
| Average deal size (ACV) | Revenue quality per win | Total new ARR ÷ new customers | Segment-dependent |
| Win rate | Closing effectiveness | Won ÷ total closed opps × 100 | 15–30% |
| Lead response time | Speed-to-lead discipline | Time from inbound to first touch | < 5 min ideal |
| Data accuracy rate | Reliability of every other KPI | Valid records ÷ total records × 100 | 95%+ target |
| Marketing-sourced pipeline % | Marketing's revenue contribution | Marketing-sourced opps ÷ all opps × 100 | 30–50% |
You don't need all twelve from day one. Start with lead-to-customer rate, cost per SQL, and pipeline velocity. Those three alone will expose most of what's broken.
For definitions of supporting terms, the B2B glossary is a quick reference, and the win rate entry breaks down the nuance between gross and net win rates.
Why do volume KPIs mislead so many teams?#
Because volume feels like progress. A chart that goes up and to the right triggers the same reward response whether the line is "qualified pipeline" or "form fills from a free e-book that nobody who downloads it ever buys."
Three traps to watch:
- Lead count without qualification. Doubling raw leads while halving lead quality leaves you with identical pipeline and double the sales workload.
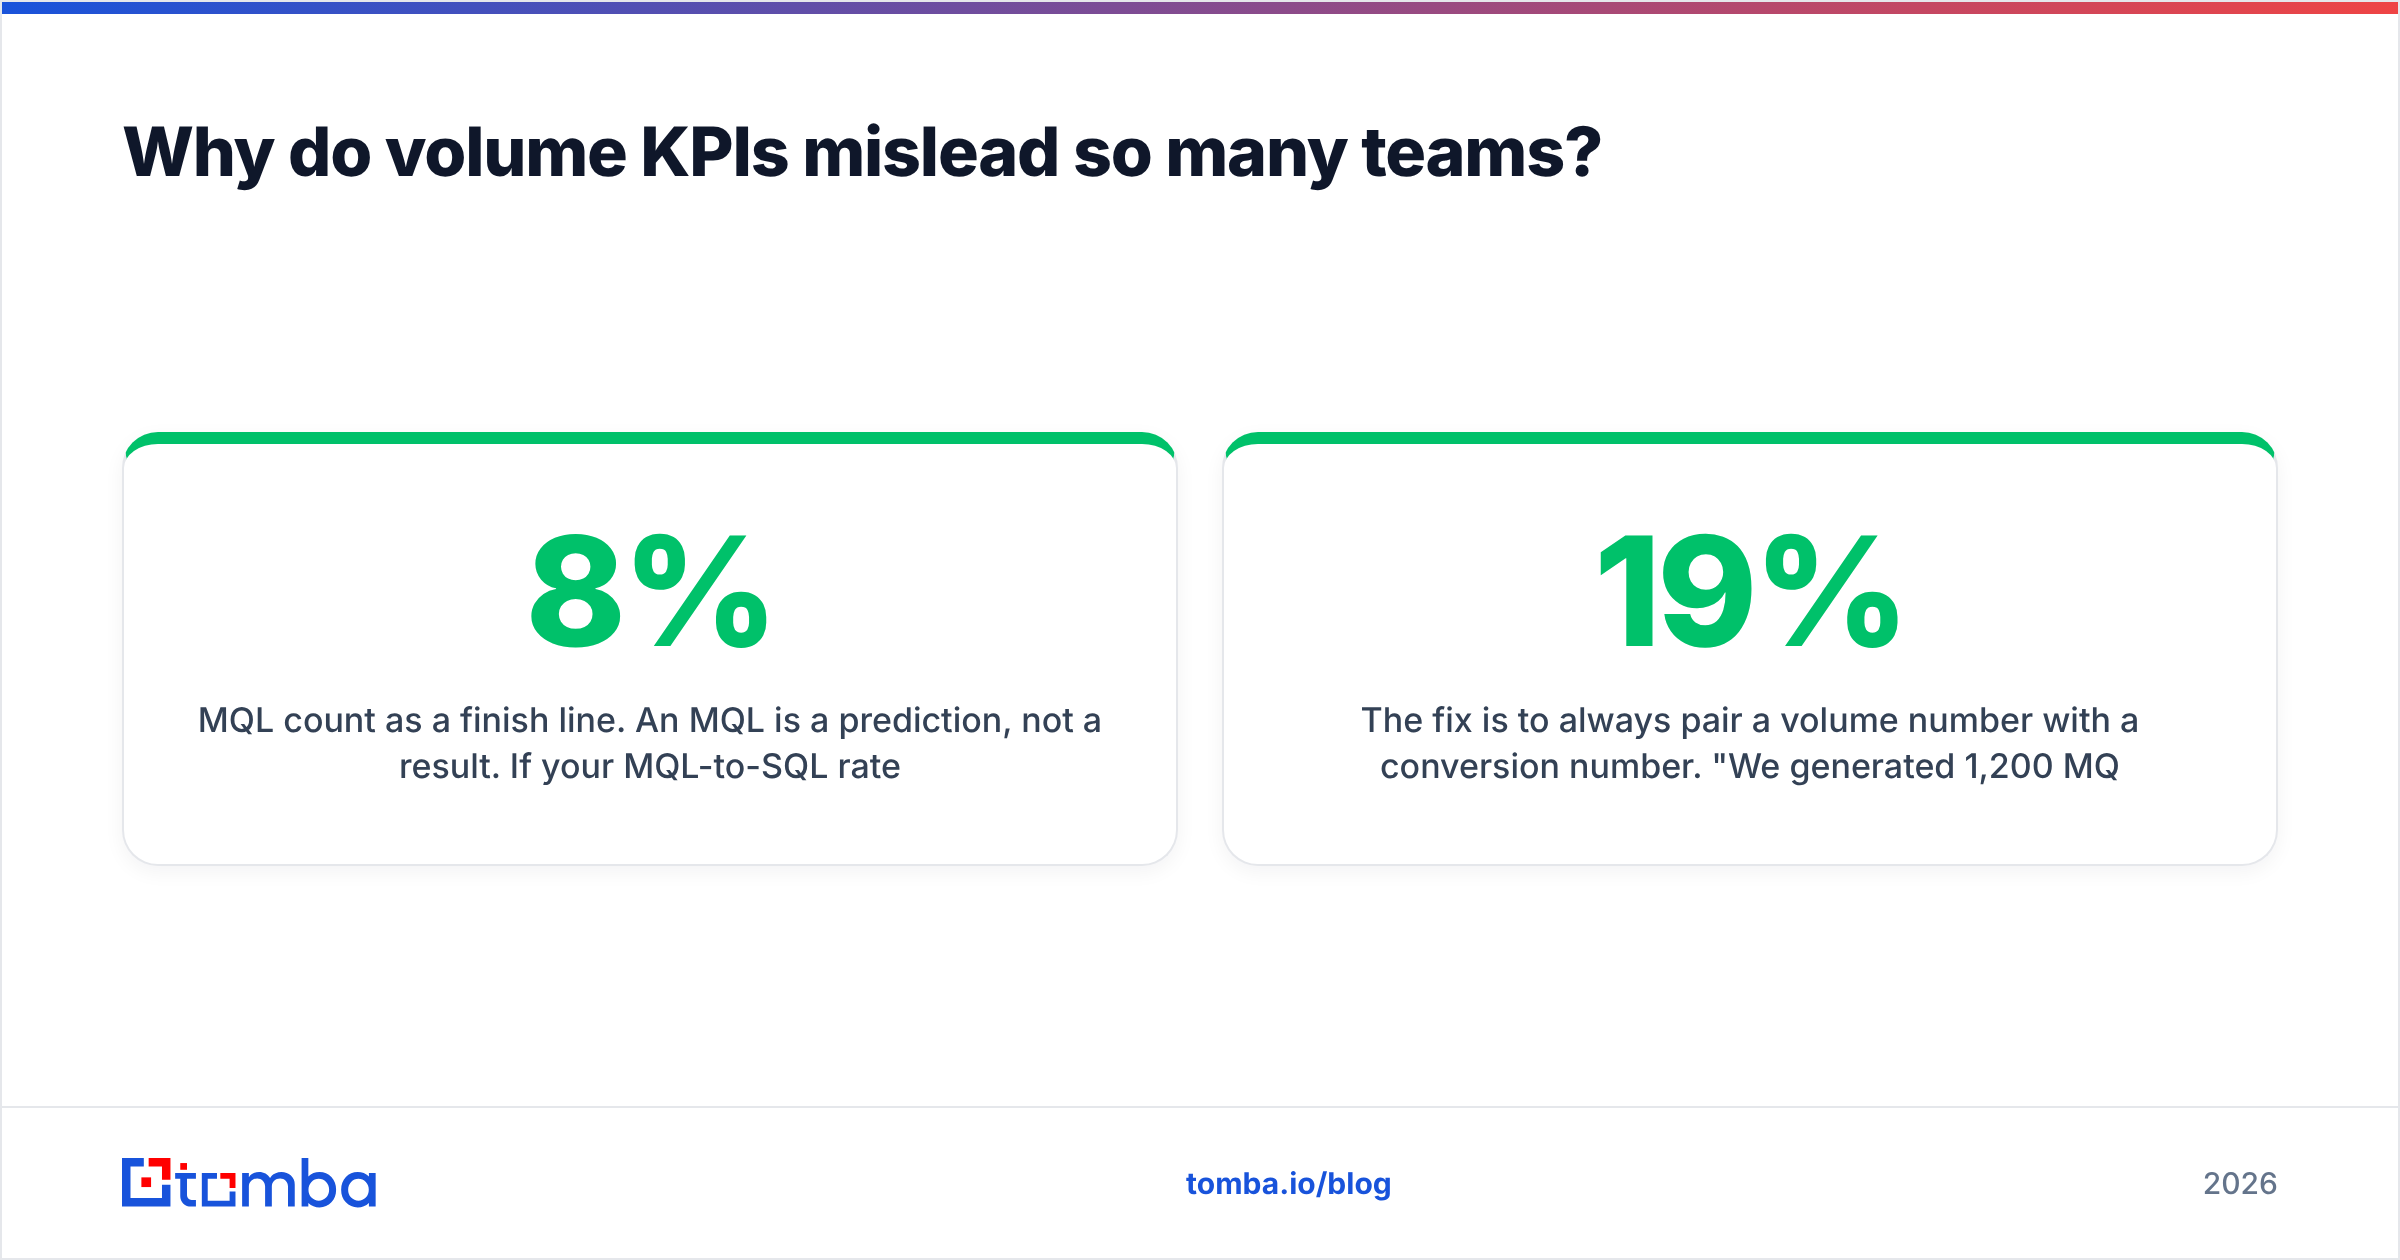
- MQL count as a finish line. An MQL is a prediction, not a result. If your MQL-to-SQL rate is 8%, your MQL definition is broken, not your demand gen.
- Impressions and clicks as KPIs. These are diagnostic metrics for a campaign, not business KPIs. Report them inside a channel review, never on the revenue dashboard.
The fix is to always pair a volume number with a conversion number. "We generated 1,200 MQLs" means nothing. "We generated 1,200 MQLs at a 19% MQL-to-SQL rate and $210 cost per SQL" means everything. According to HubSpot's research on conversion benchmarks, the spread between top- and bottom-quartile teams is almost entirely a conversion story, not a volume one.
How do you calculate the core lead generation KPIs?#
Conclusion first: every core KPI is a simple ratio, and the only hard part is clean inputs. Here's how the most important ones work.
Lead-to-customer rate. Take customers won in a period and divide by the leads that entered the funnel in the matching cohort window — not the same calendar month, since a deal closed in June rarely came from a June lead. Multiply by 100.
Cost per SQL. Add all spend that produced sales-qualified leads (ad spend, content, tooling, the loaded cost of the SDR team) and divide by the number of SQLs. This is more honest than CPL because it filters out the junk leads CPL happily counts.
Pipeline velocity. Multiply your number of open opportunities by win rate by average deal size, then divide by the average sales cycle length in days. The output is dollars-per-day moving through your funnel. Improving any one of the four inputs moves it — which is why it's the single best summary KPI for a GTM team. The mechanics of revenue operations exist largely to keep these four inputs trustworthy.
CAC. Total sales and marketing spend divided by new customers acquired in the same period. Pair it with lifetime value; CAC alone is a cost, not a verdict.
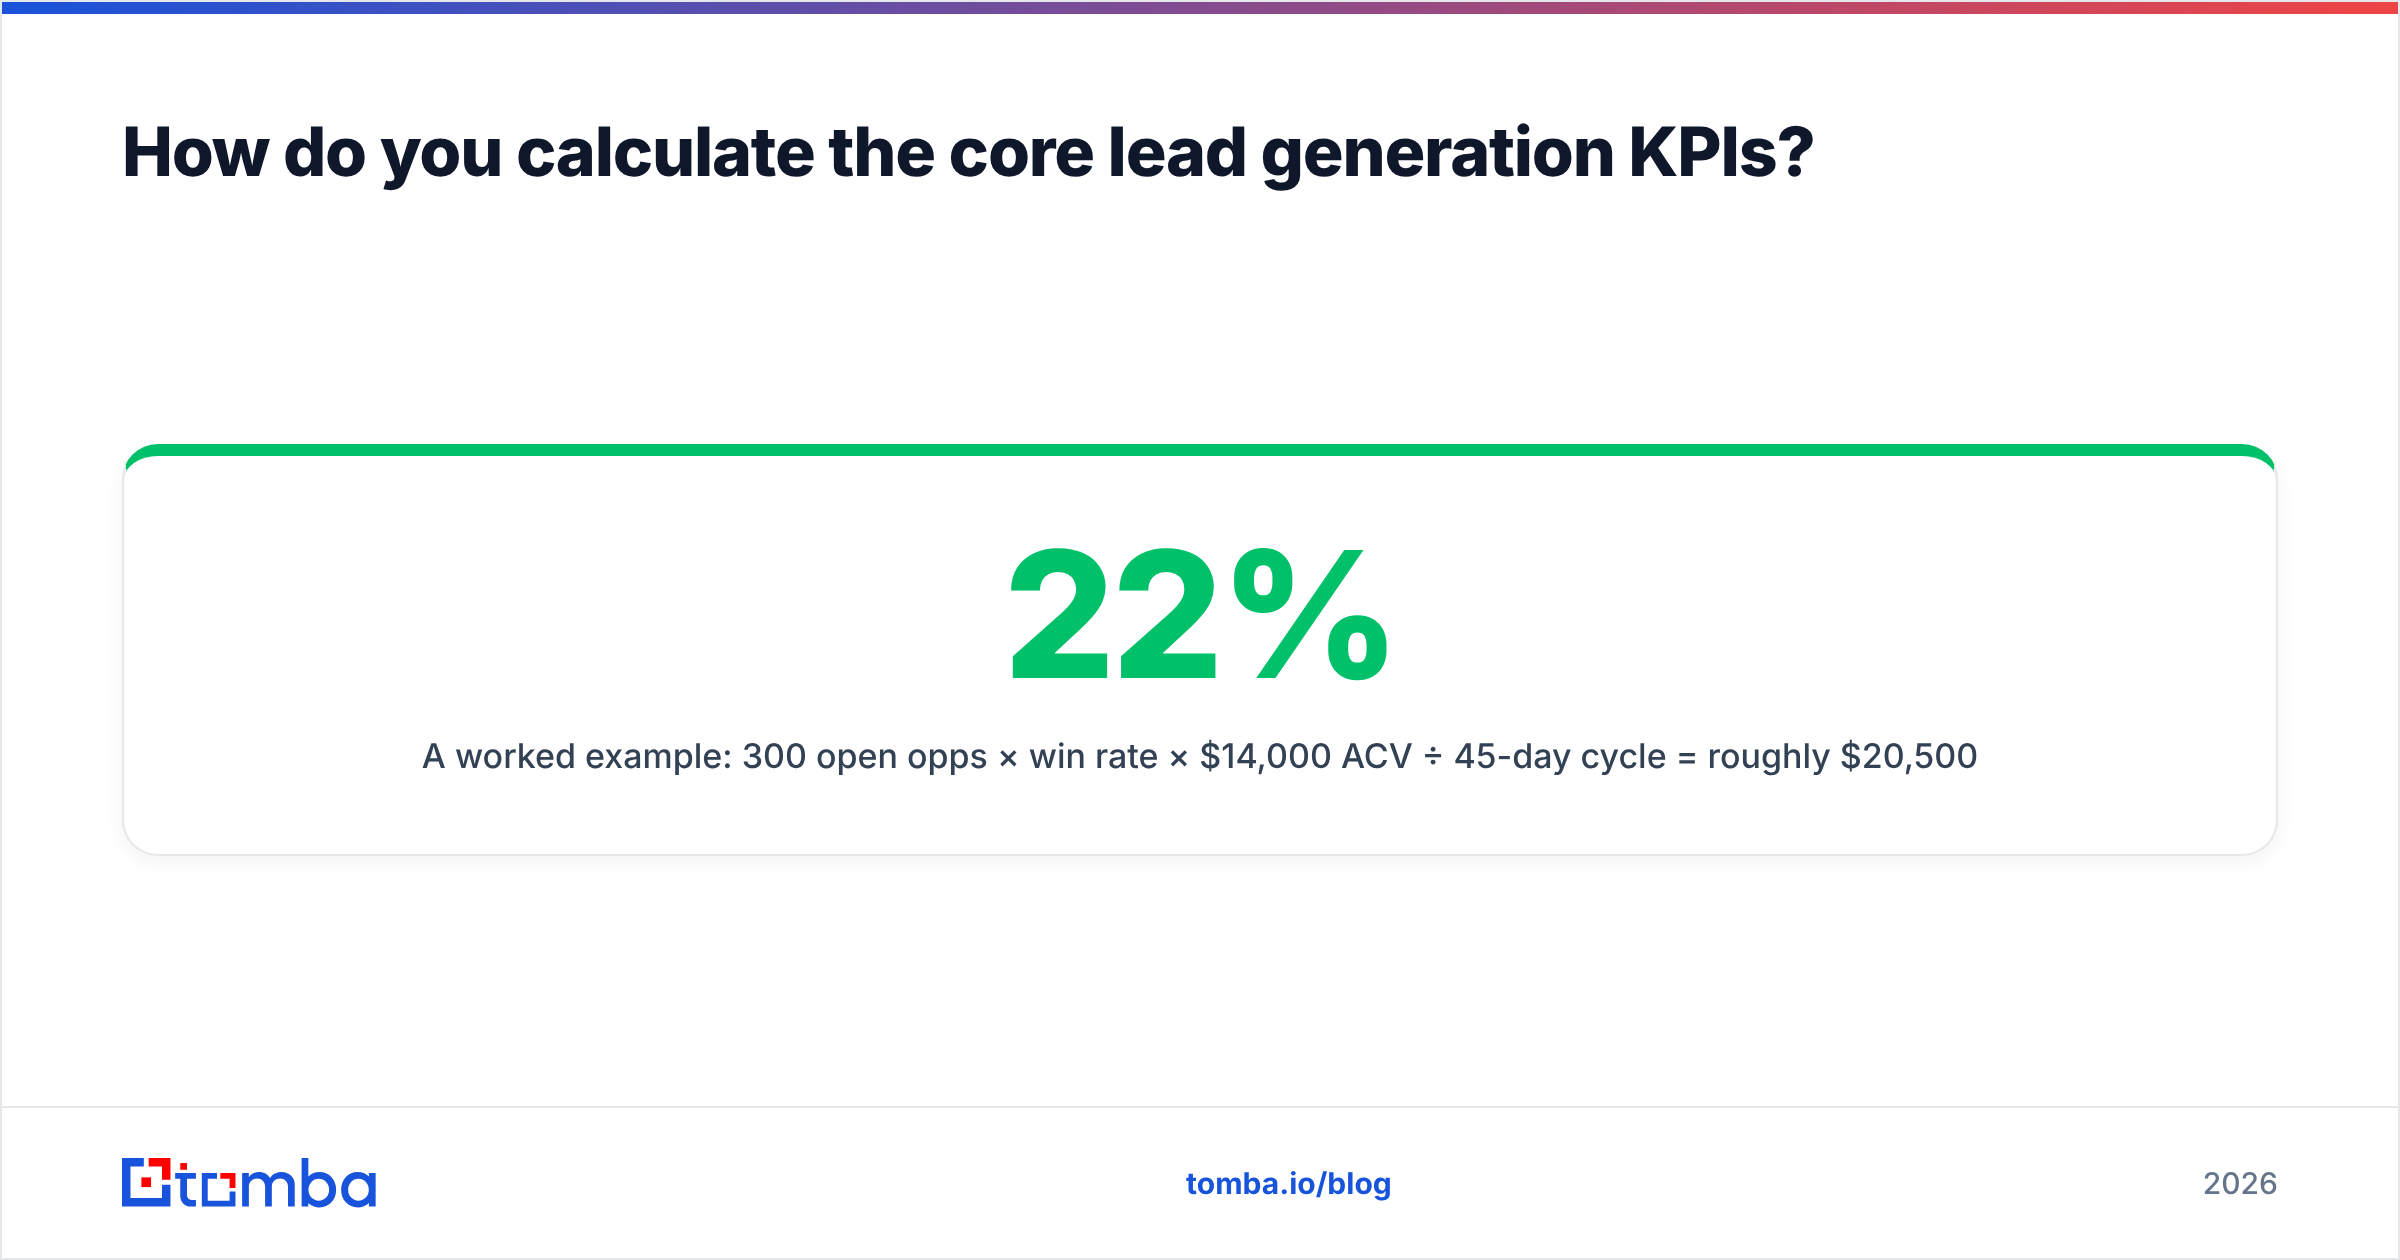
A worked example: 300 open opps × 22% win rate × $14,000 ACV ÷ 45-day cycle = roughly $20,500 of pipeline velocity per day. Shorten the cycle to 38 days and you've added over $3,000/day without generating a single new lead.
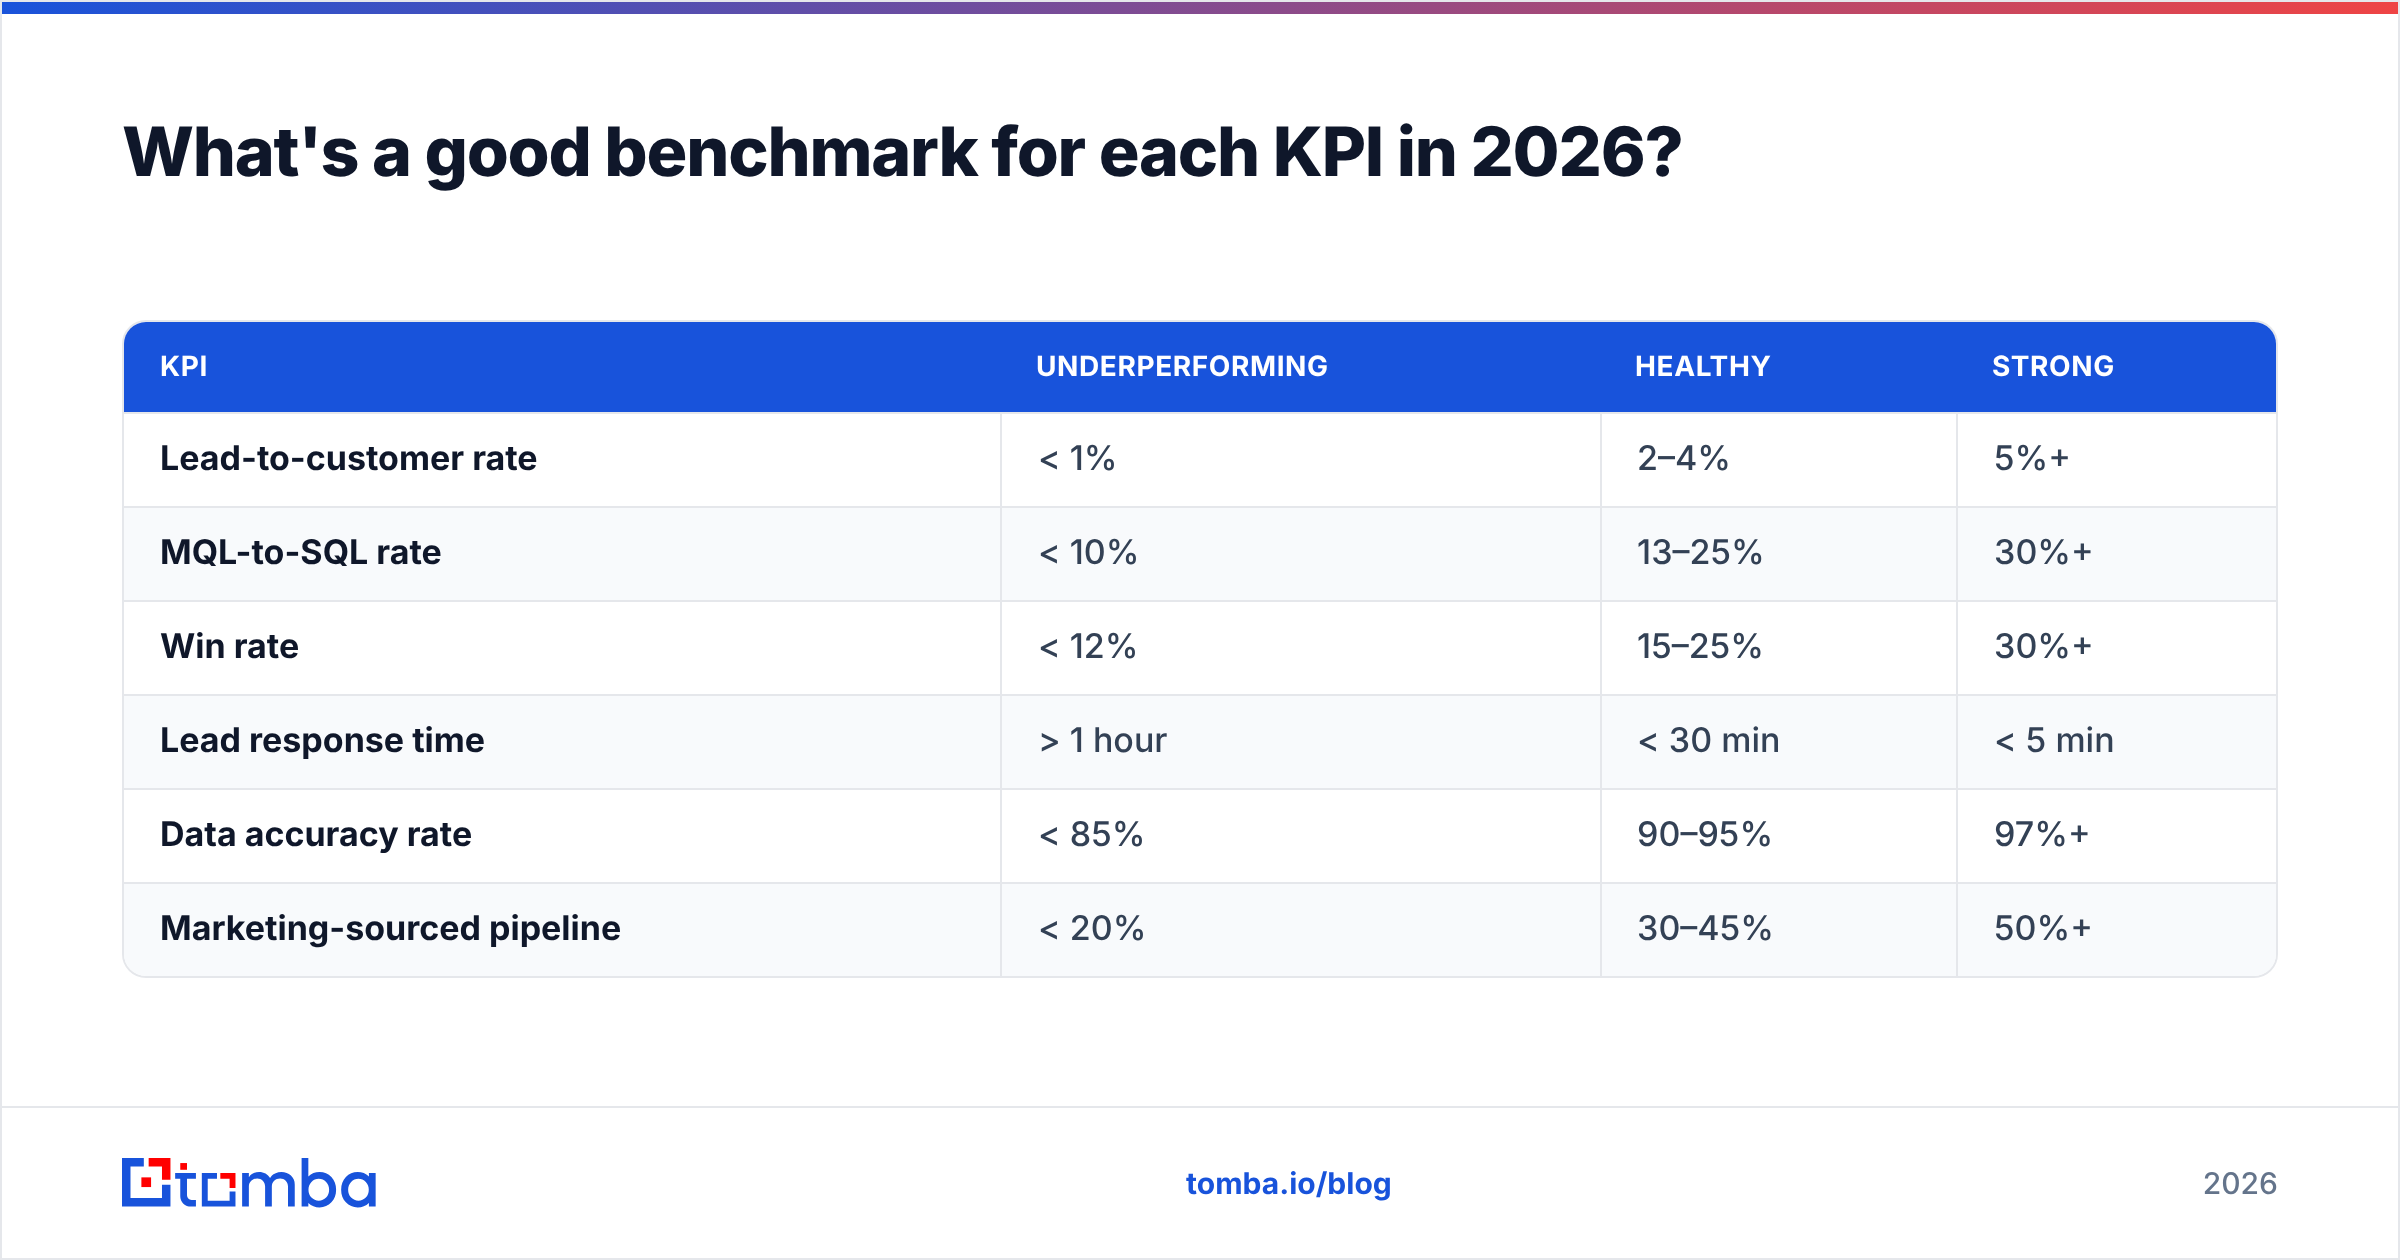
What's a good benchmark for each KPI in 2026?#
Benchmarks are guardrails, not goals — your segment, ACV, and motion shift every range. That said, here's how to read your own numbers.
| KPI | Underperforming | Healthy | Strong |
|---|---|---|---|
| Lead-to-customer rate | < 1% | 2–4% | 5%+ |
| MQL-to-SQL rate | < 10% | 13–25% | 30%+ |
| Win rate | < 12% | 15–25% | 30%+ |
| Lead response time | > 1 hour | < 30 min | < 5 min |
| Data accuracy rate | < 85% | 90–95% | 97%+ |
| Marketing-sourced pipeline | < 20% | 30–45% | 50%+ |
A few honest caveats. High-ACV enterprise motions run lower win rates and longer cycles — that's structural, not a failure. Product-led and self-serve motions can post sky-high lead volumes with tiny per-lead value, so cost per SQL matters more than CPL. Independent review sites like G2 and analyst notes from Gartner are useful for sanity-checking expectations by category before you panic over a single number.
)
How does data quality affect your KPIs?#
It affects all of them — silently. Conclusion first: dirty contact data inflates your volume KPIs and destroys your efficiency and conversion KPIs at the same time, so you look busy while burning budget.
Walk the chain. A lead with a wrong or dead email never opens your nurture. It counts in your lead total (volume looks fine), fails to convert (your MQL-to-SQL rate drops), and still consumed acquisition spend (your cost per SQL rises). One bad record damages three KPIs. Multiply that by a 15% industry-typical decay rate on B2B contact data per year and the rot compounds fast.
This is why data accuracy deserves to be a KPI, not an afterthought. Measure it: take a sample of your CRM, verify it, and report the valid-record percentage on the same dashboard as everything else. If accuracy sits below 90%, fix that before you spend another dollar on top-of-funnel.
Practical defenses:
- Verify at capture. Run new contacts through an email verifier before they enter nurture, so invalid addresses never pollute your funnel.
- Enrich thin records. A name and a company aren't a lead. Data enrichment fills in role, seniority, and verified contact details so scoring is based on reality.
- Source clean contacts. When you build target lists, an accurate email finder keeps your starting data trustworthy instead of guessing patterns that bounce.
- Re-verify quarterly. Decay never stops, so neither should hygiene.
How do you build a KPI dashboard your team will use?#
The best dashboard fits on one screen and drives one weekly conversation. If it needs a scroll bar, it's a report, not a dashboard.
A simple structure that works:
- One north-star line. Usually pipeline velocity or marketing-sourced pipeline. This is the number the whole team rallies around.
- Three funnel-conversion rates. Lead-to-MQL, MQL-to-SQL, SQL-to-opportunity. These show exactly where leads stall.
- Two efficiency numbers. Cost per SQL and CAC, to keep growth honest.
- One quality gate. Data accuracy rate, so nobody trusts a number built on broken inputs.
- One leading indicator. Lead response time — it predicts next month's conversion better than almost anything else.
Set a cadence: review weekly, act on trends not single data points, and attach an owner to every KPI. An orphaned KPI is a decoration. Pull contact and account data straight from your CRM via integrations — Tomba connects to HubSpot and Salesforce so enriched, verified records flow into the same system your dashboards read from.
Which KPIs should marketing and sales share?#
Both teams should own the handoff KPIs jointly, or the funnel breaks at the seam. The shared set: MQL-to-SQL rate, lead response time, and marketing-sourced pipeline percentage.
When marketing is measured only on lead volume and sales only on closed revenue, the handoff becomes a blame zone. Tie a portion of both teams' targets to the conversion rate between their stages and the finger-pointing stops, because the metric only improves when they cooperate. A shared SLA — marketing commits to lead quality and volume, sales commits to a response time and follow-up count — turns those KPIs into a contract instead of a scoreboard.
Common mistakes to avoid#
- Tracking everything. Twelve KPIs is a ceiling, not a target. Pick the five that drive decisions this quarter.
- Comparing raw totals across companies. Your competitor's 50,000 leads are meaningless without their conversion rates and ACV. Benchmark ratios, not volumes.
- Ignoring the cohort lag. Matching this month's closed deals to this month's new leads will make your conversion rate look chaotic. Use cohort windows.
- Letting data rot. The most sophisticated KPI framework collapses on bad inputs. Treat hygiene as ongoing, not a one-time cleanup.
- No owner, no action. Every KPI needs a name next to it and a decision it's meant to trigger.
The bottom line#
The B2B lead generation KPIs that matter in 2026 aren't the ones that go up the fastest — they're the ones that connect a marketing action to a closed dollar. Lead-to-customer rate, cost per SQL, pipeline velocity, and data accuracy will tell you more about next quarter than any impression count ever will. Track twelve at most, benchmark ratios instead of totals, and protect the data underneath every metric.
That last point is where most of the leakage hides. If your conversion KPIs are sliding and you can't explain why, start with your contact data before you blame your campaigns. Run your target accounts and inbound leads through the Tomba Email Finder to start from verified, accurate contacts — and pair it with the email verifier so the numbers on your dashboard reflect real, reachable people. Clean inputs in, trustworthy KPIs out. You can test it on the free tier (25 searches/month) and scale up through Tomba's plans as your pipeline grows.
Ready to find emails that actually work?
Join 150,000+ professionals who stopped guessing and started sending. Free credits on signup — no credit card required.
Get the Tomba newsletter
Practical outbound tactics and product updates — once every two weeks.
About the author