B2B Marketing Benchmarks 2026: The KPIs That Actually Matter
What does "good" actually look like in 2026? Real B2B marketing benchmarks for email, conversion, CAC, and pipeline — plus how to beat them with cleaner data.
You can't tell if your numbers are good until you know what "good" looks like for everyone else. That's the whole point of benchmarks — and in B2B, the gap between a healthy funnel and a leaky one is usually invisible until you line your metrics up against a credible reference set.
This guide pulls together the B2B marketing benchmarks that actually move revenue in 2026: email engagement, landing-page conversion, MQL-to-SQL handoff, customer acquisition cost (CAC), and pipeline velocity. More importantly, it shows you where most teams quietly underperform — and the one input that fixes more of them than any new tactic: clean, accurate contact data.
TL;DR#
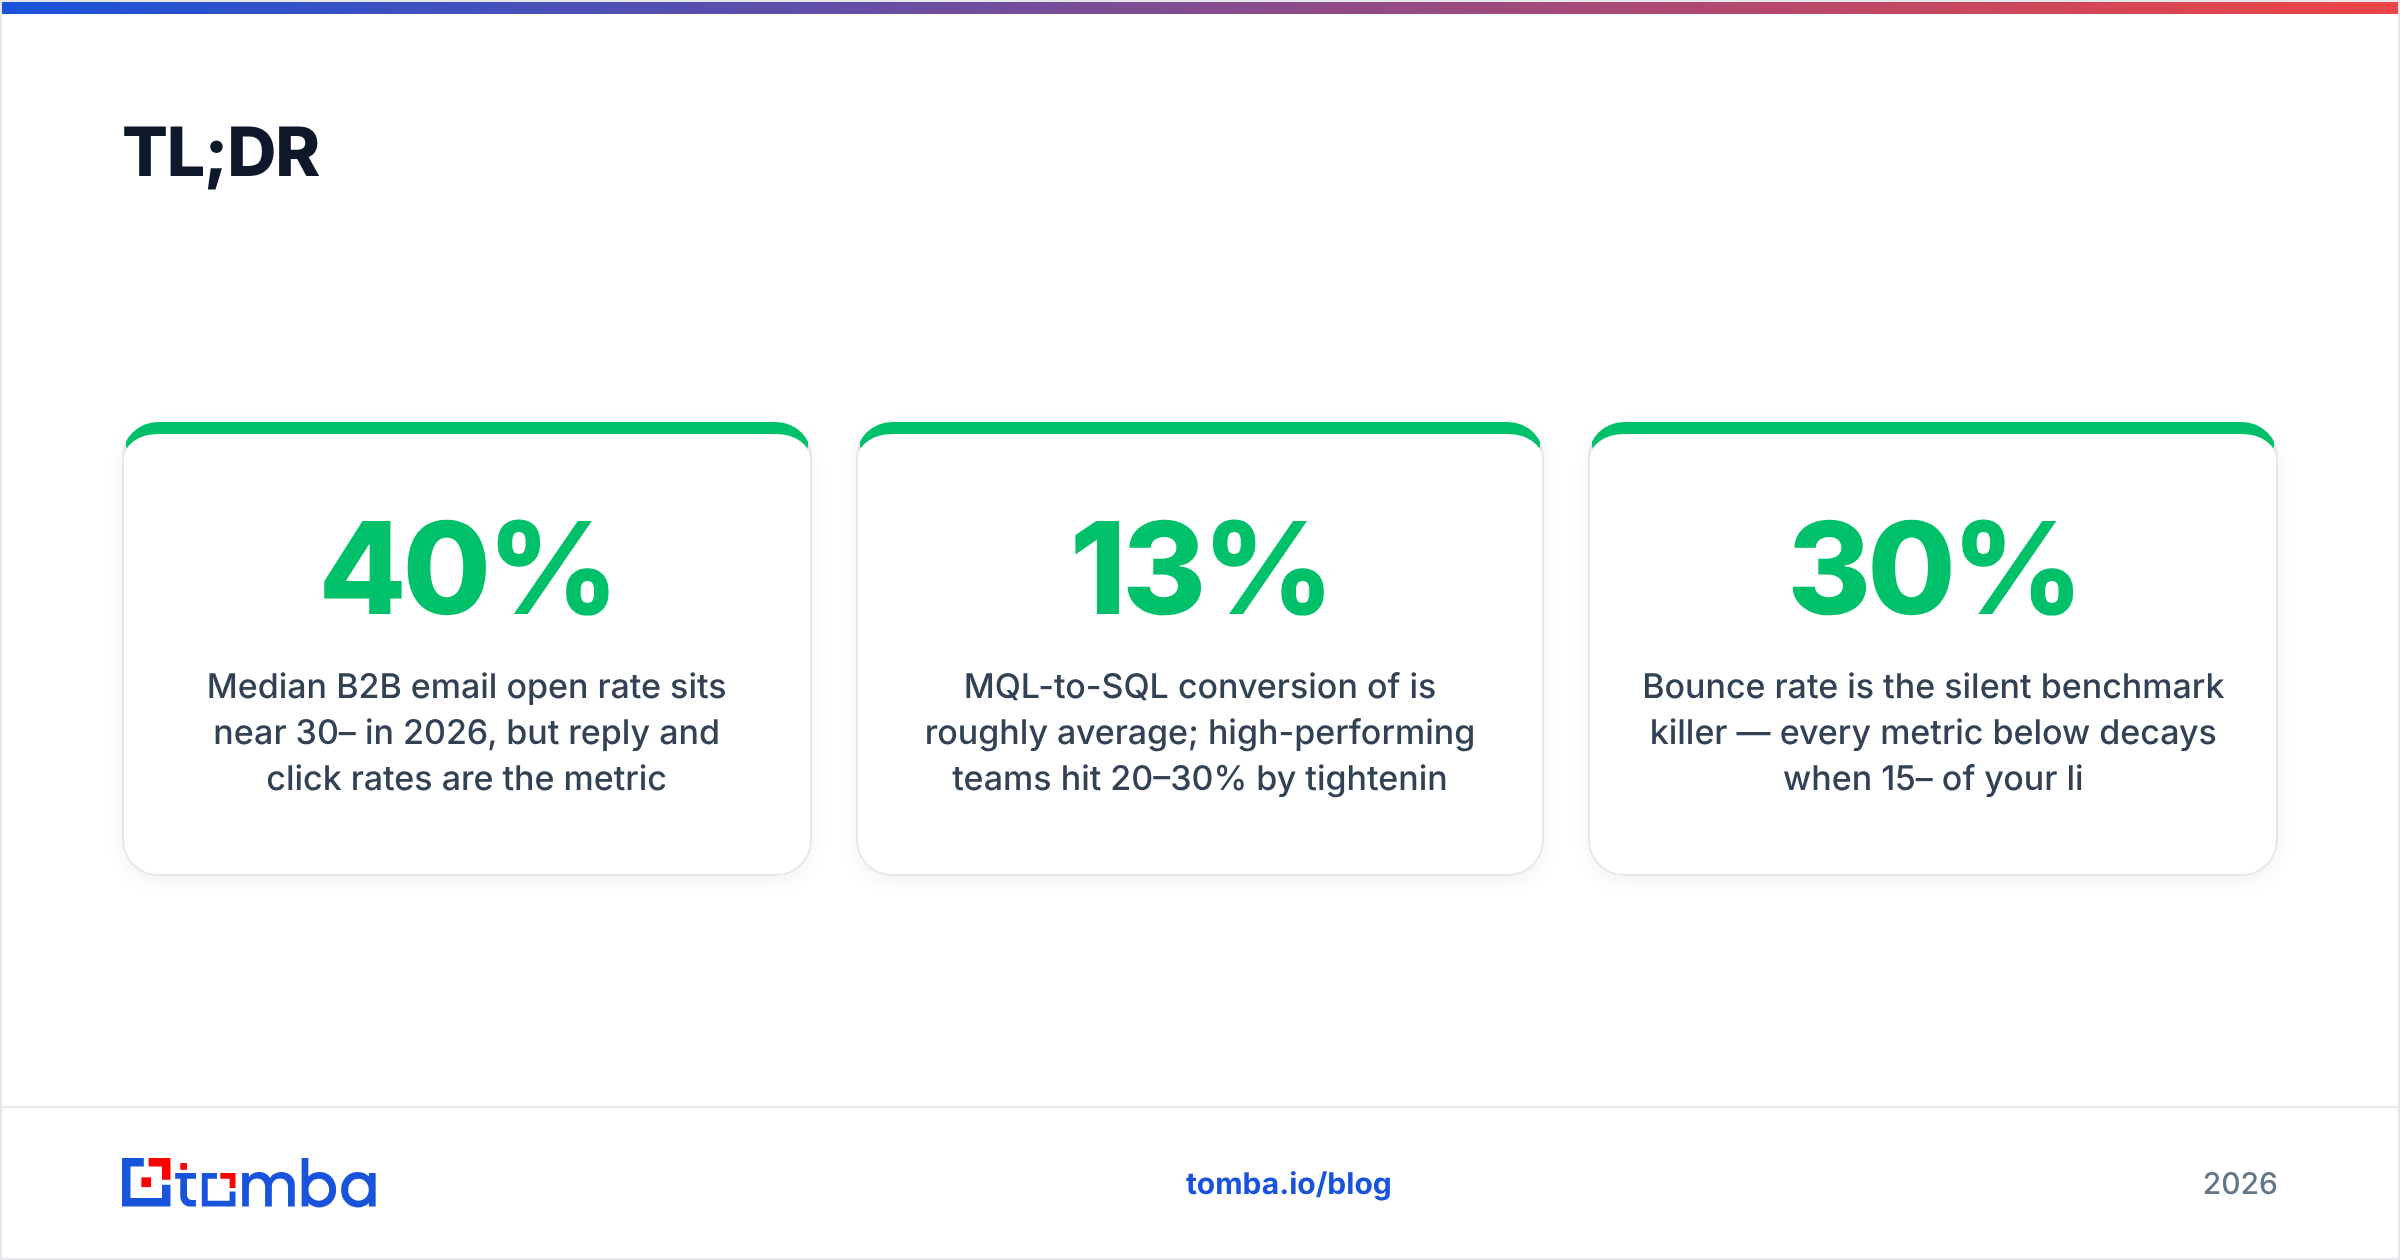
- Median B2B email open rate sits near 30–40% in 2026, but reply and click rates are the metrics that predict pipeline — aim for 1–5% reply on cold, 3%+ click on nurture.
- MQL-to-SQL conversion of 13% is roughly average; high-performing teams hit 20–30% by tightening lead definitions, not by generating more leads.
- CAC payback under 12 months is the modern target; anything past 18 months signals a targeting or data problem upstream.
- Bounce rate is the silent benchmark killer — every metric below decays when 15–30% of your list is invalid. Verifying contacts first lifts deliverability, open rate, and sender reputation at once.
- Benchmarks are a compass, not a scoreboard. Segment by industry, deal size, and motion before you judge yourself against any median.
What counts as a B2B marketing benchmark in 2026?#
A benchmark is a reference range that tells you whether a number is healthy, mediocre, or broken. Think of it like a blood-pressure chart: 120/80 means nothing in isolation, but against the population range it instantly tells a doctor where you stand.
B2B benchmarks split into four families, and most teams over-index on the first while ignoring the last three:
- Engagement metrics — open rate, click-through rate, reply rate. Easy to measure, easy to inflate, weakly tied to revenue on their own.
- Conversion metrics — visitor-to-lead, lead-to-MQL, MQL-to-SQL, SQL-to-close. These tell you where the funnel leaks.
- Efficiency metrics — CAC, CAC payback, LTV:CAC ratio, marketing-sourced pipeline. These tell you whether growth is sustainable.
- Data-quality metrics — bounce rate, list accuracy, enrichment coverage. These are the foundation the other three sit on.
The mistake is treating these as four separate scoreboards. They're a chain. A 30% open rate looks fine until you realize a quarter of your sends bounced, your marketing qualified lead definition is loose, and your CAC is climbing because reps chase unqualified contacts. Benchmarks only help when you read them as a system.
)
What are the B2B email marketing benchmarks for 2026?#
Short answer: open rates have inflated, so judge yourself on clicks, replies, and bounces — not opens. Apple Mail Privacy Protection and similar features auto-load images, which means a meaningful share of "opens" are machines, not humans. The metrics that survived that shift are the ones tied to intent.
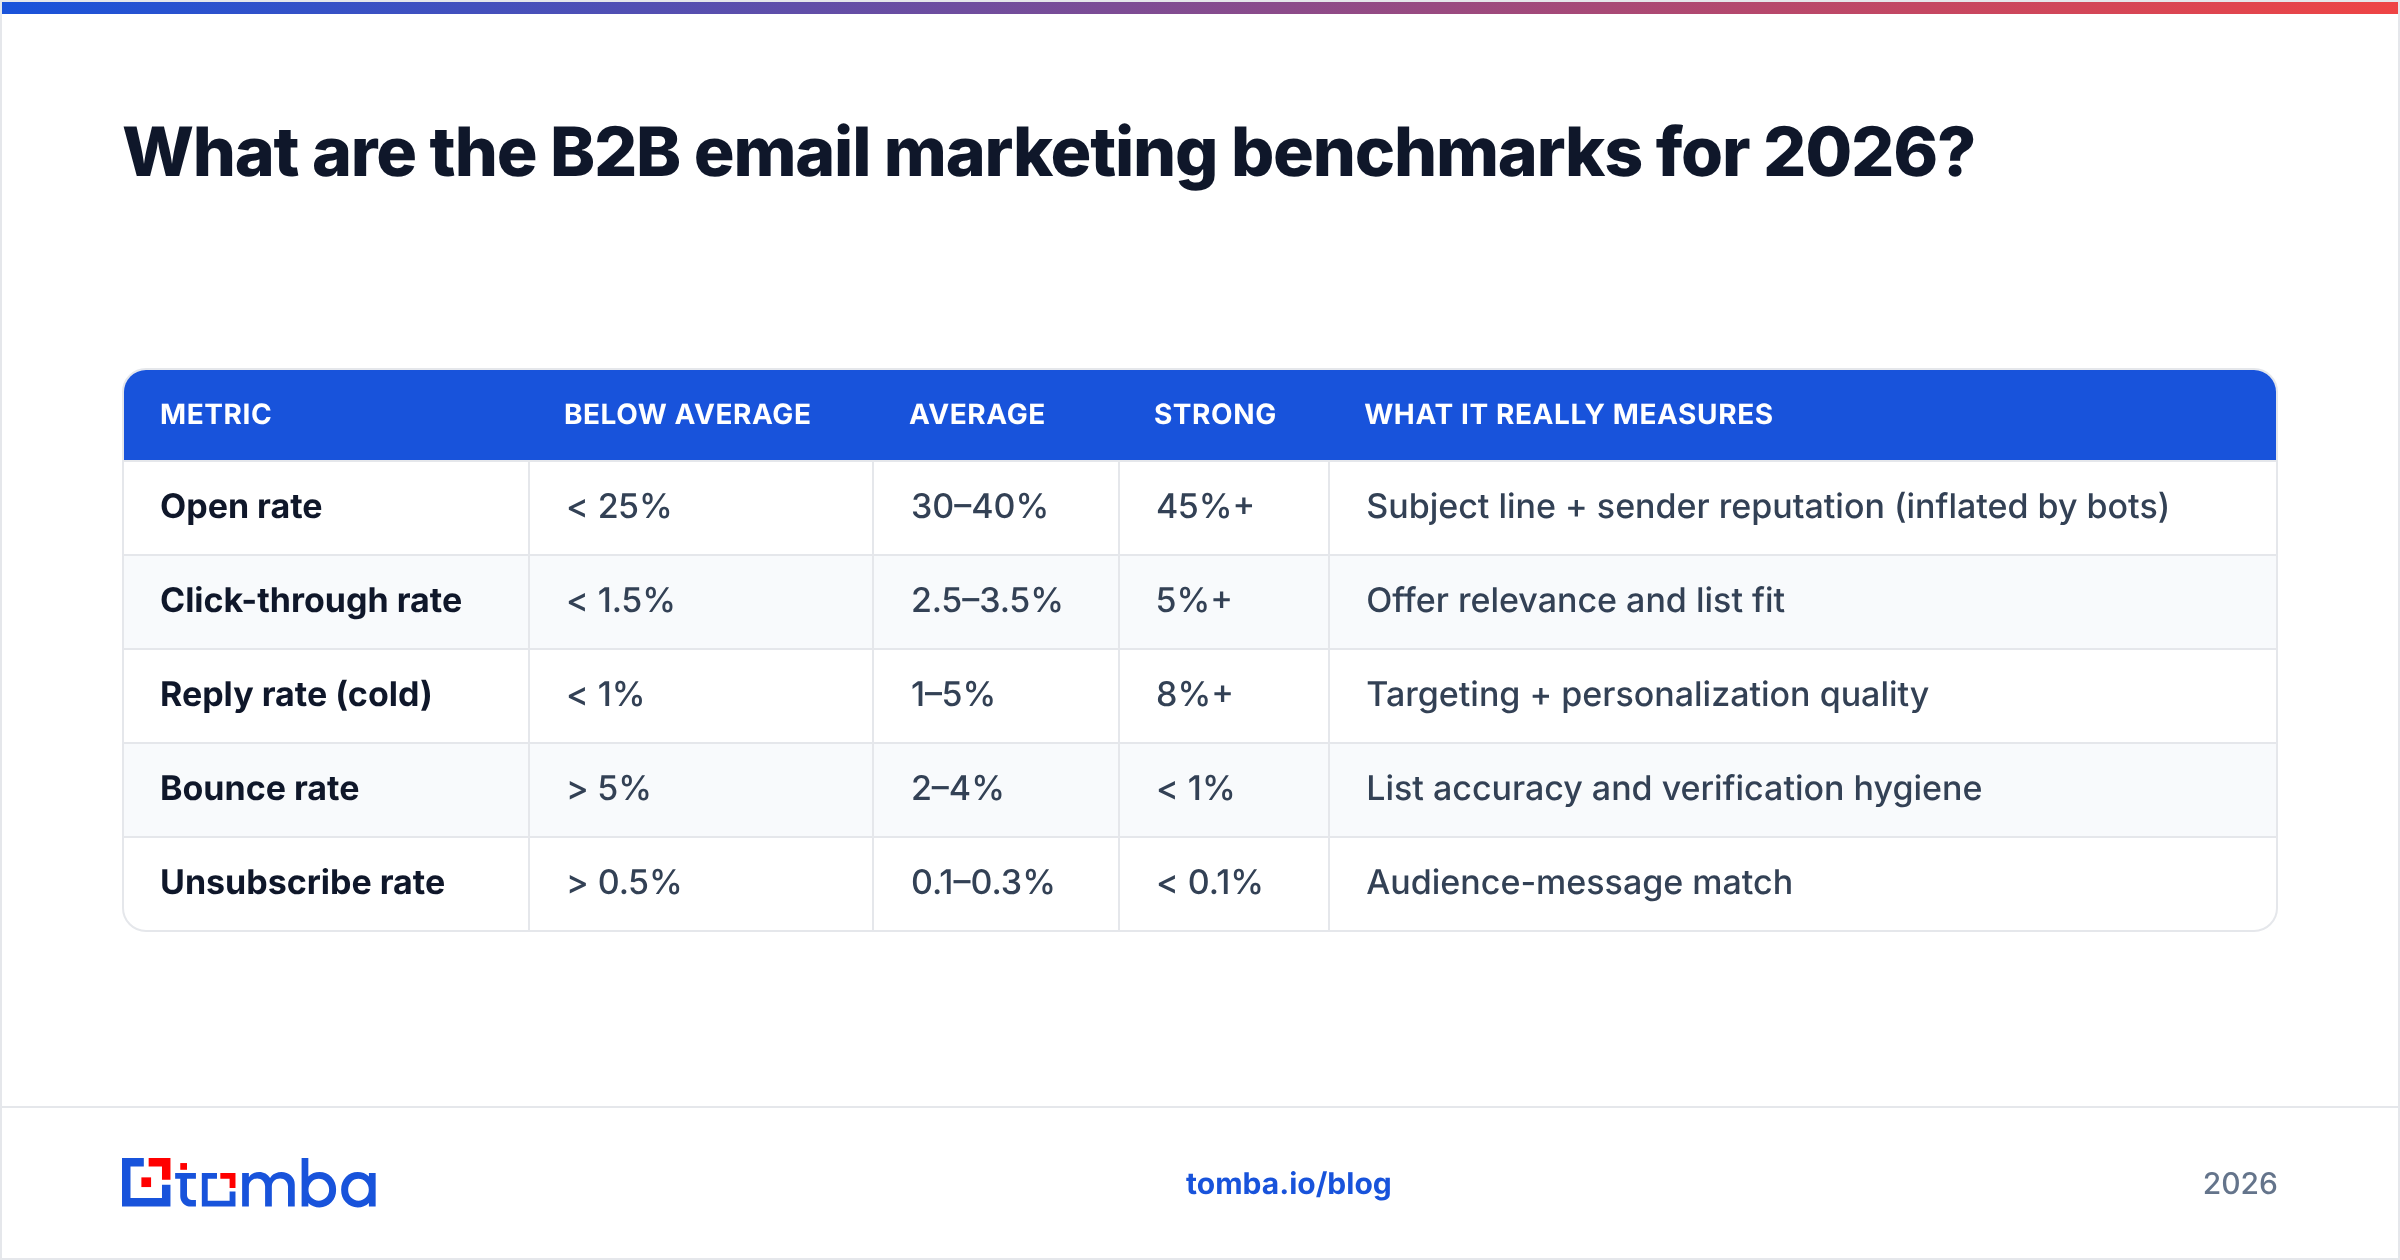
Here are realistic 2026 ranges for B2B programs, blended across industries:
| Metric | Below average | Average | Strong | What it really measures |
|---|---|---|---|---|
| Open rate | < 25% | 30–40% | 45%+ | Subject line + sender reputation (inflated by bots) |
| Click-through rate | < 1.5% | 2.5–3.5% | 5%+ | Offer relevance and list fit |
| Reply rate (cold) | < 1% | 1–5% | 8%+ | Targeting + personalization quality |
| Bounce rate | > 5% | 2–4% | < 1% | List accuracy and verification hygiene |
| Unsubscribe rate | > 0.5% | 0.1–0.3% | < 0.1% | Audience-message match |
Notice the pattern: every "strong" column depends on something upstream of the campaign itself. You cannot subject-line your way out of a 6% bounce rate. Mailbox providers read high bounces as a spam signal, throttle your email deliverability, and quietly route your "winning" subject line to the promotions tab. That's why the most leveraged move in email isn't copy — it's cleaning the list before you press send.
According to HubSpot's research on email engagement, segmented and verified lists consistently outperform blast sends on every downstream metric, often by double digits. The takeaway holds across vendors: data quality is the multiplier.
How do B2B funnel conversion benchmarks break down?#
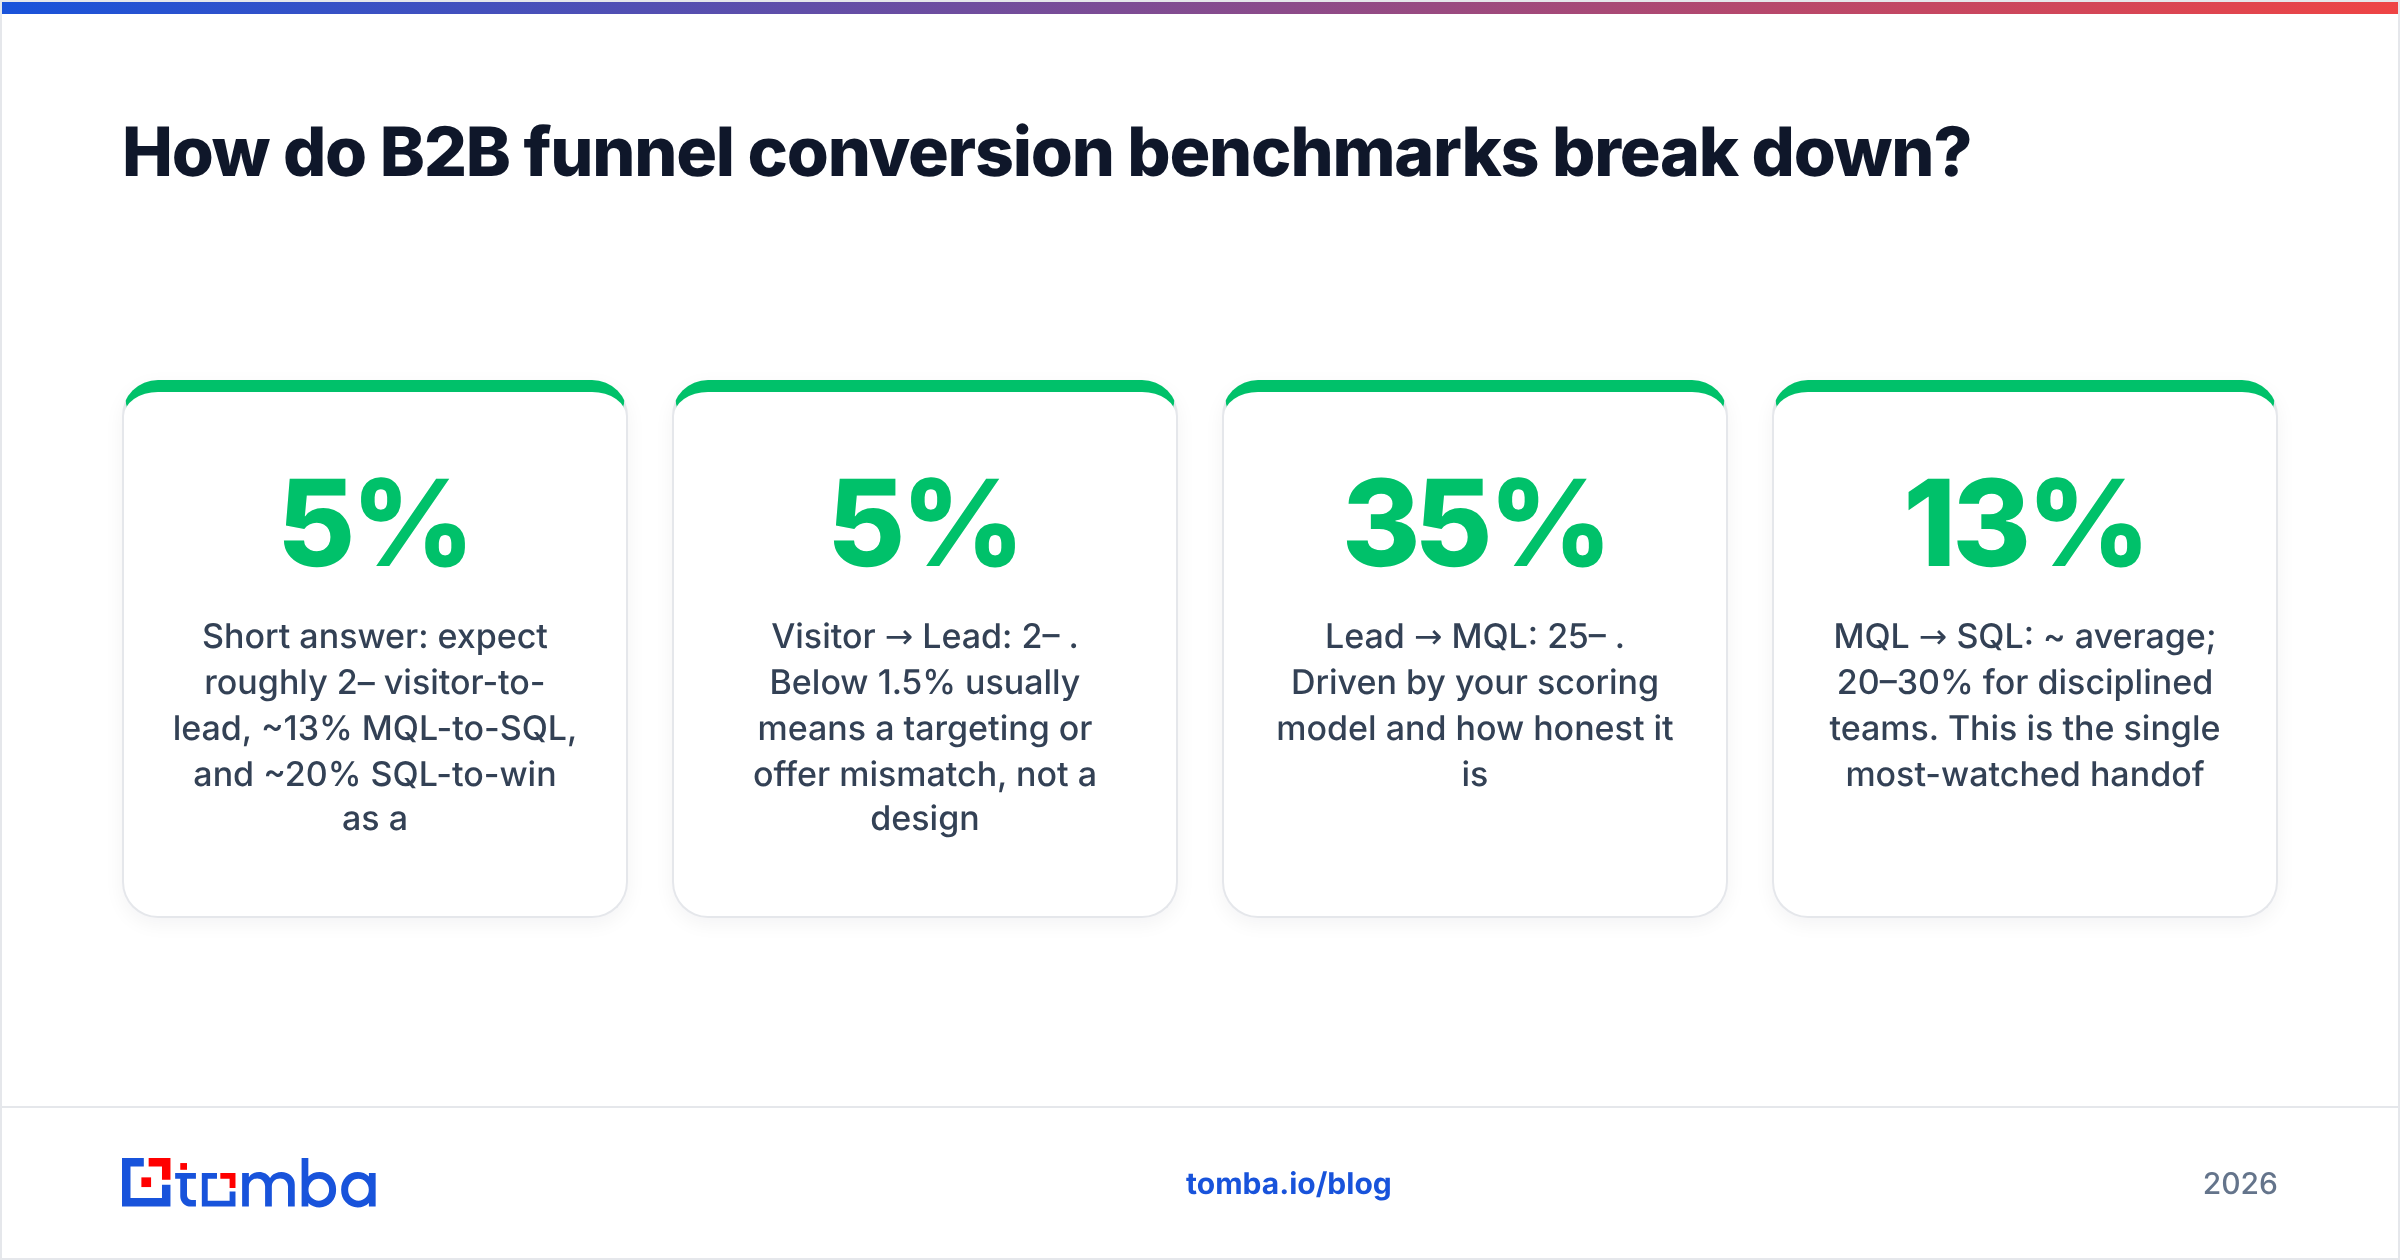
Short answer: expect roughly 2–5% visitor-to-lead, ~13% MQL-to-SQL, and ~20% SQL-to-win as a baseline — then beat the middle of the funnel, not the top.
Most teams pour budget into the top of the funnel because traffic is visible and satisfying. But the expensive leaks are in the middle, where a sloppy lead definition sends sales 100 "MQLs" that were never going to buy.
A representative B2B funnel looks like this:
- Visitor → Lead: 2–5%. Below 1.5% usually means a targeting or offer mismatch, not a design problem.
- Lead → MQL: 25–35%. Driven by your scoring model and how honest it is.
- MQL → SQL: ~13% average; 20–30% for disciplined teams. This is the single most-watched handoff in B2B.
- SQL → Closed-won: 15–25%, heavily dependent on deal size and sales motion.
The lever here is definition discipline, not volume. If marketing and sales disagree on what an SQL is, your MQL-to-SQL benchmark is fiction. Tighten the response rate and qualification criteria, enrich each record so reps see firmographics and verified contact details before they call, and the same lead volume converts better. Gartner's research on B2B buying repeatedly shows that buyers are further along before they ever talk to sales — so the quality of who you let into the funnel matters more than the quantity. (See Gartner's B2B buying insights.)
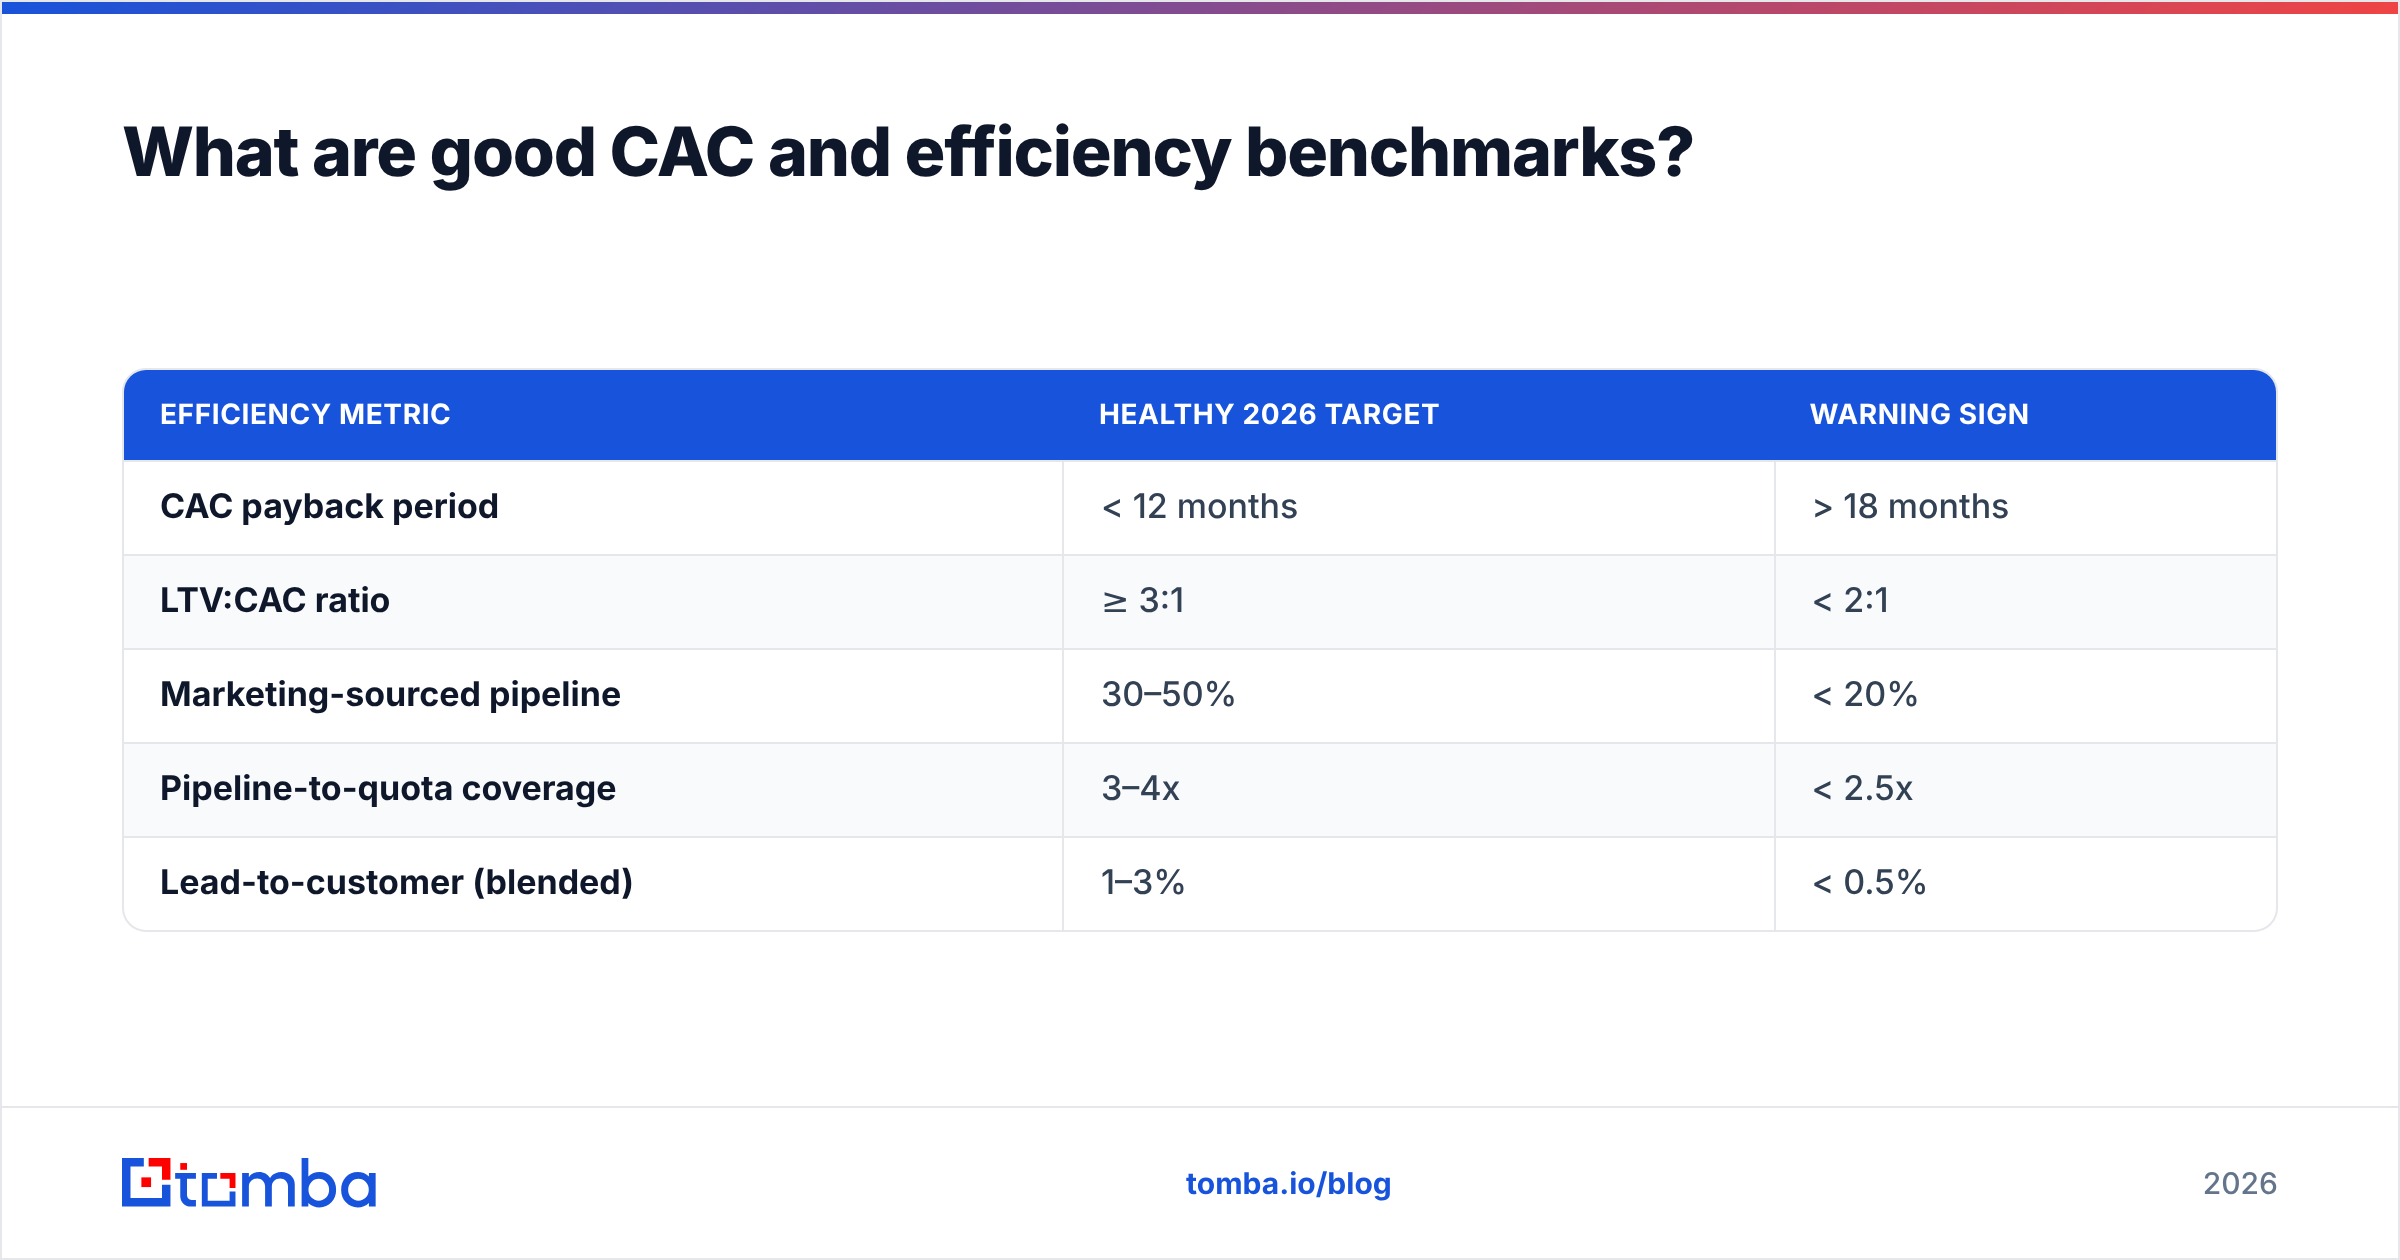
What are good CAC and efficiency benchmarks?#
Short answer: target CAC payback under 12 months and an LTV:CAC ratio of at least 3:1. These two numbers tell you whether your marketing is an investment or a treadmill.
| Efficiency metric | Healthy 2026 target | Warning sign |
|---|---|---|
| CAC payback period | < 12 months | > 18 months |
| LTV:CAC ratio | ≥ 3:1 | < 2:1 |
| Marketing-sourced pipeline | 30–50% | < 20% |
| Pipeline-to-quota coverage | 3–4x | < 2.5x |
| Lead-to-customer (blended) | 1–3% | < 0.5% |
When CAC creeps up, the instinct is to cut ad spend or swap channels. But rising CAC is often a data problem in disguise: reps waste cycles on bounced emails, wrong-number dials, and contacts who left the company two roles ago. Every wasted touch inflates the cost of every won deal. Improving contact accuracy and data enrichment coverage attacks CAC at the root by raising the conversion rate of the leads you already paid to acquire — and that compounds through the entire efficiency table above.
)
Why do most teams miss these benchmarks?#
Short answer: bad data quietly taxes every metric at once. It's the closest thing B2B marketing has to a hidden tax — you never see the line item, but it shows up everywhere.
Here's how a single root cause cascades:
- Invalid emails raise bounce rate, which lowers sender reputation, which lowers inbox placement, which lowers open and click rates — making your campaigns look weak when the copy was fine.
- Stale firmographics send reps after the wrong personas, dragging MQL-to-SQL down and making your scoring model look broken.
- Missing contact data forces manual research, slowing pipeline velocity and inflating CAC because rep time isn't free.
- Duplicate records distort your reporting, so the benchmarks you're measuring against your own history are themselves unreliable.
Industry reviews on G2 consistently rank data accuracy as the top differentiator buyers cite when choosing lead-intelligence tools — ahead of price and integrations. That's not a coincidence. Accuracy is the input that every benchmark depends on.
The fix is unglamorous and effective: verify before you send, enrich before you score, and re-validate on a cadence. A contact database decays roughly 22–30% per year as people change jobs, so a list that was clean in January is measurably worse by summer. Treat hygiene as a recurring process, not a one-time cleanup.
How do you benchmark the right way without fooling yourself?#
Benchmarks go wrong when you compare across contexts that don't match. A median is an average of wildly different funnels, and using it carelessly produces false confidence or false panic.
Use this checklist before you judge any number:
- Segment first. Compare yourself to your industry, ACV band, and motion (PLG vs. sales-led). A $40k-ACV enterprise deal and a $40/month self-serve plan share almost no benchmark.
- Pick leading indicators. Opens and impressions are lagging vanity metrics. Reply rate, meeting-booked rate, and SQL conversion predict revenue earlier.
- Measure your own trend. The most useful benchmark is your last quarter. Improvement against yourself beats matching a stranger's median.
- Audit data quality monthly. Track bounce rate and list accuracy as first-class KPIs, not afterthoughts. They explain more variance than any creative test.
- Tie every metric to pipeline. If a benchmark doesn't ladder up to sourced or influenced revenue, deprioritize it.
This is also where tooling earns its keep. Pulling verified contacts straight from a domain search and validating them before a campaign turns "we think our list is clean" into a measured number you can actually benchmark. You can review what each tier covers on the Tomba pricing page, but the principle is tool-agnostic: instrument your data quality with the same rigor you give your conversion rates.
Which benchmarks should you act on first?#
If you only fix three things in 2026, fix these — in order:
- Bounce rate. It's the cheapest to fix and it lifts every email metric downstream. Verify your list and keep bounces under 2%.
- MQL-to-SQL conversion. Tighten the definition, enrich the records, and align sales and marketing on a shared bar. This is where most pipeline is lost.
- CAC payback. Once data quality and qualification improve, CAC follows. Watch the payback period quarter over quarter.
Everything else — open rates, impressions, follower counts — is downstream noise compared to these three. Start at the foundation and the rest of the table moves with it.
The bottom line#
Benchmarks are a compass, not a scoreboard. The 2026 ranges above tell you roughly where the herd is, but your real competitive edge isn't matching a median — it's removing the hidden data tax that drags everyone else below their potential. Clean contacts lift deliverability, conversion, and CAC simultaneously, which is why data quality is the highest-leverage benchmark you can improve.
If your funnel math isn't adding up, start where the leak begins: the contact data feeding it. Use the Tomba Email Finder to source verified, accurate professional emails by name, company, or domain — so your campaigns measure against benchmarks from a list that's actually deliverable, not one quietly bleeding into the bounce pile. Better inputs, better numbers, fewer surprises at the end of the quarter.
Ready to find emails that actually work?
Join 150,000+ professionals who stopped guessing and started sending. Free credits on signup — no credit card required.
Get the Tomba newsletter
Practical outbound tactics and product updates — once every two weeks.
About the author