B2B Marketing KPIs in 2026: The 12 Metrics That Matter
Most B2B teams track 40 metrics and act on none. Here are the 12 B2B marketing KPIs that actually predict pipeline and revenue in 2026 — plus how to set targets.
B2B Marketing KPIs in 2026: The 12 Metrics That Matter
You can drown in dashboards and still have no idea whether marketing is working. Most B2B teams track dozens of numbers, report on all of them, and steer with none. This guide cuts the list down to the B2B marketing KPIs that actually connect to pipeline and revenue — with formulas, 2026 benchmarks, and the vanity metrics worth deleting from your reports.
TL;DR#
- Pick fewer KPIs. A focused set of 8–12 revenue-linked metrics beats a 40-row dashboard nobody reads.
- Tie every KPI to a stage: demand creation, lead quality, pipeline contribution, and efficiency (CAC, ROI).
- Vanity metrics (impressions, raw page views, follower counts) belong in diagnostics, not in board decks.
- Data quality is a KPI multiplier — bad contact data inflates volume metrics and destroys conversion rates.
- Set targets from your own trailing 12 months first, then sanity-check against industry benchmarks.
What are B2B marketing KPIs?#
B2B marketing KPIs are the quant, decision-driving metrics that show whether marketing is generating qualified demand and contributing to revenue. Think of them like the gauges on a car dashboard: you don't need to monitor every electrical signal in the engine, you need the few dials that tell you speed, fuel, and whether something is about to break.
The trap is confusing metrics with KPIs. You can measure hundreds of metrics. A KPI is a metric you've promised to act on. If a number moves and nobody changes a budget, a campaign, or a target because of it, it's a diagnostic — not a KPI.
A healthy B2B KPI framework spans four layers:
- Demand & reach — are you creating awareness in the right accounts?
- Lead quality & conversion — are those leads turning into qualified opportunities?
- Pipeline & revenue contribution — is marketing sourcing and influencing real deals?
- Efficiency — what does all of it cost relative to what it returns?

Which B2B marketing KPIs actually matter in 2026?#
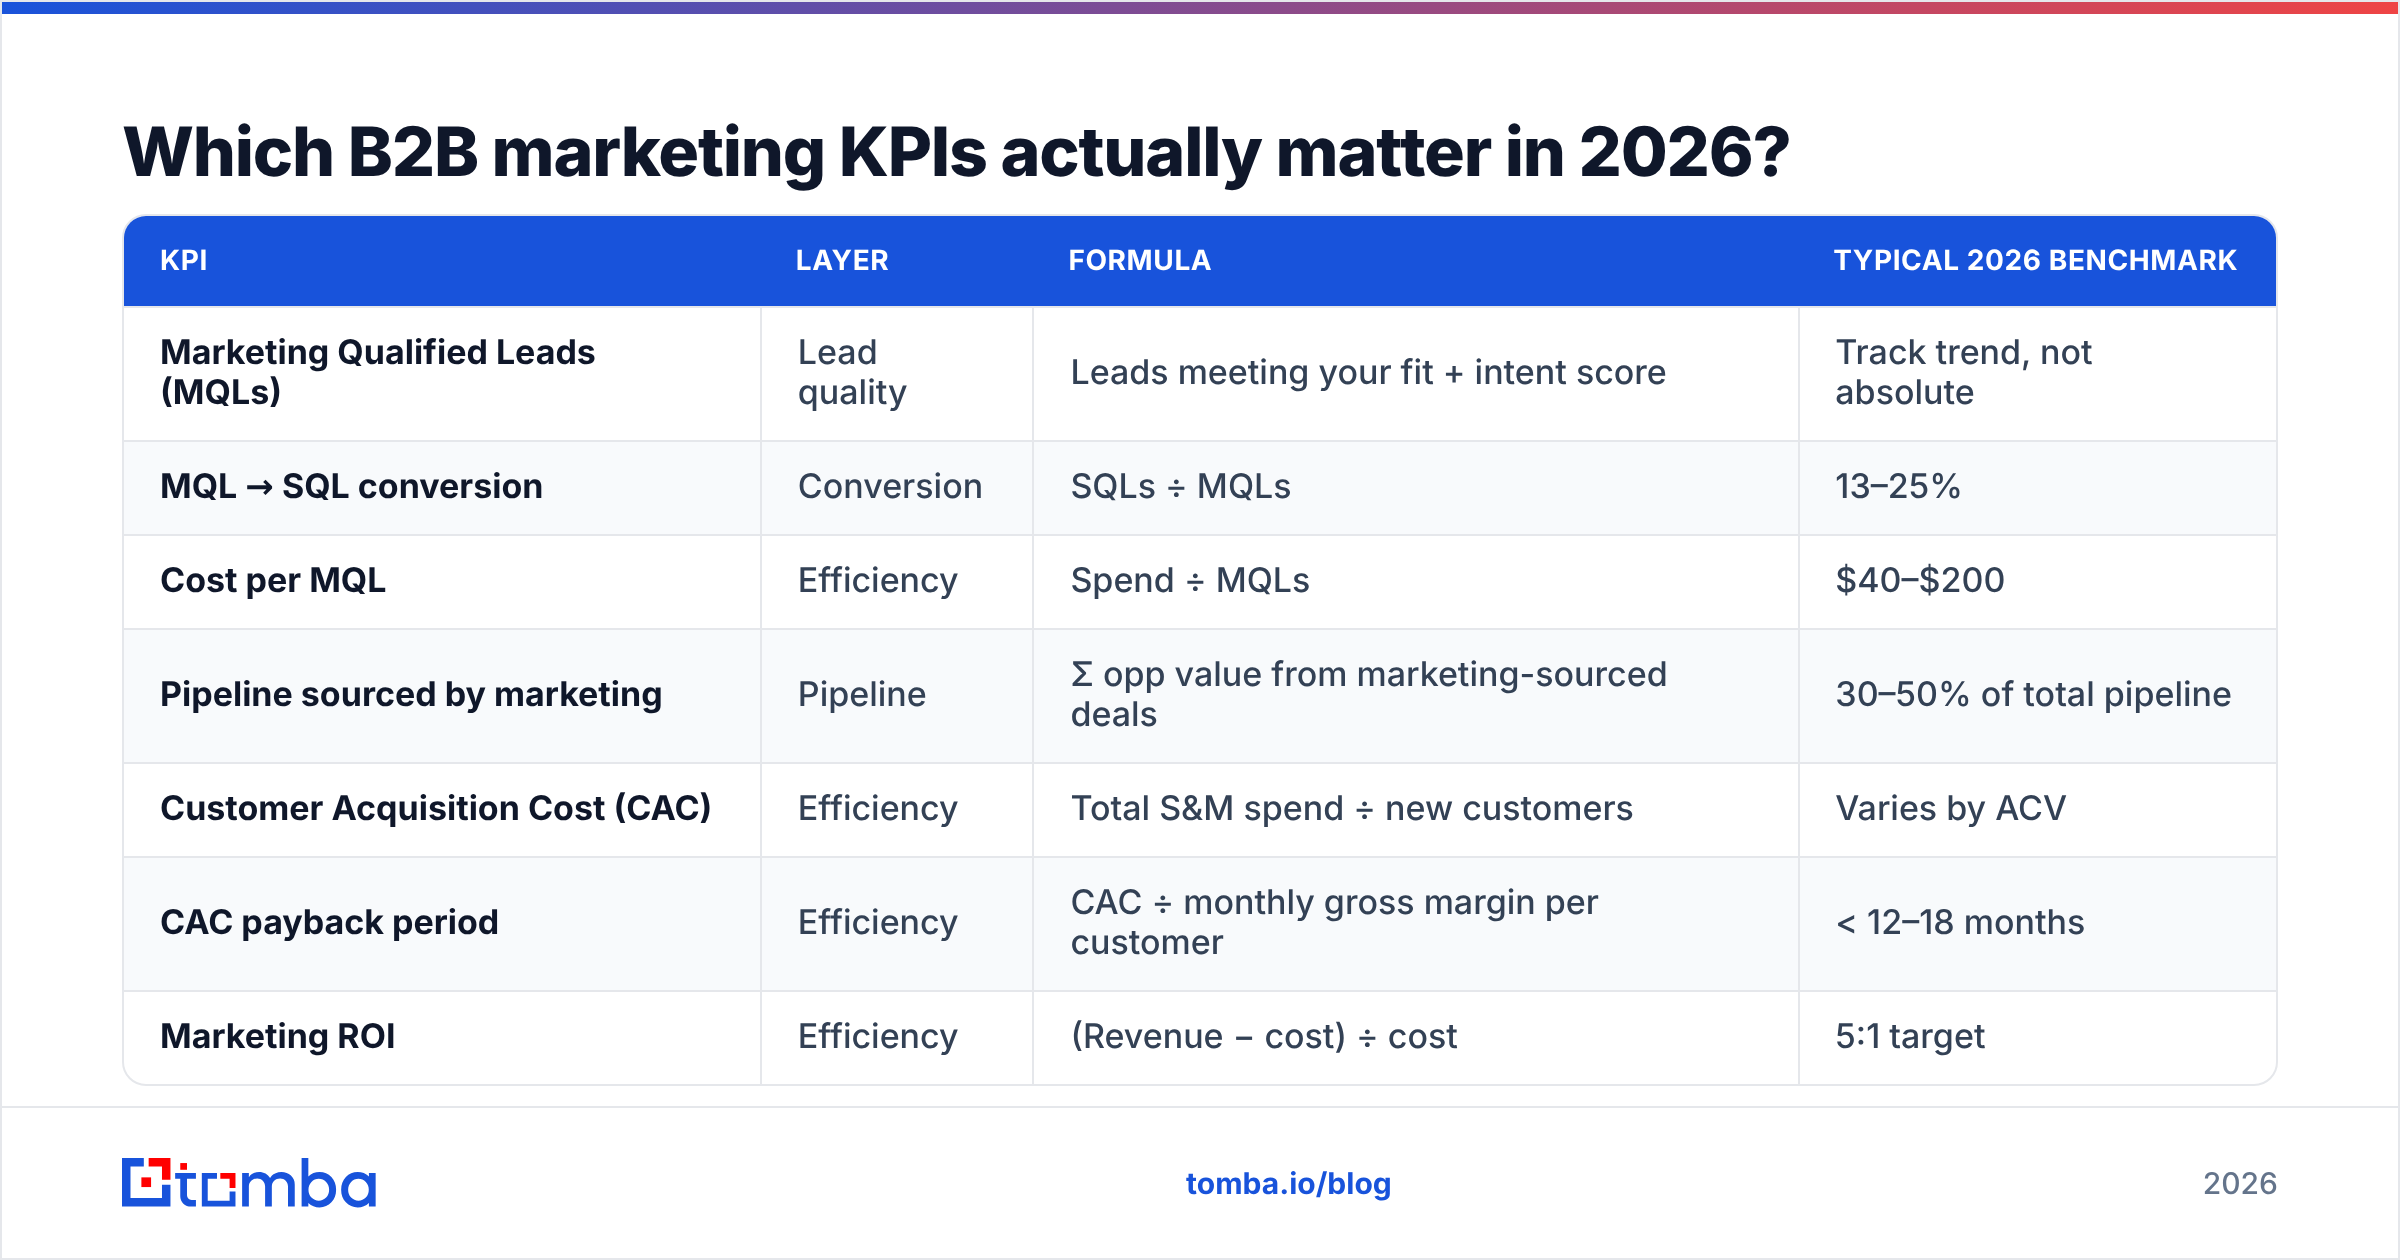
Here's the short list, grouped by the four layers, with how each is calculated and what "good" tends to look like for mid-market B2B in 2026. Treat the benchmarks as directional — your own history is the better baseline.
| KPI | Layer | Formula | Typical 2026 benchmark |
|---|---|---|---|
| Marketing Qualified Leads (MQLs) | Lead quality | Leads meeting your fit + intent score | Track trend, not absolute |
| MQL → SQL conversion | Conversion | SQLs ÷ MQLs | 13–25% |
| Cost per MQL | Efficiency | Spend ÷ MQLs | $40–$200 |
| Pipeline sourced by marketing | Pipeline | Σ opp value from marketing-sourced deals | 30–50% of total pipeline |
| Customer Acquisition Cost (CAC) | Efficiency | Total S&M spend ÷ new customers | Varies by ACV |
| CAC payback period | Efficiency | CAC ÷ monthly gross margin per customer | < 12–18 months |
| Marketing ROI | Efficiency | (Revenue − cost) ÷ cost | 5:1 target |
| Win rate (marketing-sourced) | Pipeline | Won ÷ total marketing opps | 15–30% |
| Average deal size | Revenue | Revenue ÷ deals won | Trend up |
| Sales cycle length | Velocity | Avg days create → close | Trend down |
| Email reply rate | Conversion | Replies ÷ delivered | 5–15% outbound |
| Customer Lifetime Value (LTV) | Revenue | Avg revenue × margin × lifespan | LTV:CAC ≥ 3:1 |
Two ratios deserve special attention because they summarize the whole engine: LTV:CAC (are customers worth more than they cost to acquire?) and CAC payback (how fast do you get that money back?). Gartner and most RevOps teams treat an LTV:CAC of 3:1 or better as the sign of a sustainable model.
What are the most important lead-generation KPIs?#
If you only optimize one layer, optimize conversion — because volume is cheap to fake and quality is what compounds.
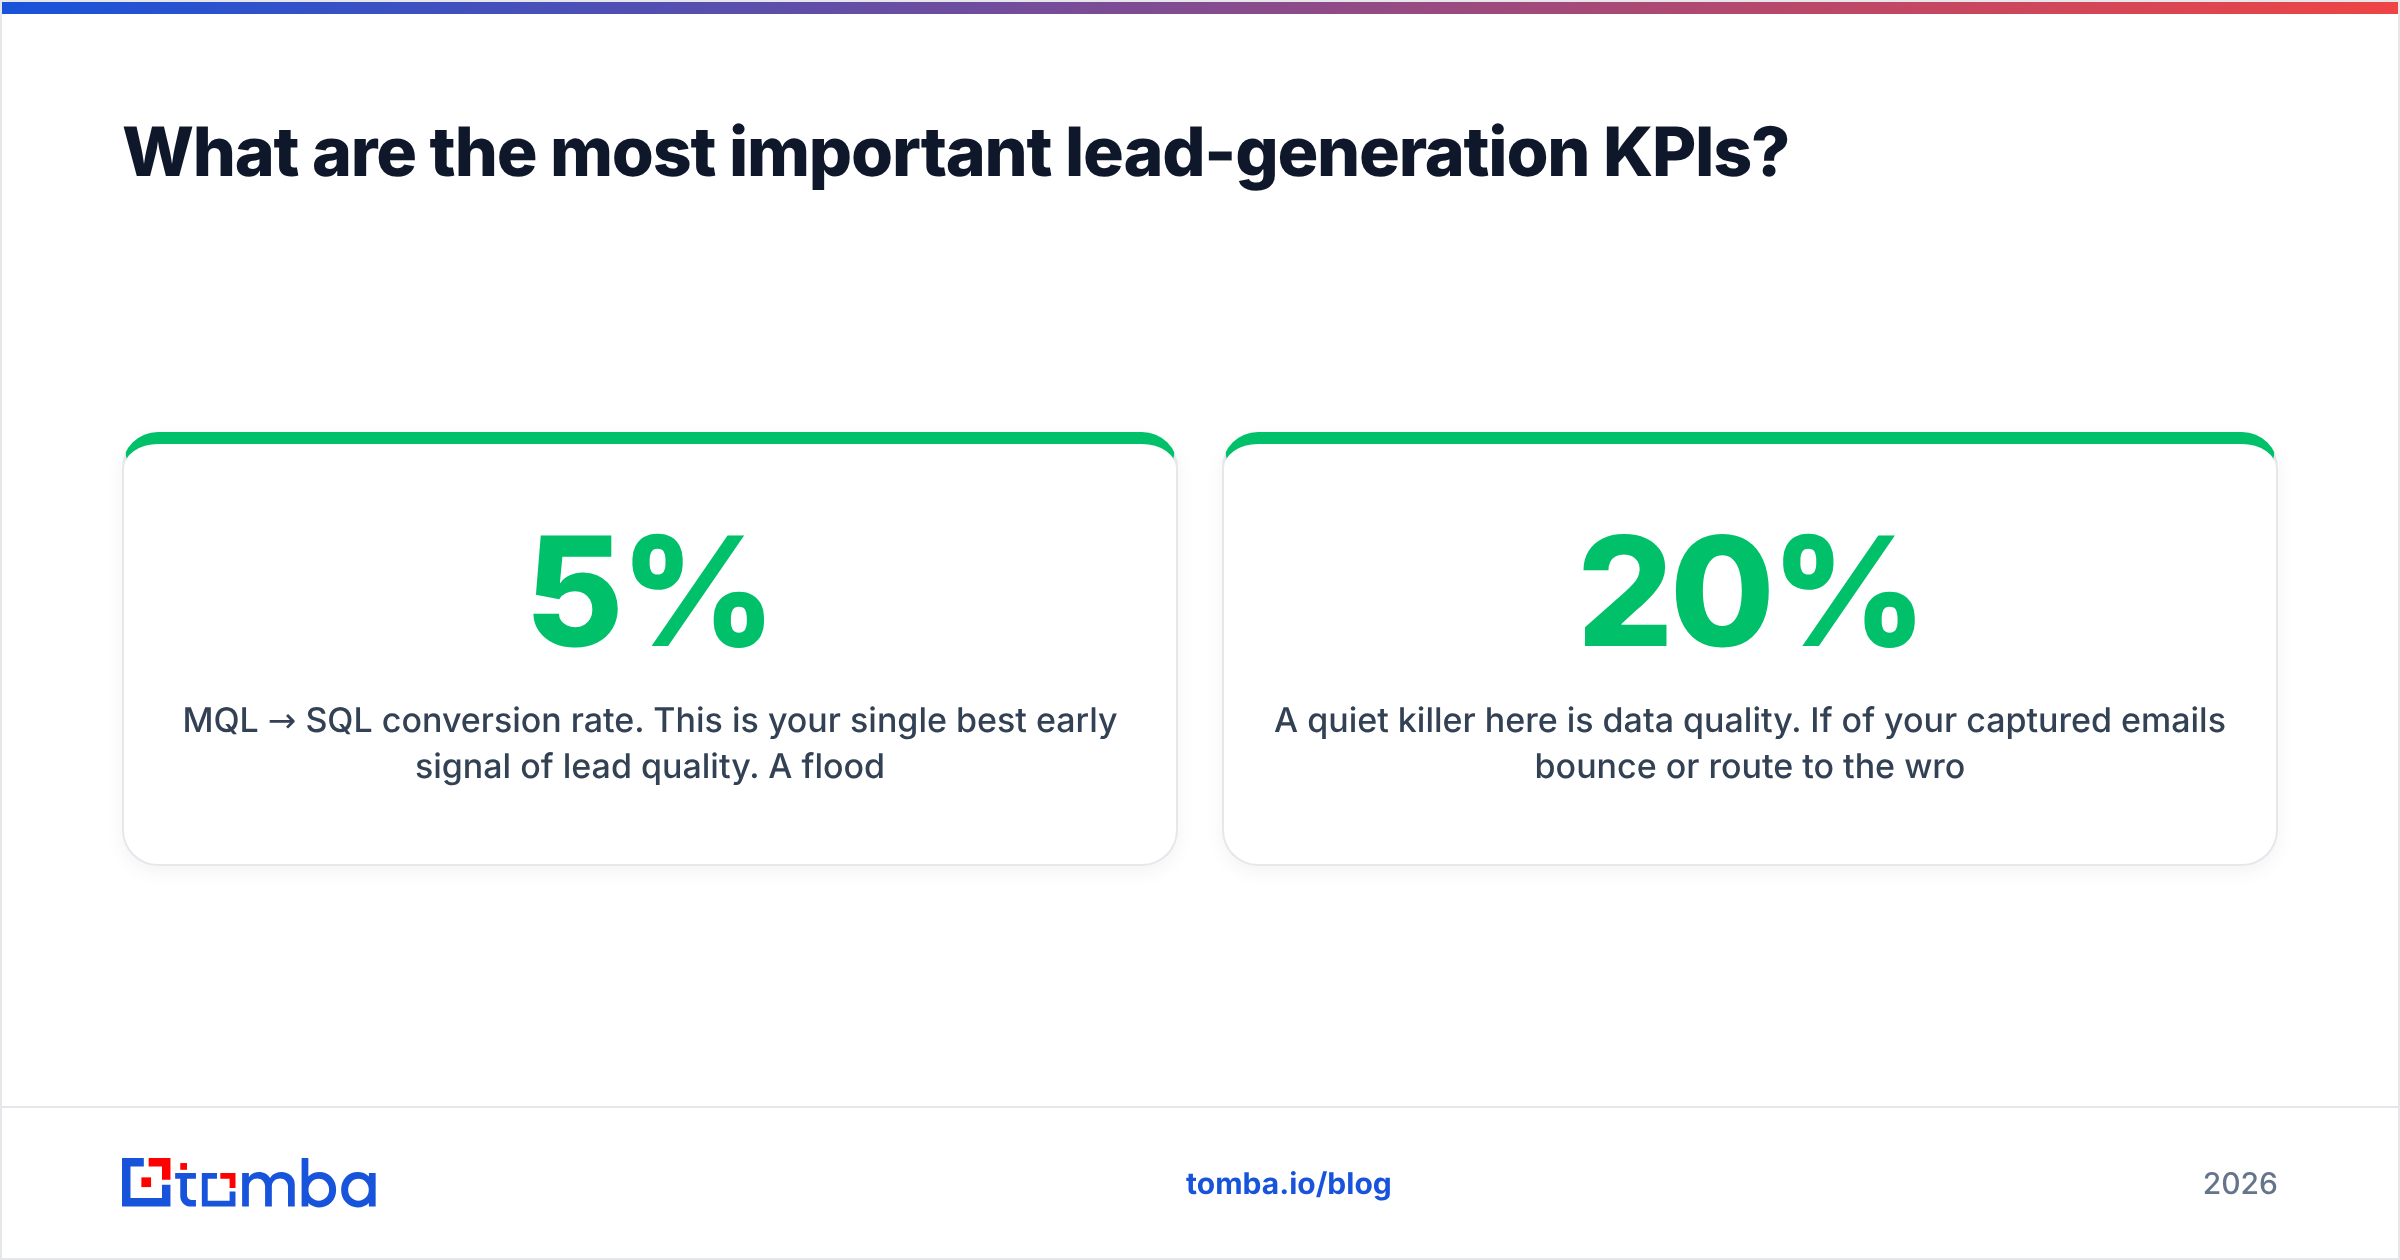
- MQL → SQL conversion rate. This is your single best early signal of lead quality. A flood of MQLs with a 5% SQL rate is worse than half the volume at 22%. When this drops, your targeting or scoring drifted.
- SQL → opportunity rate. Measures whether sales agrees with marketing's definition of "qualified." Persistent low numbers mean misaligned marketing qualified lead criteria.
- Speed-to-lead. Time from form fill to first sales touch. Conversion drops sharply after the first hour — this is a process KPI you can fix this week.
- Cost per opportunity (not per lead). Per-lead cost hides the truth; per-opportunity cost reflects quality and is far harder to game.
A quiet killer here is data quality. If 20% of your captured emails bounce or route to the wrong person, your conversion rates look broken when the real problem is your list. Running new contacts through an email verifier before they hit the CRM keeps your funnel math honest and protects sender reputation.
How do you measure marketing's contribution to revenue?#
Use attribution, but commit to a model and report it consistently rather than chasing the "perfect" one.
- Marketing-sourced pipeline: opportunities where marketing created the first qualifying touch. This is the cleanest case for marketing's value.
- Marketing-influenced pipeline: any deal marketing touched along the way. Bigger number, softer claim — useful for showing assist value, easy to inflate.
- First-touch vs. multi-touch: first-touch over-credits demand gen; multi-touch (or a revenue operations model) spreads credit across the journey. Pick one as your official model and footnote the other.
The honest version of this conversation acknowledges that no attribution model is "true." HubSpot's own research on attribution makes the point that models are lenses, not facts — so the discipline is consistency, not precision. What matters is that you can answer "what would pipeline look like without this program?" with a defensible number.

Which B2B marketing metrics are vanity metrics?#
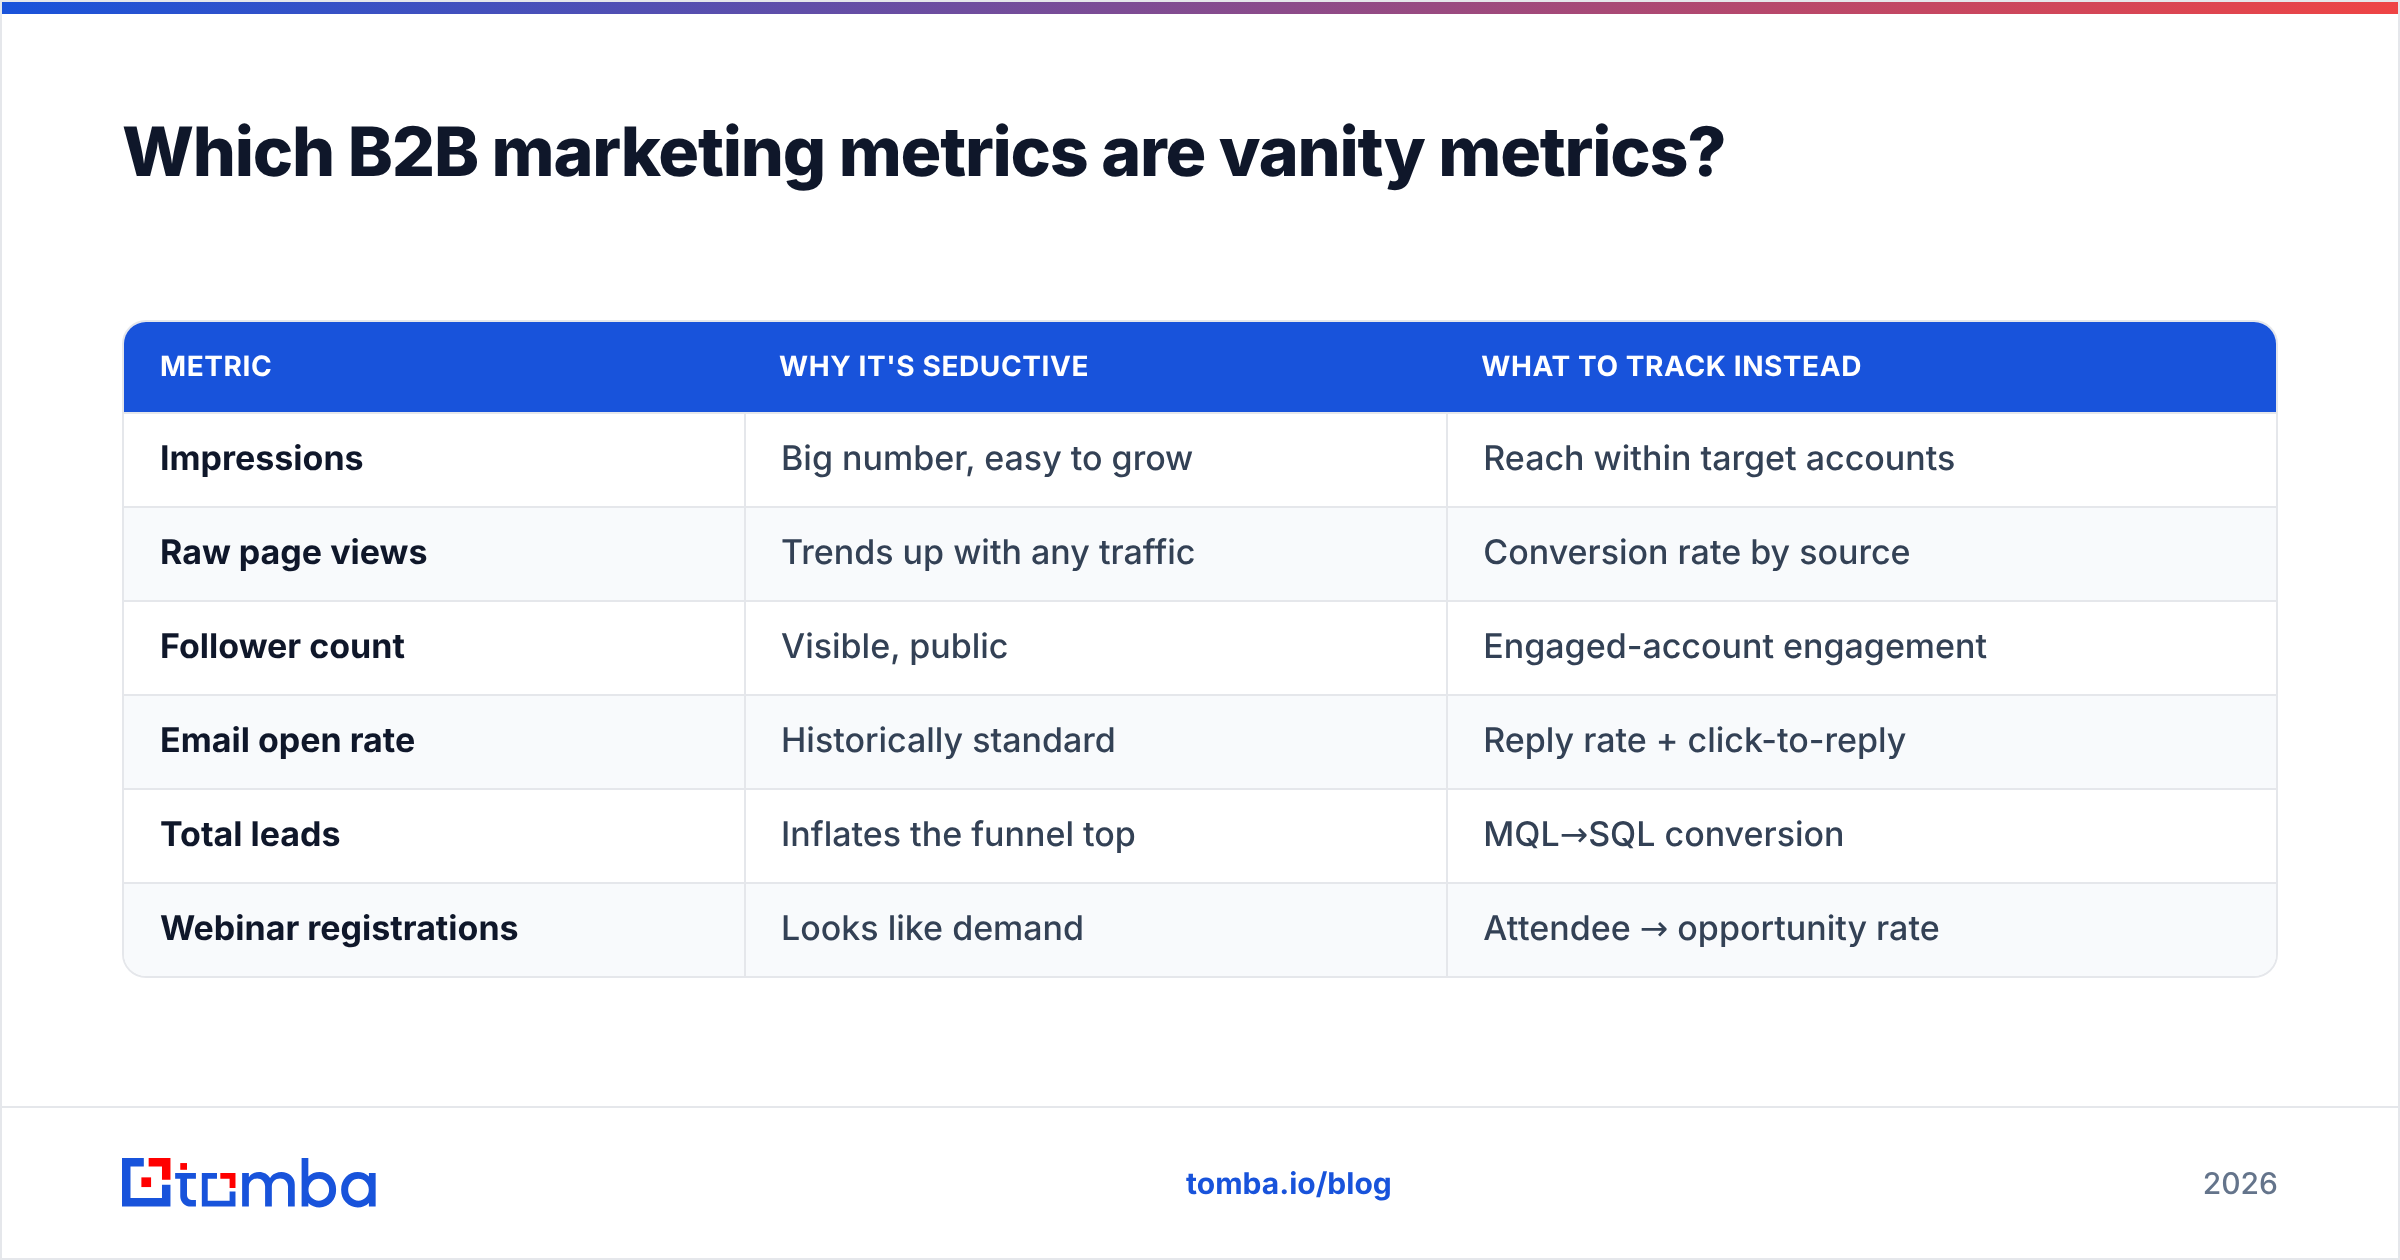
A vanity metric makes you feel good and tells you nothing actionable. They're not useless — they're just diagnostics misfiled as KPIs.
| Metric | Why it's seductive | What to track instead |
|---|---|---|
| Impressions | Big number, easy to grow | Reach within target accounts |
| Raw page views | Trends up with any traffic | Conversion rate by source |
| Follower count | Visible, public | Engaged-account engagement |
| Email open rate | Historically standard | Reply rate + click-to-reply |
| Total leads | Inflates the funnel top | MQL→SQL conversion |
| Webinar registrations | Looks like demand | Attendee → opportunity rate |
Note email open rate especially. With privacy changes and prefetching, opens are now unreliable — a strong email deliverability program is better judged by replies and downstream pipeline than by a number Apple Mail inflates automatically.
How many KPIs should a B2B marketing team track?#
Fewer than you currently do. The rule of thumb: one north-star metric, three to five primary KPIs, and a supporting layer of diagnostics you only open when a primary KPI moves.
A clean structure looks like this:
- North star — marketing-sourced revenue (or pipeline) for the quarter.
- Primary KPIs — CAC, MQL→SQL conversion, pipeline sourced %, marketing ROI.
- Operational KPIs — cost per opportunity, speed-to-lead, reply rate.
- Diagnostics — everything else (traffic, opens, impressions), inspected only to explain a primary movement.
If your weekly report has 30 rows, your team is reporting, not deciding. Cut it to the four that change behavior and move the rest to an appendix.
How do you set realistic KPI targets?#
Start with your own trailing 12 months, not a blog's benchmark table (including this one).
- Establish the baseline. Pull the last 12 months for each KPI. Your median is your honest starting point.
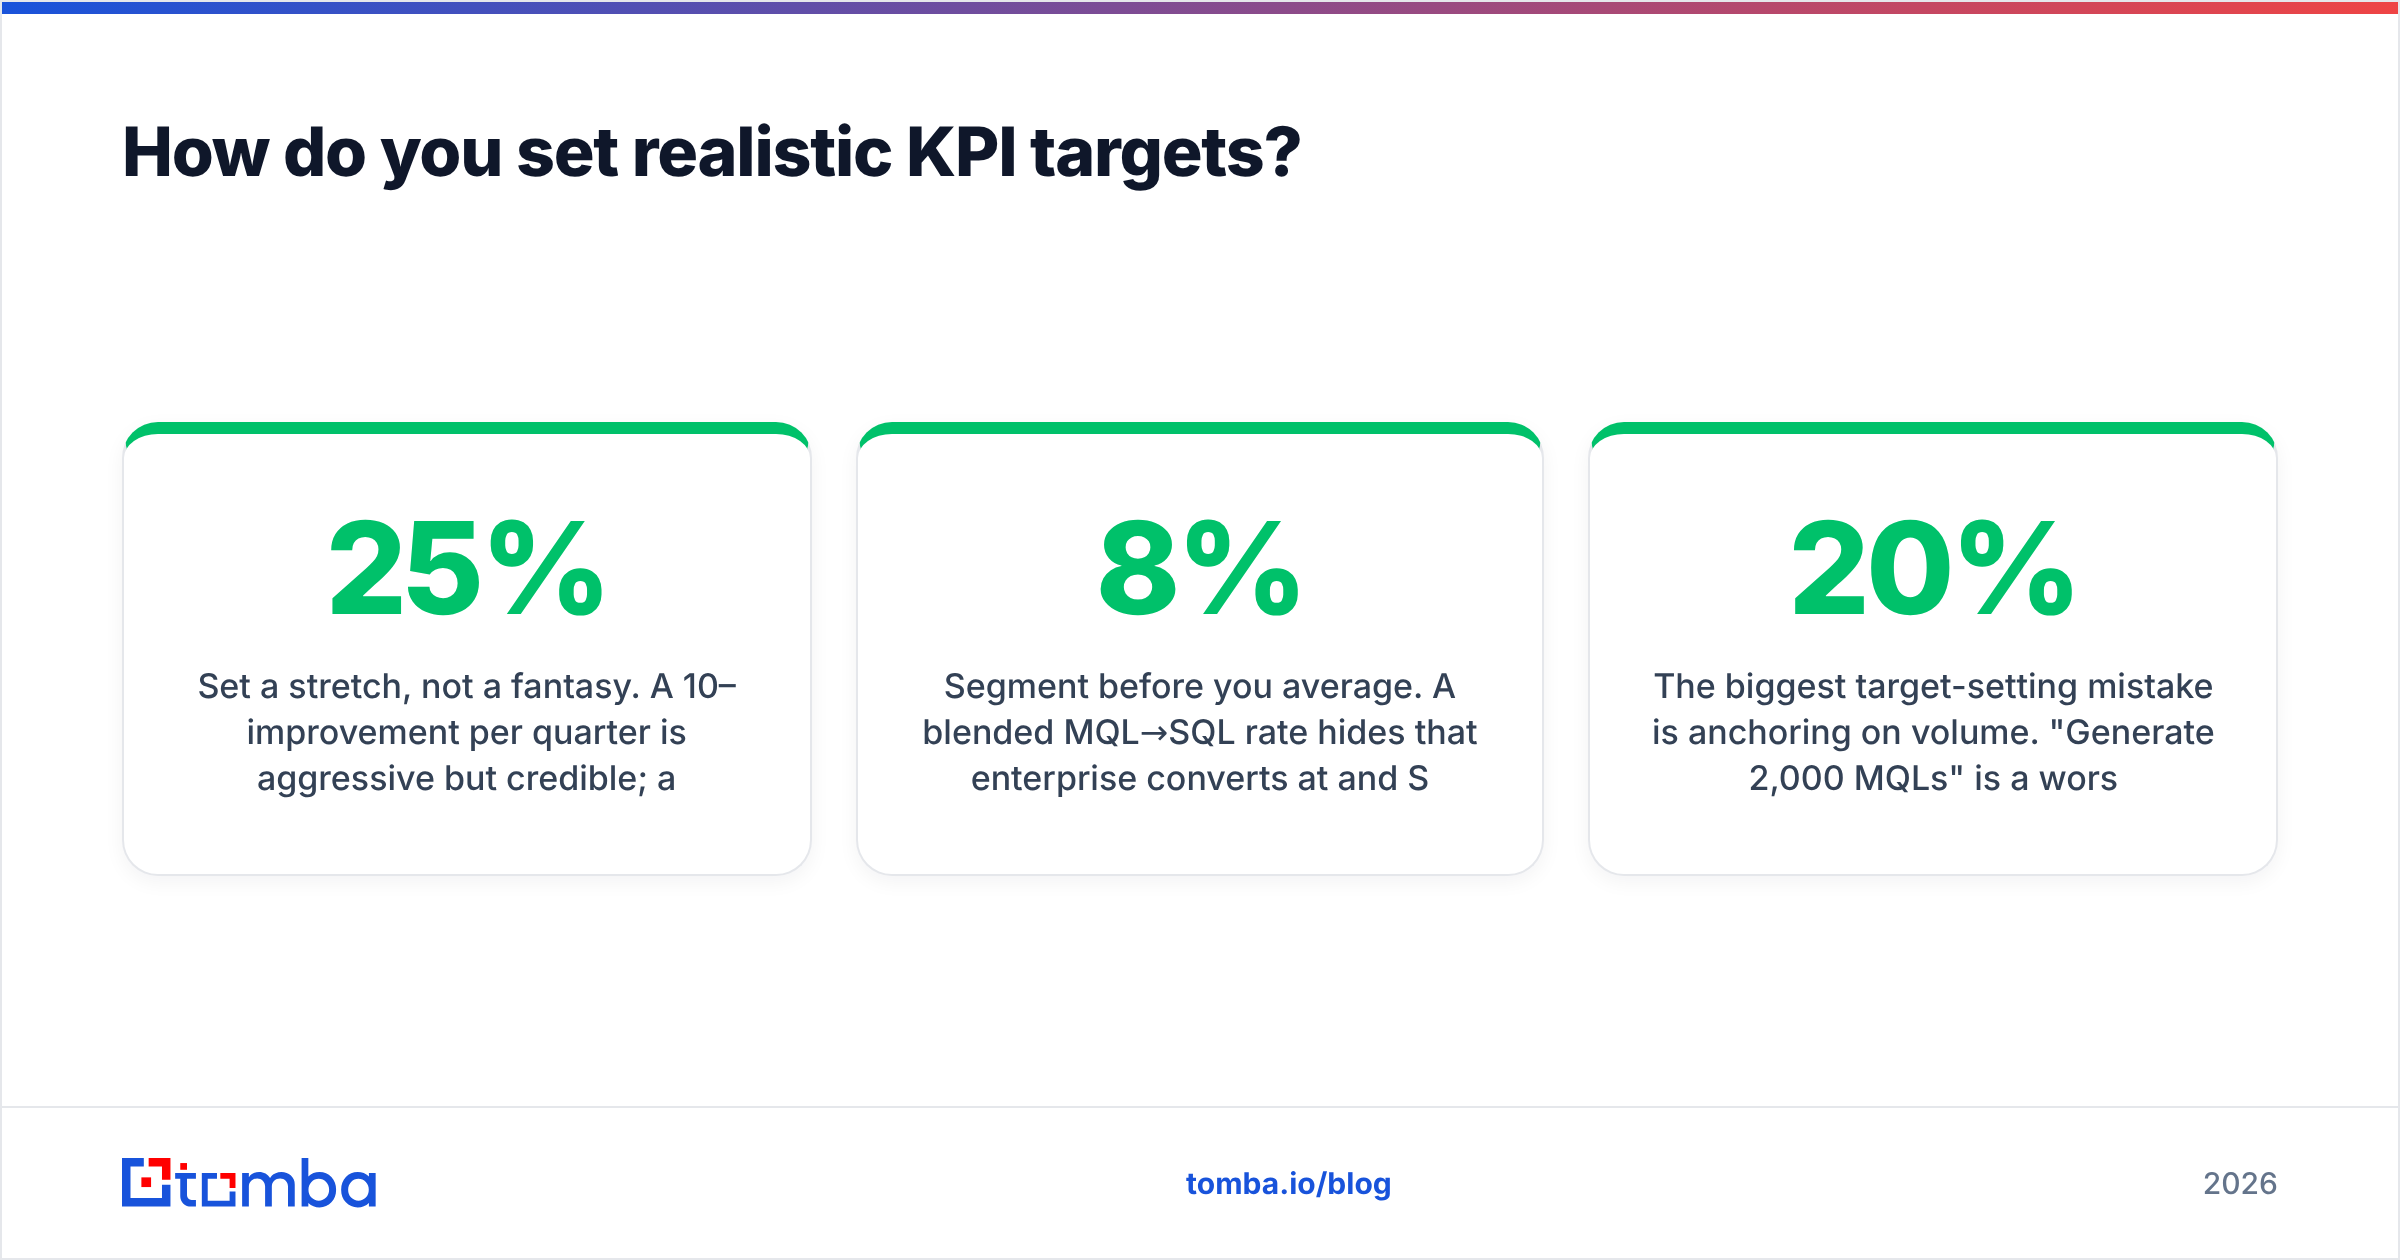
- Set a stretch, not a fantasy. A 10–25% improvement per quarter is aggressive but credible; a 3x target just teaches the team to ignore goals.
- Segment before you average. A blended MQL→SQL rate hides that enterprise converts at 8% and SMB at 30%. Set targets per segment.
- Pressure-test against external data. Cross-check with G2 category benchmarks or Salesforce's State of Marketing data — but only after you know your own numbers.
- Recalculate quarterly. Markets and channels shift; a target set in early 2025 may be wrong by mid-2026.
The biggest target-setting mistake is anchoring on volume. "Generate 2,000 MQLs" is a worse goal than "improve MQL→SQL to 20% at flat CAC," because the second forces quality and the first rewards spam.
How does data quality affect your KPIs?#
It silently multiplies — or wrecks — every other metric. Your conversion rates, CAC, and reply rates all assume the contact data underneath is correct. When it isn't, your KPIs lie in predictable directions:
- Inflated volume, deflated conversion: junk leads pad the top of the funnel and crater MQL→SQL.
- Wasted spend, inflated CAC: outreach to dead or wrong addresses burns budget and SDR hours.
- Deliverability damage: high bounce rates hurt domain reputation, which then suppresses good sends too.
This is why mature RevOps teams treat list hygiene as a first-class KPI input. Enriching records with accurate firmographics and verified contact details — through data enrichment and front-loaded verification — raises the ceiling on every downstream metric. You can compare plan tiers and credits on the Tomba pricing page if you want to size this for your volume; the Free tier (25 searches/month) is enough to test the workflow before committing.
Putting it together: a 2026 KPI scorecard#
A defensible monthly scorecard for a mid-market B2B team in 2026:
- Revenue layer: marketing-sourced revenue, LTV:CAC, average deal size.
- Pipeline layer: sourced pipeline %, win rate on marketing opps, sales cycle length.
- Conversion layer: MQL→SQL, SQL→opportunity, reply rate.
- Efficiency layer: CAC, CAC payback, cost per opportunity, marketing ROI.
Review it on a fixed cadence, annotate every meaningful swing with why, and resist the urge to add rows. A scorecard's value comes from what it forces you to ignore as much as what it tracks.
The bottom line#
The teams that win in 2026 aren't the ones with the most metrics — they're the ones who picked the right dozen, tied each to a decision, and kept the data underneath clean. Start by deleting your vanity metrics, anchor targets to your own history, and protect the data layer that every other number depends on.
Accurate contact data is where most KPI problems quietly begin. If your conversion rates and CAC are fighting bad emails, start at the source: use the Tomba Email Finder to find verified professional emails by name, domain, or company, and feed your funnel leads that actually convert — so the KPIs you report reflect real demand, not data noise.
Ready to find emails that actually work?
Join 150,000+ professionals who stopped guessing and started sending. Free credits on signup — no credit card required.
Get the Tomba newsletter
Practical outbound tactics and product updates — once every two weeks.
About the author