B2B SaaS Funnel Conversion Benchmarks: 2026 Data & Targets
What does a healthy B2B SaaS funnel actually convert at? Stage-by-stage 2026 benchmarks for visitor-to-lead, MQL-to-SQL, and close rate — plus how to fix the weak stage.
TL;DR
- A typical B2B SaaS funnel converts roughly 2–5% of visitors into leads, 13% of MQLs into SQLs, and 20–30% of SQLs into closed-won — but medians hide huge variance by motion and ACV.
- Benchmarks are diagnostic, not goals. Use them to find your weakest stage, then concentrate effort there instead of spreading it thin.
- Lead quality, not lead volume, is the biggest lever. Most "conversion" problems are really data and targeting problems upstream.
- Self-serve (PLG) and sales-led funnels have different shapes; comparing yourself to the wrong model will send you chasing the wrong fixes.
- Clean contact data lifts MQL-to-SQL and SQL-to-win more reliably than another A/B test on your hero headline.
What are B2B SaaS funnel conversion benchmarks?#
B2B SaaS funnel conversion benchmarks are the percentage of prospects that survive each stage of your funnel — from anonymous visitor to paying customer. They give you a reference line: if your peers convert MQLs to SQLs at 13% and you're at 4%, you have a qualification or data problem, not a closing problem.
Think of your funnel like a water pipe with several joints. The benchmark tells you the normal flow rate at each joint. When one joint leaks far worse than the industry norm, that's where you send the plumber — not the joint that's already performing fine. Most teams waste quarters "optimizing" a stage that was never the bottleneck.
Two things make SaaS benchmarks tricky. First, definitions drift: one company's MQL is another's raw form-fill. Second, motion matters enormously. A product-led free-trial funnel and an enterprise sales-led funnel can both be healthy while posting completely different numbers. Hold those caveats in mind as you read the tables below.
What is a good conversion rate at each funnel stage in 2026?#
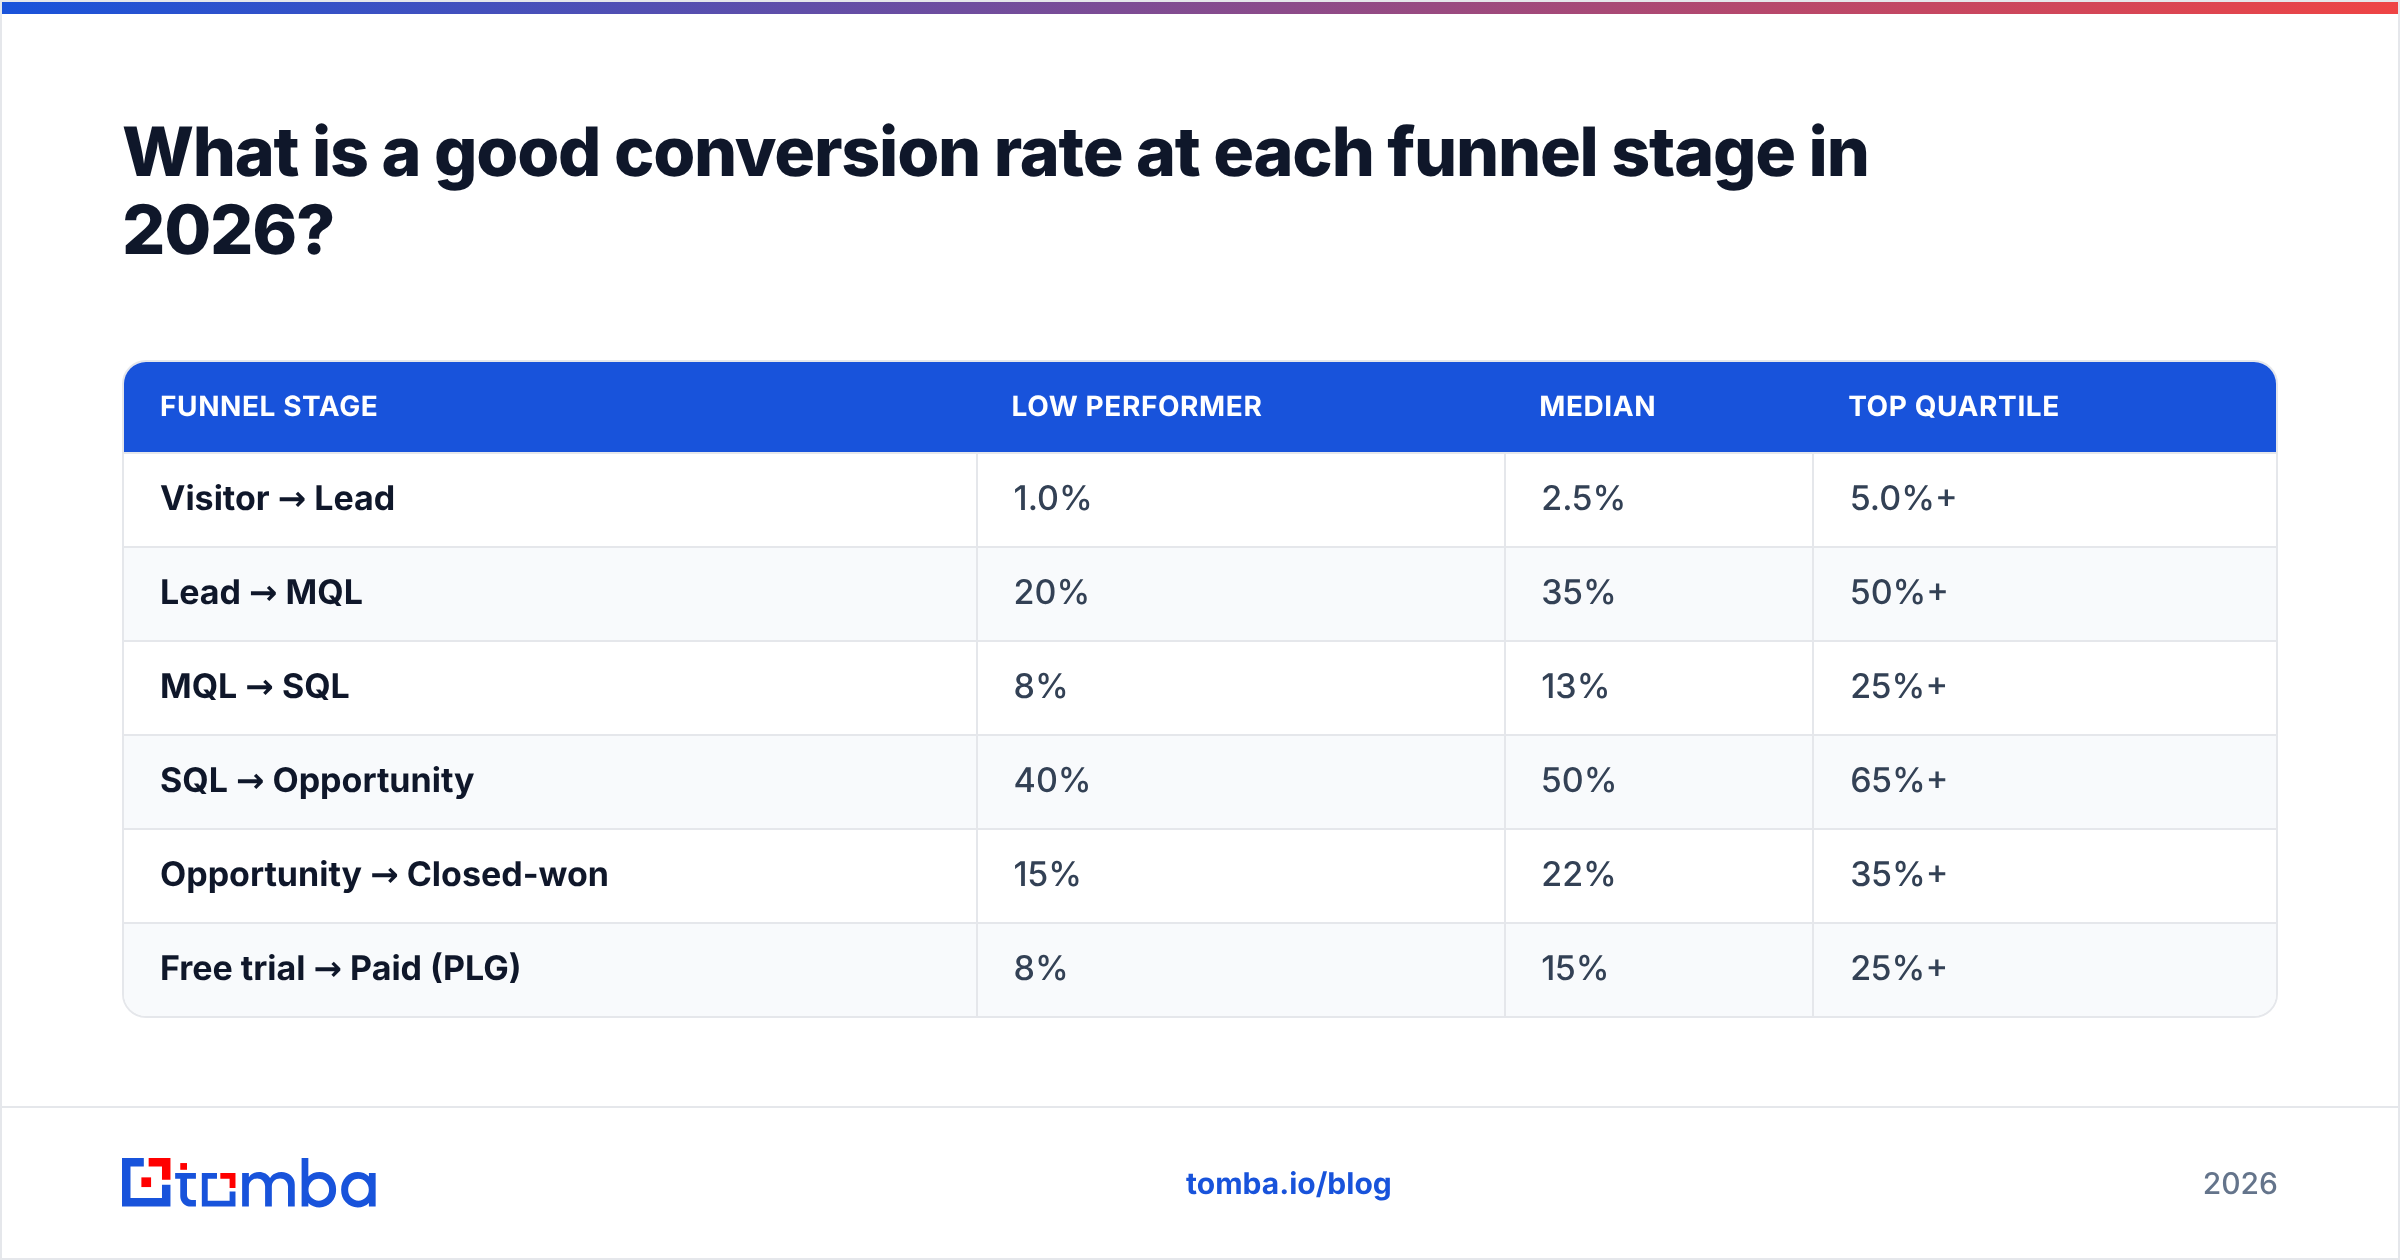
Here are the ranges most B2B SaaS teams should measure against in 2026. These are blended medians drawn from publicly reported SaaS and demand-gen data; treat them as a starting line, not gospel.
| Funnel stage | Low performer | Median | Top quartile |
|---|---|---|---|
| Visitor → Lead | 1.0% | 2.5% | 5.0%+ |
| Lead → MQL | 20% | 35% | 50%+ |
| MQL → SQL | 8% | 13% | 25%+ |
| SQL → Opportunity | 40% | 50% | 65%+ |
| Opportunity → Closed-won | 15% | 22% | 35%+ |
| Free trial → Paid (PLG) | 8% | 15% | 25%+ |
A few honest caveats. The compounding matters more than any single row: a funnel converting at median across all stages turns roughly 1,000 visitors into about 2–3 customers. If that sounds brutal, it is — which is why upstream targeting and traffic quality move the needle more than most late-stage tweaks.
For definitions of the terms in that table, the B2B glossary and the entry on marketing qualified leads are worth bookmarking so your team measures the same thing the same way.
How do PLG and sales-led funnels differ?#
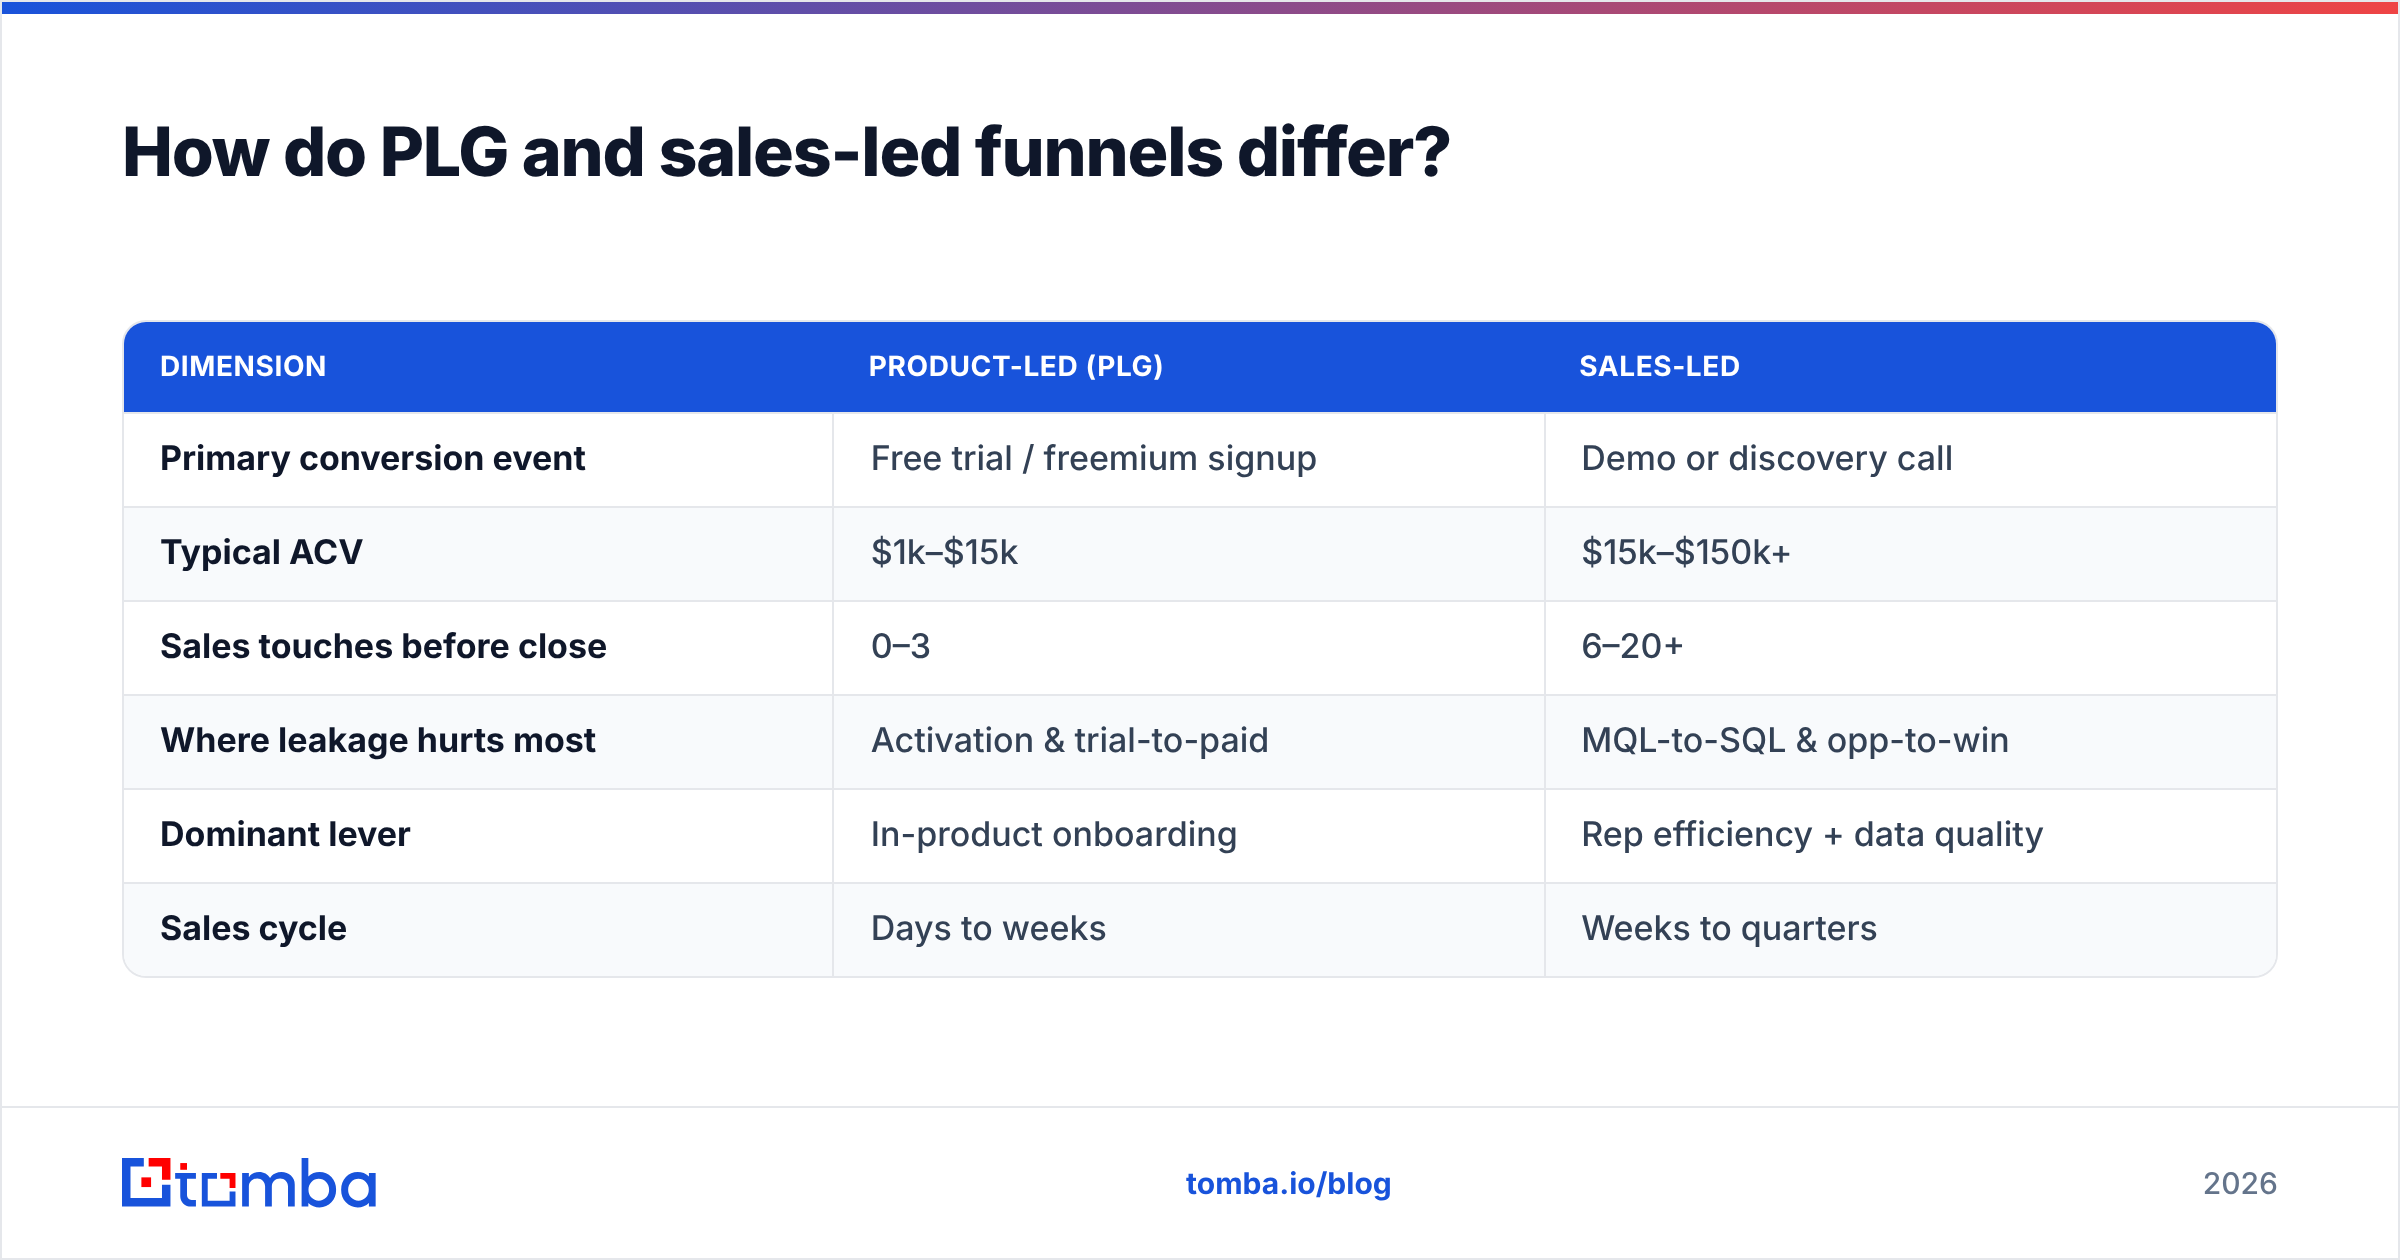
They differ enough that mixing their benchmarks will mislead you. A product-led funnel front-loads conversion into the product itself; a sales-led funnel front-loads it into human qualification.
Use this side-by-side to figure out which model your numbers should be compared against:
| Dimension | Product-led (PLG) | Sales-led |
|---|---|---|
| Primary conversion event | Free trial / freemium signup | Demo or discovery call |
| Typical ACV | $1k–$15k | $15k–$150k+ |
| Sales touches before close | 0–3 | 6–20+ |
| Where leakage hurts most | Activation & trial-to-paid | MQL-to-SQL & opp-to-win |
| Dominant lever | In-product onboarding | Rep efficiency + data quality |
| Sales cycle | Days to weeks | Weeks to quarters |
If you run a hybrid motion — common in 2026 — segment your reporting. Blending a 15% trial-to-paid PLG number with a 22% opp-to-win enterprise number produces an "average" that describes neither and hides both problems.
According to HubSpot's research on sales benchmarks, close rates vary more by industry and deal size than by almost any other factor, which is exactly why a single company-wide target tends to demoralize one team and let another coast.
Why is the MQL-to-SQL stage usually the worst leak?#
The MQL-to-SQL handoff is where most B2B SaaS funnels lose the most qualified-looking pipeline — and the root cause is almost always data, not effort. A median of 13% means roughly seven of every eight marketing-qualified leads never become sales-accepted.
Three failure modes drive it:
- Stale or wrong contact data. Reps work a list where titles changed, people left, and emails bounce. Time spent chasing dead records is time not spent selling. Email verification before handoff removes the bounce tax instantly.
- Thin enrichment. An MQL that's just a name and a generic email gives reps nothing to prioritize. Layering on firmographics and role data via data enrichment lets reps work the best-fit accounts first.
- Definition mismatch. Marketing counts a whitepaper download as an MQL; sales wants buying intent. When the two teams haven't agreed on the threshold, the conversion rate measures disagreement, not quality.
Fixing the first two is mechanical and fast. Fixing the third requires a shared definition — a revenue operations function exists largely to broker exactly this. Per Gartner's go-to-market research, organizations with formal RevOps alignment consistently report tighter funnel conversion than those without it.

How do you calculate your own funnel conversion rate?#
The math is simple; the discipline is in consistent definitions. For each stage:
Stage conversion rate = (count exiting the stage successfully ÷ count entering the stage) × 100
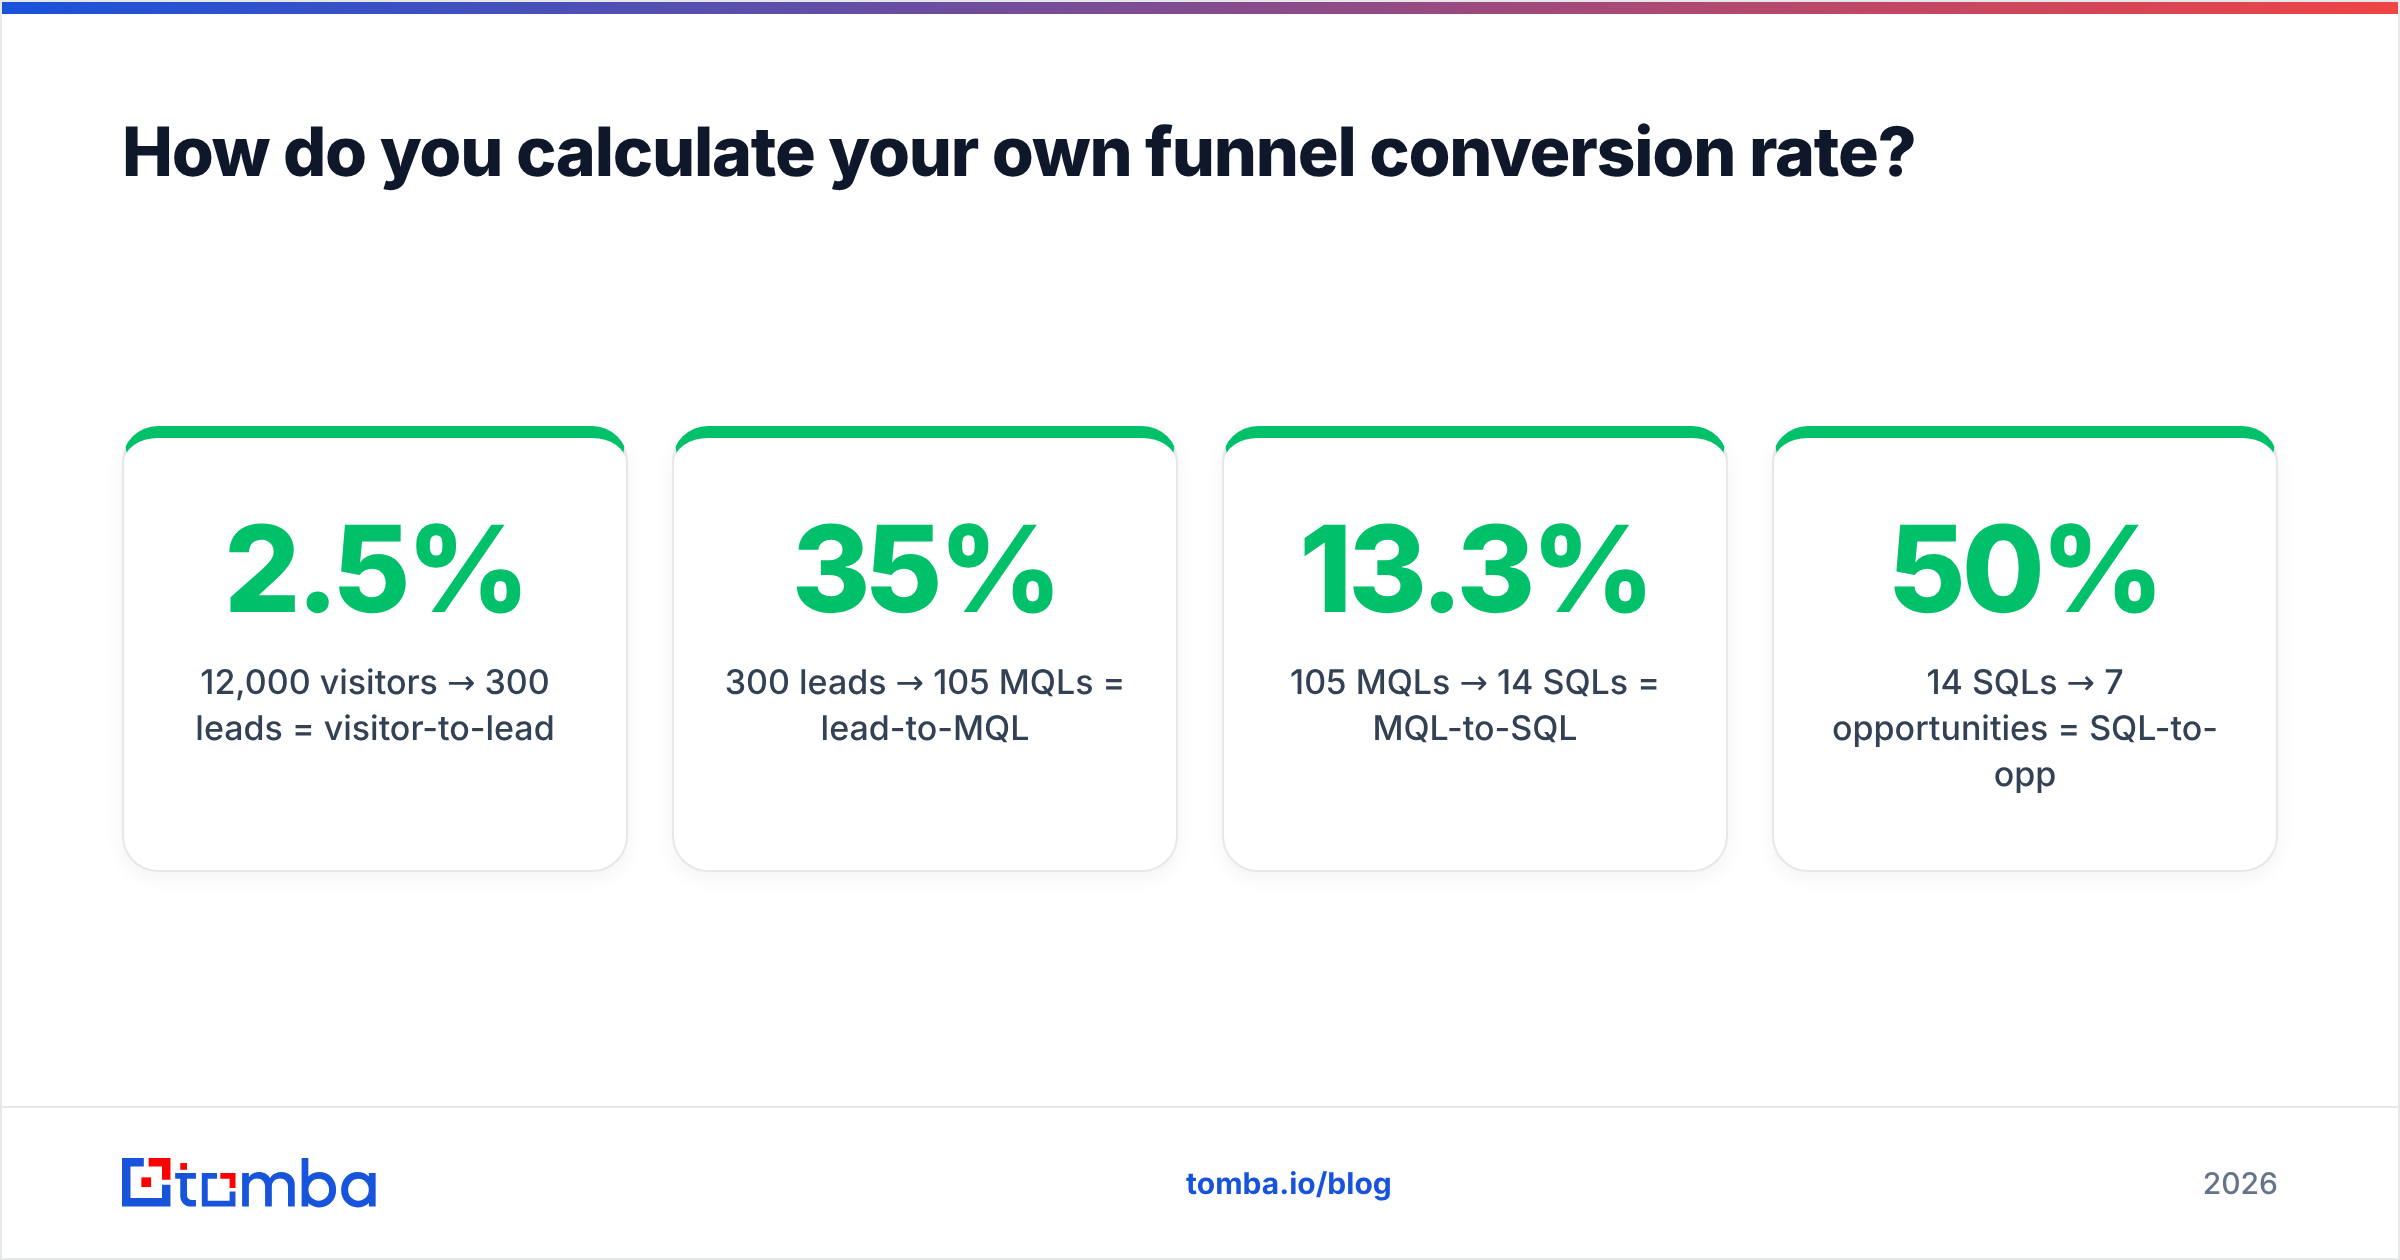
A worked example for a sales-led month:
- 12,000 visitors → 300 leads = 2.5% visitor-to-lead
- 300 leads → 105 MQLs = 35% lead-to-MQL
- 105 MQLs → 14 SQLs = 13.3% MQL-to-SQL
- 14 SQLs → 7 opportunities = 50% SQL-to-opp
- 7 opportunities → 2 closed-won = 28.6% opp-to-win
That funnel is at or above median everywhere — and still produces only two customers from twelve thousand visitors. This is the point most dashboards bury: small absolute conversion rates compound into large absolute losses, so the highest-leverage fix is usually the earliest leaky stage with the most volume flowing through it.
Two measurement rules keep this honest. Use a consistent time window (cohort by entry month, not exit month, or fast deals will flatter your numbers). And track win rate separately from velocity — a high win rate on a tiny, slow pipeline is not the same business as a moderate win rate on a fast, large one.
Which levers actually move the numbers?#
Rank your fixes by expected impact, not by how interesting they are. Here's the order that pays off for most B2B SaaS teams.
- Fix data quality at the top. Verified, enriched contacts raise MQL-to-SQL and reduce wasted rep hours more reliably than any creative change. Start with a bulk email finder pass on your existing list before you buy more traffic.
- Tighten ICP targeting. Sending fewer, better-fit leads to sales beats sending more. Use firmographic filters and domain search to build account lists that match your best closed-won customers.
- Speed up first response. Lead-to-MQL conversion is heavily time-sensitive; minutes matter. Automate routing so hot leads never sit.
- Standardize qualification. A written MQL/SQL definition both teams sign off on, reviewed quarterly.
- Then optimize creative. Landing pages, subject lines, and demo scripts matter — but they're amplifiers. Amplifying a leaky, mis-targeted funnel just produces more noise.
Notice that four of the five levers live upstream of the closing conversation. The closing stage gets the most attention and the most software budget, yet it's rarely where the largest, cheapest gains hide.
How often should you re-benchmark?#
Re-benchmark quarterly for internal trend and annually against external data. Conversion rates drift with seasonality, pricing changes, and market conditions, so a single snapshot is close to useless. What you want is the slope: is each stage improving cohort over cohort?
Set guardrails, not just targets. If MQL-to-SQL drops more than a few points month over month, that's an alert worth a same-week investigation — usually a data source degraded, a form broke, or a campaign brought in the wrong audience. Comparison sites like G2 and Capterra can help you sanity-check vendor categories when you suspect a tooling gap is dragging a stage down.
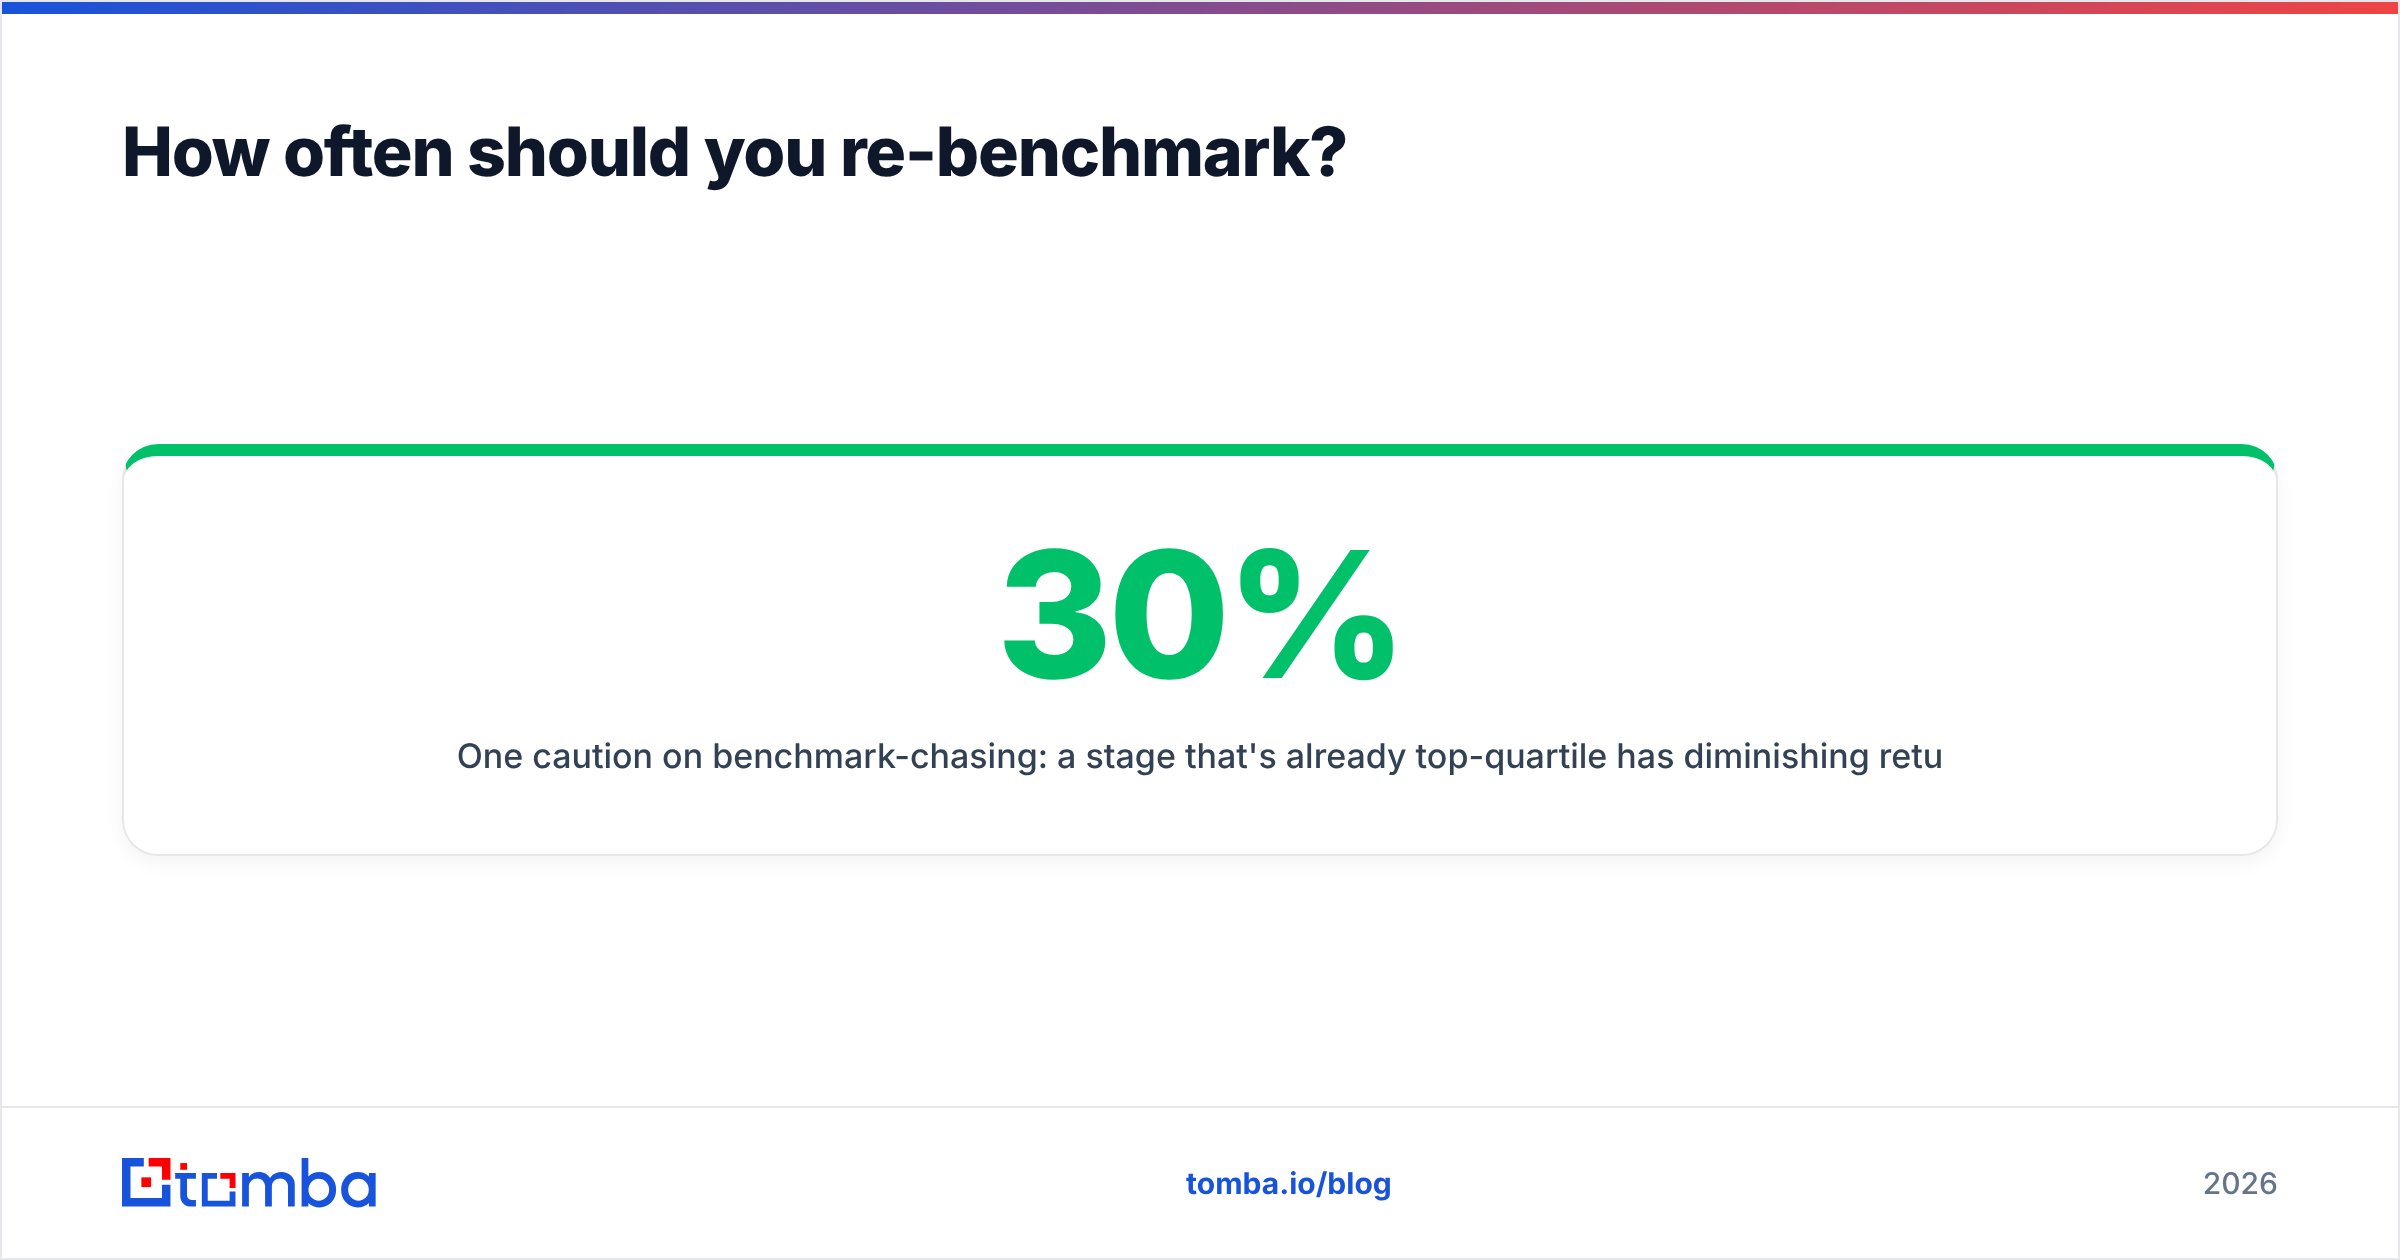
One caution on benchmark-chasing: a stage that's already top-quartile has diminishing returns. Pushing opp-to-win from 30% to 33% may cost more than pushing visitor-to-lead from 2% to 3%, which would deliver far more absolute customers. Always do the arithmetic on absolute volume before you commit a quarter to a stage.
Frequently asked questions#
What is the average B2B SaaS conversion rate from visitor to customer? End to end, a median funnel converts well under 1% of visitors into paying customers — often around 0.2–0.5% when you multiply every stage. That sounds alarming but is normal; the absolute numbers are what fund the business, so volume and fit at the top of funnel matter as much as rate.
Are these benchmarks different for enterprise versus SMB SaaS? Yes. Enterprise funnels show lower SQL-to-opp and longer cycles but higher ACV, while SMB and PLG funnels convert faster at lower deal sizes. Segment before you compare.
What's the fastest way to improve MQL-to-SQL conversion? Clean and enrich the data before handoff. Verifying emails and adding role and firmographic context lets reps prioritize real, reachable buyers — typically the single fastest lift available.
Put the benchmarks to work#
Benchmarks tell you where the leak is; clean data is how you plug it. The most common funnel killer in B2B SaaS isn't a weak demo or a bad headline — it's reps burning hours on stale, unverified, under-enriched contacts that were never going to convert.
Tomba's Email Finder helps you build accurate, verified, enrichment-ready contact lists by domain, name, or company — so the MQLs you hand to sales are reachable and worth working. Start free with 25 searches a month, and scale on the Starter plan at $49/mo once you've proven the lift in your own funnel. Fix the data, and watch the stage-by-stage numbers follow.
Ready to find emails that actually work?
Join 150,000+ professionals who stopped guessing and started sending. Free credits on signup — no credit card required.
Get the Tomba newsletter
Practical outbound tactics and product updates — once every two weeks.
About the author