B2B Sales Funnel Metrics: 12 KPIs That Matter in 2026
Stop tracking vanity numbers. Here are the 12 B2B sales funnel metrics that actually predict revenue in 2026 — with benchmarks, formulas, and how to fix each one.
Most B2B sales teams track dozens of numbers and steer by almost none of them. The dashboard is full, the forecast is still a guess, and nobody can say which stage is actually leaking. The fix is not more metrics — it is the right metrics, defined the same way every quarter, tied to revenue.
This guide breaks down the 12 B2B sales funnel metrics that matter in 2026: what each one means, how to calculate it, a realistic benchmark, and the lever you pull when it slips.
TL;DR#
- Track outcomes, not activity. Conversion rate by stage, sales velocity, and win rate predict revenue; call counts and email opens do not.
- Sales velocity is the master metric — it folds deal count, win rate, deal size, and cycle length into one number you can forecast against.
- Stage-to-stage conversion tells you exactly where the funnel leaks, so you stop optimizing the wrong step.
- Data quality sits underneath every metric. Bad contact data inflates your top of funnel and wrecks every downstream ratio.
- Benchmark against yourself first. Industry averages are a sanity check; your own trend line is the real scoreboard.
What are B2B sales funnel metrics?#
B2B sales funnel metrics are the quantitative measures of how prospects move from first touch to closed revenue. Think of the funnel like a water pipe with several joints: volume goes in at the top, and at each joint some of it leaks out. Funnel metrics measure the flow rate and the size of each leak so you can repair the right joint instead of replacing the whole pipe.
They fall into three buckets:
- Volume metrics — how many leads, MQLs, SQLs, and opportunities enter each stage.
- Conversion metrics — the percentage that advances from one stage to the next.
- Efficiency metrics — how fast, how cheaply, and how profitably those deals close.
A healthy reporting setup uses one or two metrics from each bucket. Pile on more and you get a dashboard nobody reads.
Which sales funnel stages should you measure?#
Before metrics, agree on stages. A typical 2026 B2B funnel has five, and every metric below maps to a transition between two of them.
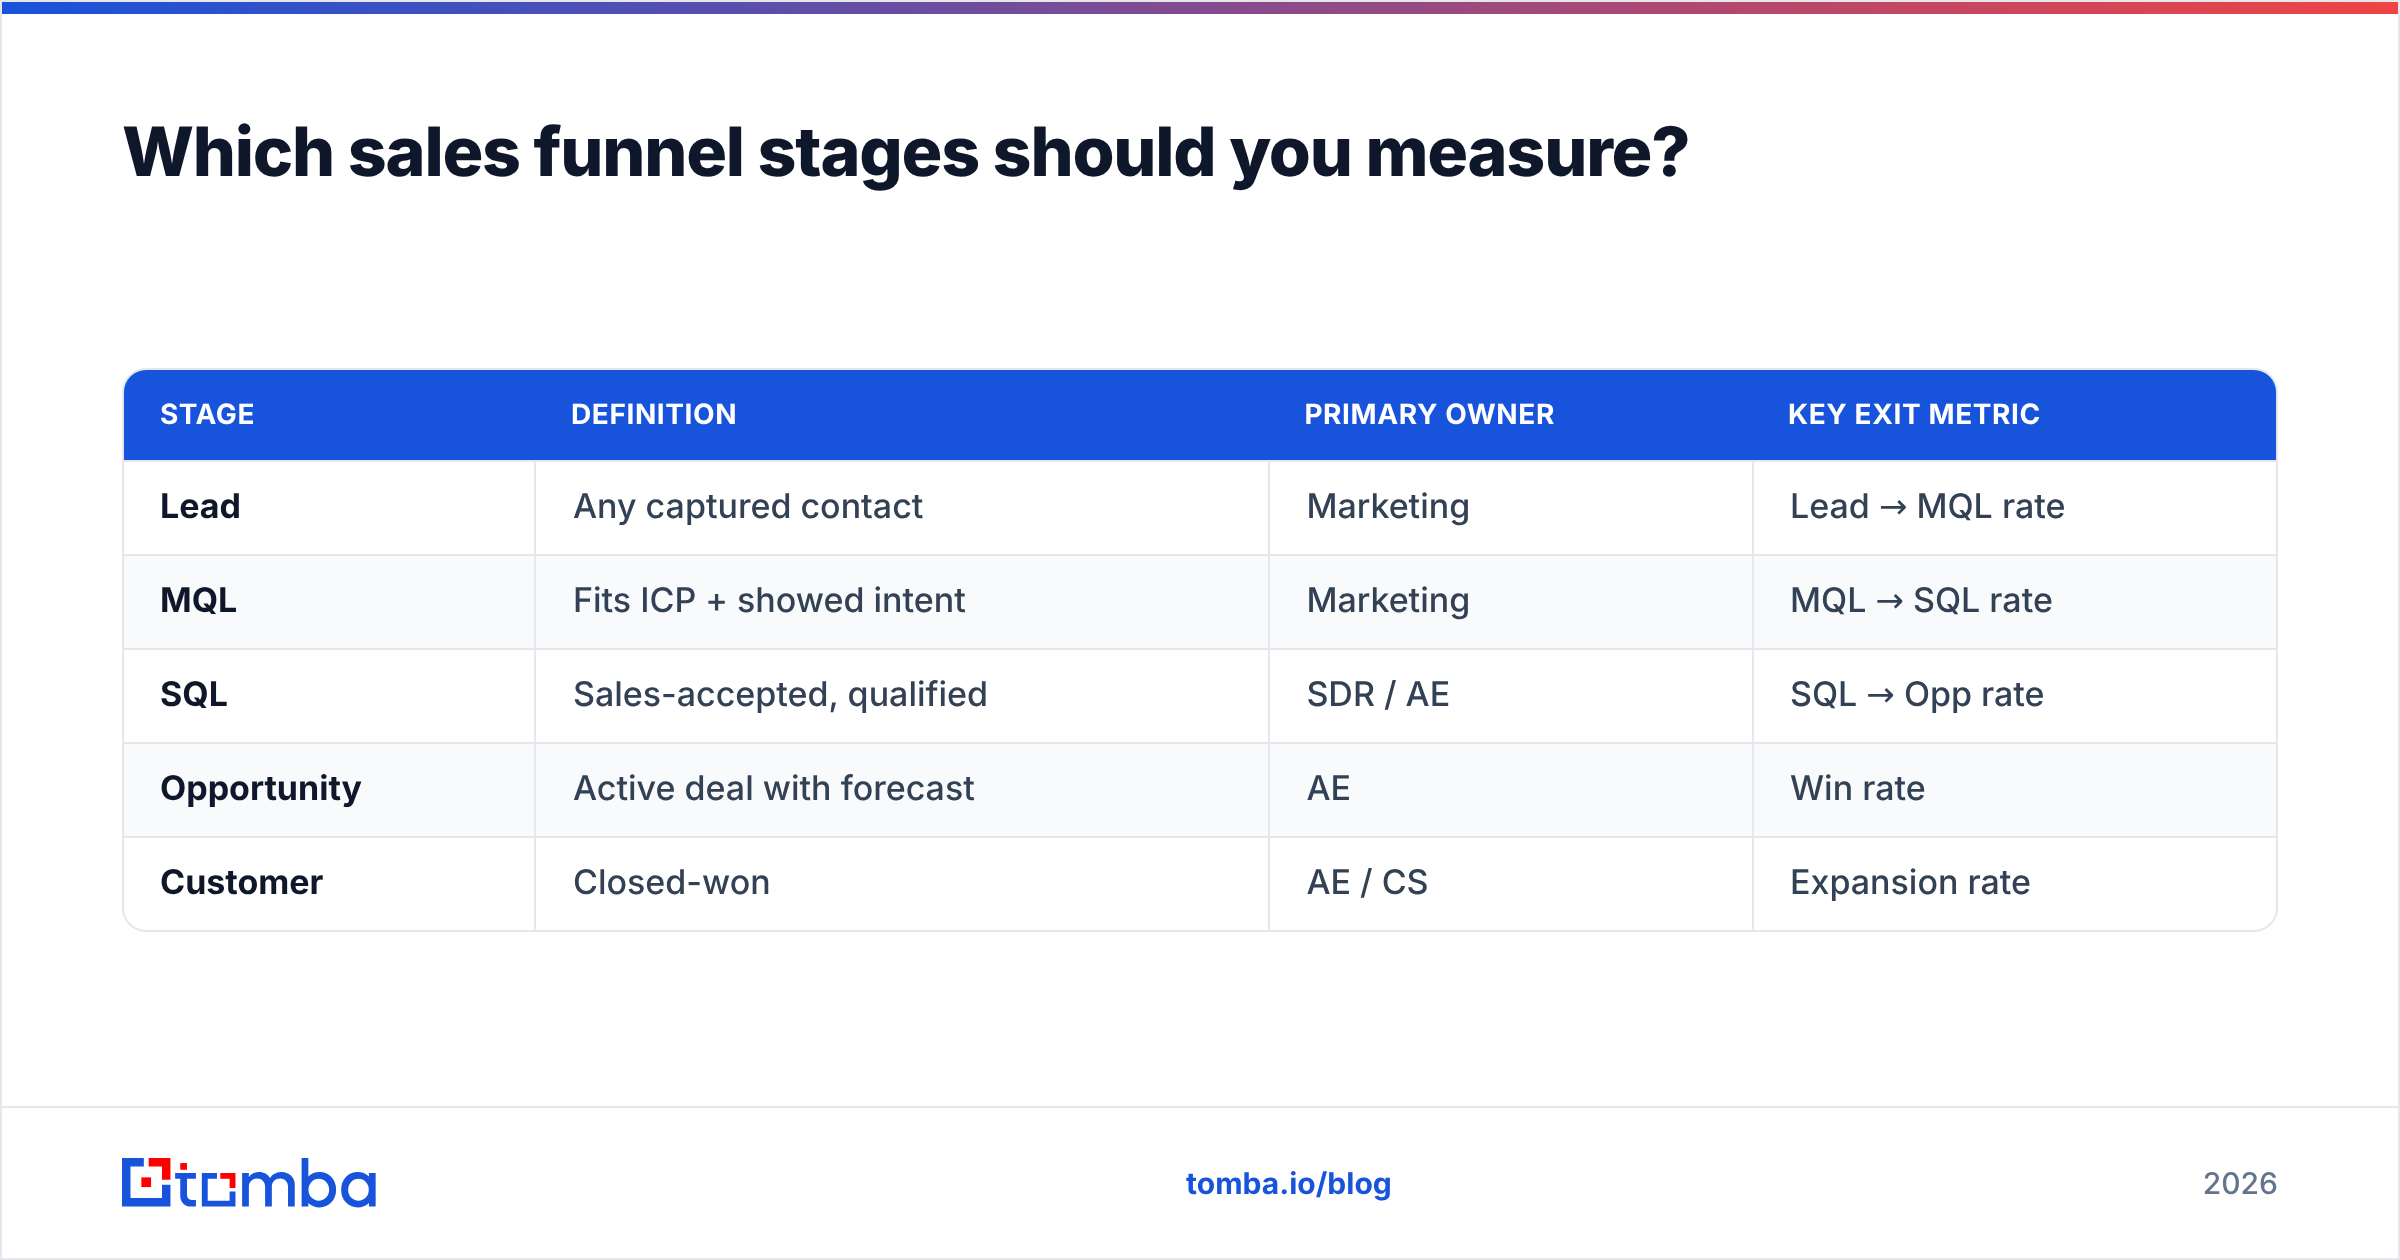
| Stage | Definition | Primary owner | Key exit metric |
|---|---|---|---|
| Lead | Any captured contact | Marketing | Lead → MQL rate |
| MQL | Fits ICP + showed intent | Marketing | MQL → SQL rate |
| SQL | Sales-accepted, qualified | SDR / AE | SQL → Opp rate |
| Opportunity | Active deal with forecast | AE | Win rate |
| Customer | Closed-won | AE / CS | Expansion rate |
The single most common mistake is letting marketing and sales define "qualified" differently. If an MQL means one thing to the demand-gen team and something else to the AE who receives it, every conversion metric downstream is fiction. Write the definitions down, get both teams to sign off, and revisit them quarterly. A shared marketing qualified lead definition is the foundation the whole funnel rests on.
What are the 12 B2B sales funnel metrics that matter?#
Here are the metrics worth a permanent place on your dashboard, with formulas and 2026 SaaS-leaning benchmarks. Treat benchmarks as starting points — your segment, ACV, and motion will shift them.
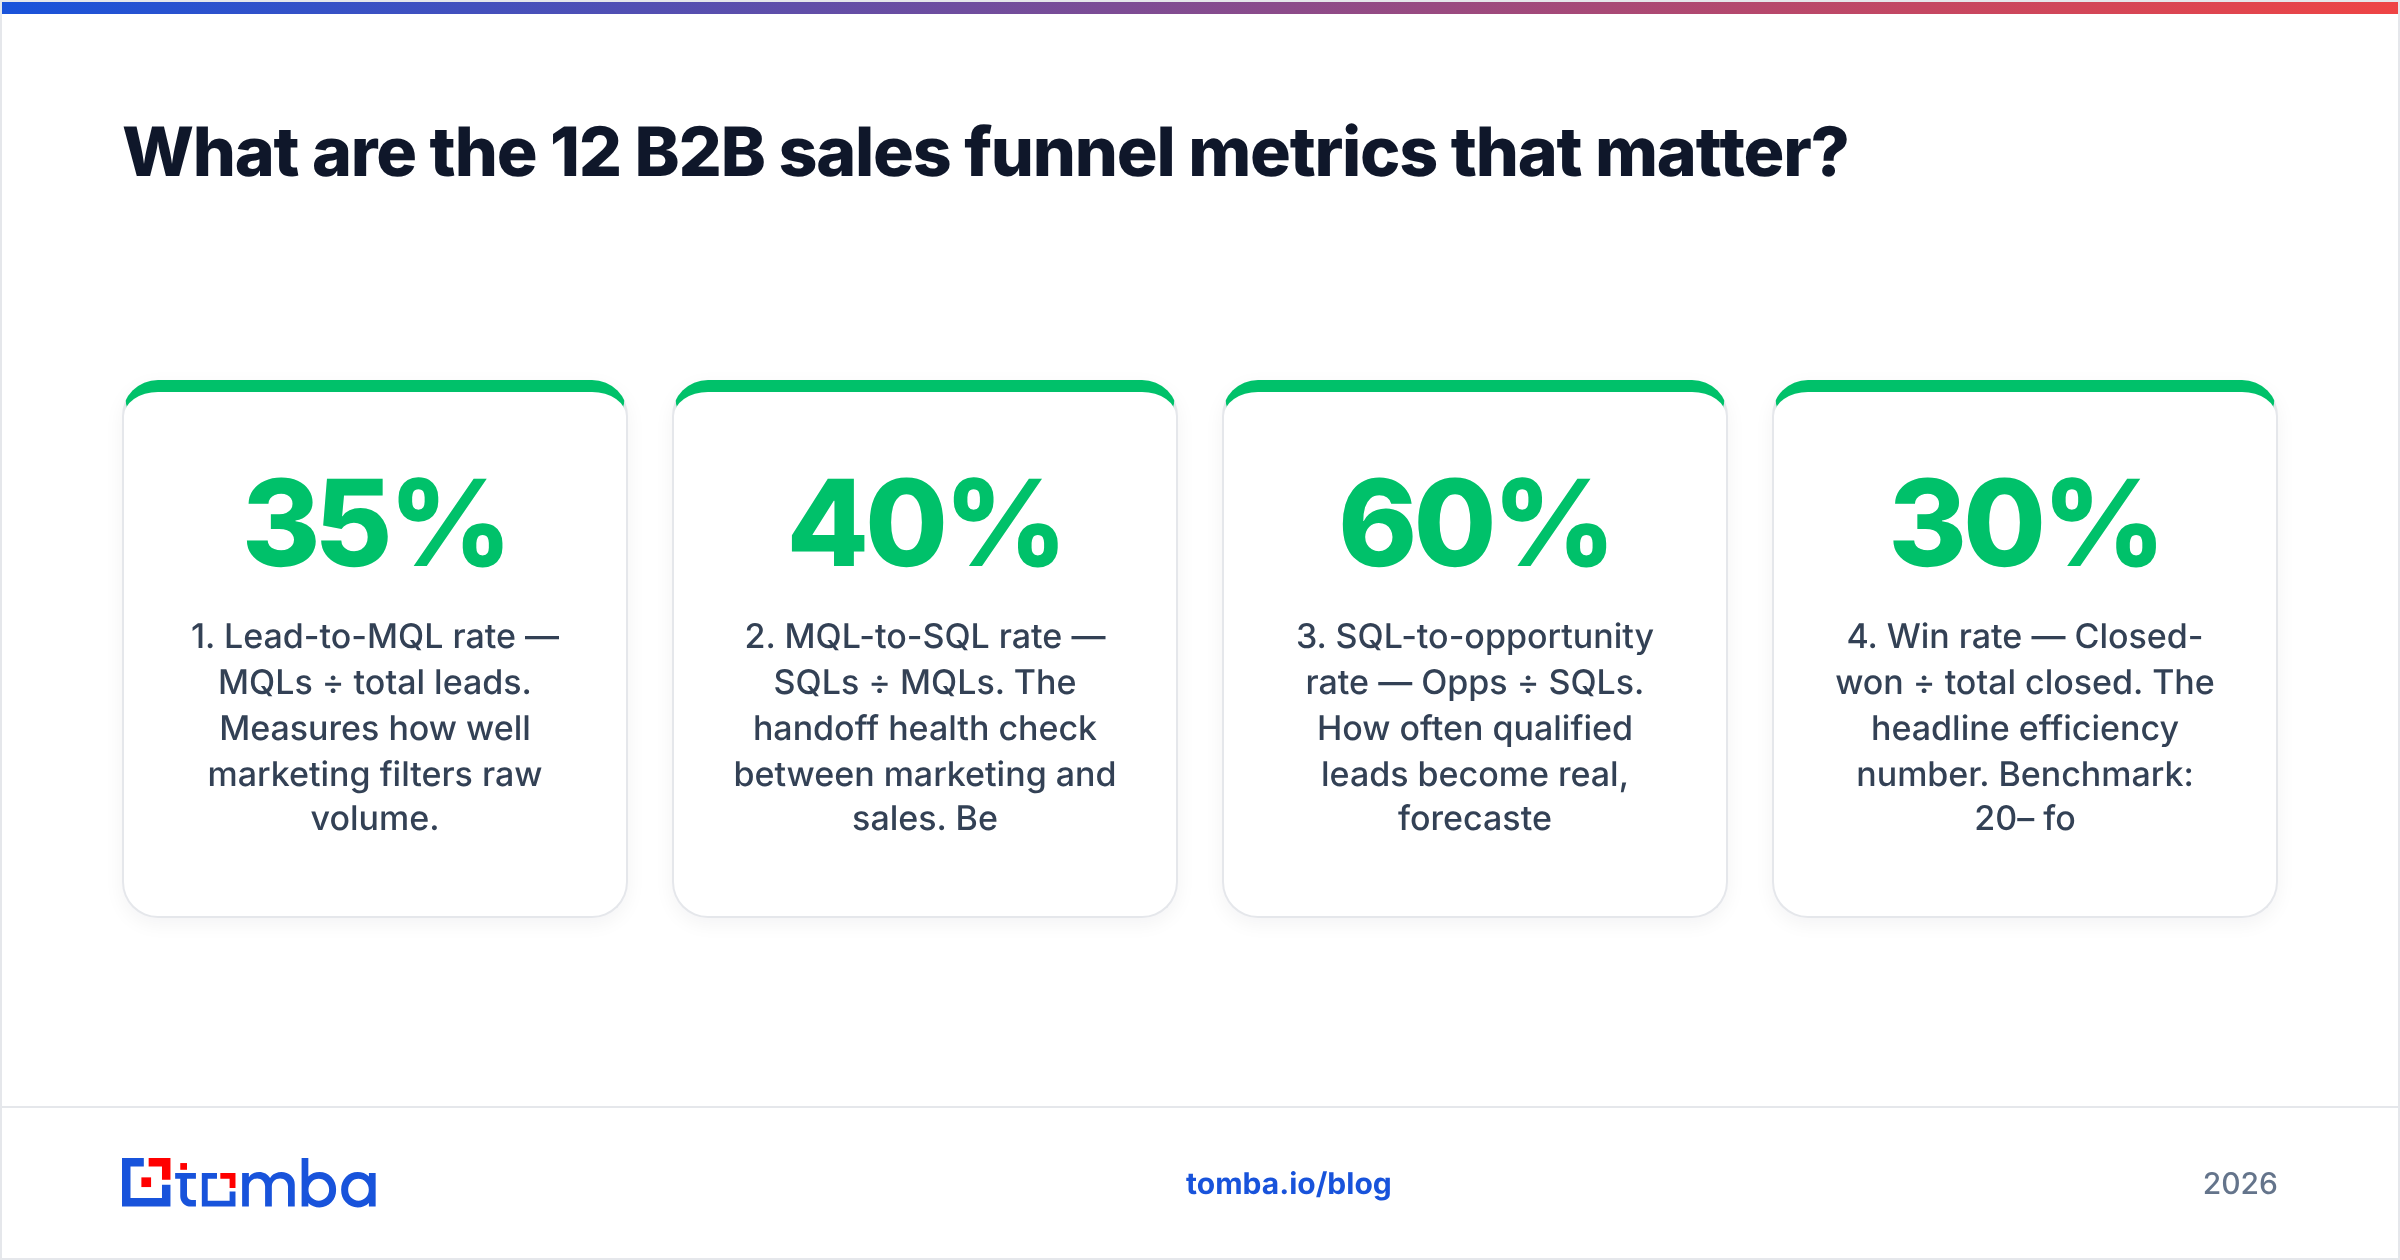
- Lead-to-MQL rate —
MQLs ÷ total leads. Measures how well marketing filters raw volume. Benchmark: 25–35%. - MQL-to-SQL rate —
SQLs ÷ MQLs. The handoff health check between marketing and sales. Benchmark: 25–40%. - SQL-to-opportunity rate —
Opps ÷ SQLs. How often qualified leads become real, forecasted deals. Benchmark: 40–60%. - Win rate —
Closed-won ÷ total closed. The headline efficiency number. Benchmark: 20–30% for new business. - Average deal size (ACV) —
Total new revenue ÷ deals won. Drives velocity and territory planning. - Sales cycle length — average days from opportunity created to closed-won. Shorter is usually better, but not at the cost of deal size.
- Sales velocity — covered in detail below; the compound master metric.
- Pipeline coverage —
Open pipeline ÷ quota. Aim for 3x–4x for the period you are forecasting. - Customer acquisition cost (CAC) — fully loaded sales + marketing spend ÷ new customers.
- Lead response time — minutes from inbound lead to first contact. Under five minutes dramatically lifts conversion.
- Funnel conversion rate (overall) —
Customers ÷ top-of-funnel leads. The end-to-end yield. - Pipeline velocity by stage — how long deals sit in each stage before advancing, exposing stall points.
Track these consistently and you can answer the only three questions that matter in a pipeline review: where are we leaking, how fast are we moving, and will we hit the number?
How do you calculate sales velocity?#
Sales velocity is the amount of revenue your funnel generates per day, and it is the closest thing B2B has to a single master metric.
Sales velocity = (Number of opportunities × Win rate × Average deal value) ÷ Sales cycle length (in days).
Say you have 50 open opportunities, a 25% win rate, a $20,000 average deal, and a 60-day cycle:
(50 × 0.25 × 20,000) ÷ 60 = $4,166 per day.
The power of this formula is that it shows trade-offs. Cut your cycle from 60 to 45 days and velocity jumps to $5,555/day — a 33% gain without a single new lead. That is why mature teams obsess over win rate and cycle length before they spend more on top-of-funnel volume. The four inputs are also your four levers: more deals, better win rate, bigger deals, or faster cycles. Pick the one with the most slack.
How do you find the leak in your funnel?#
Compare stage-to-stage conversion rates against your own trailing average, then attack the single biggest drop. This stops you from "optimizing" a stage that is already healthy.
Work through the funnel in order:
- Lead → MQL is low? Your targeting or lead capture is bringing in the wrong people. Tighten ICP filters and improve data hygiene at the point of entry.
- MQL → SQL is low? Either the MQL bar is too soft or sales is ignoring marketing leads. Re-align the definition and audit follow-up.
- SQL → Opportunity is low? Discovery and qualification are weak. Reps are accepting leads they should disqualify, or failing to create urgency.
- Opportunity → Won is low? Late-stage problems: pricing, competition, or missing decision-makers. Map the buying committee earlier.
A frequent and invisible culprit sits at the very top: bad contact data. If 20% of your inbound leads have wrong or dead email addresses, your Lead → MQL rate looks broken when the real problem is reachability. Running new contacts through an email verifier before they hit the funnel keeps your denominators honest and your reps off dead ends.
Which metrics are vanity metrics you should drop?#
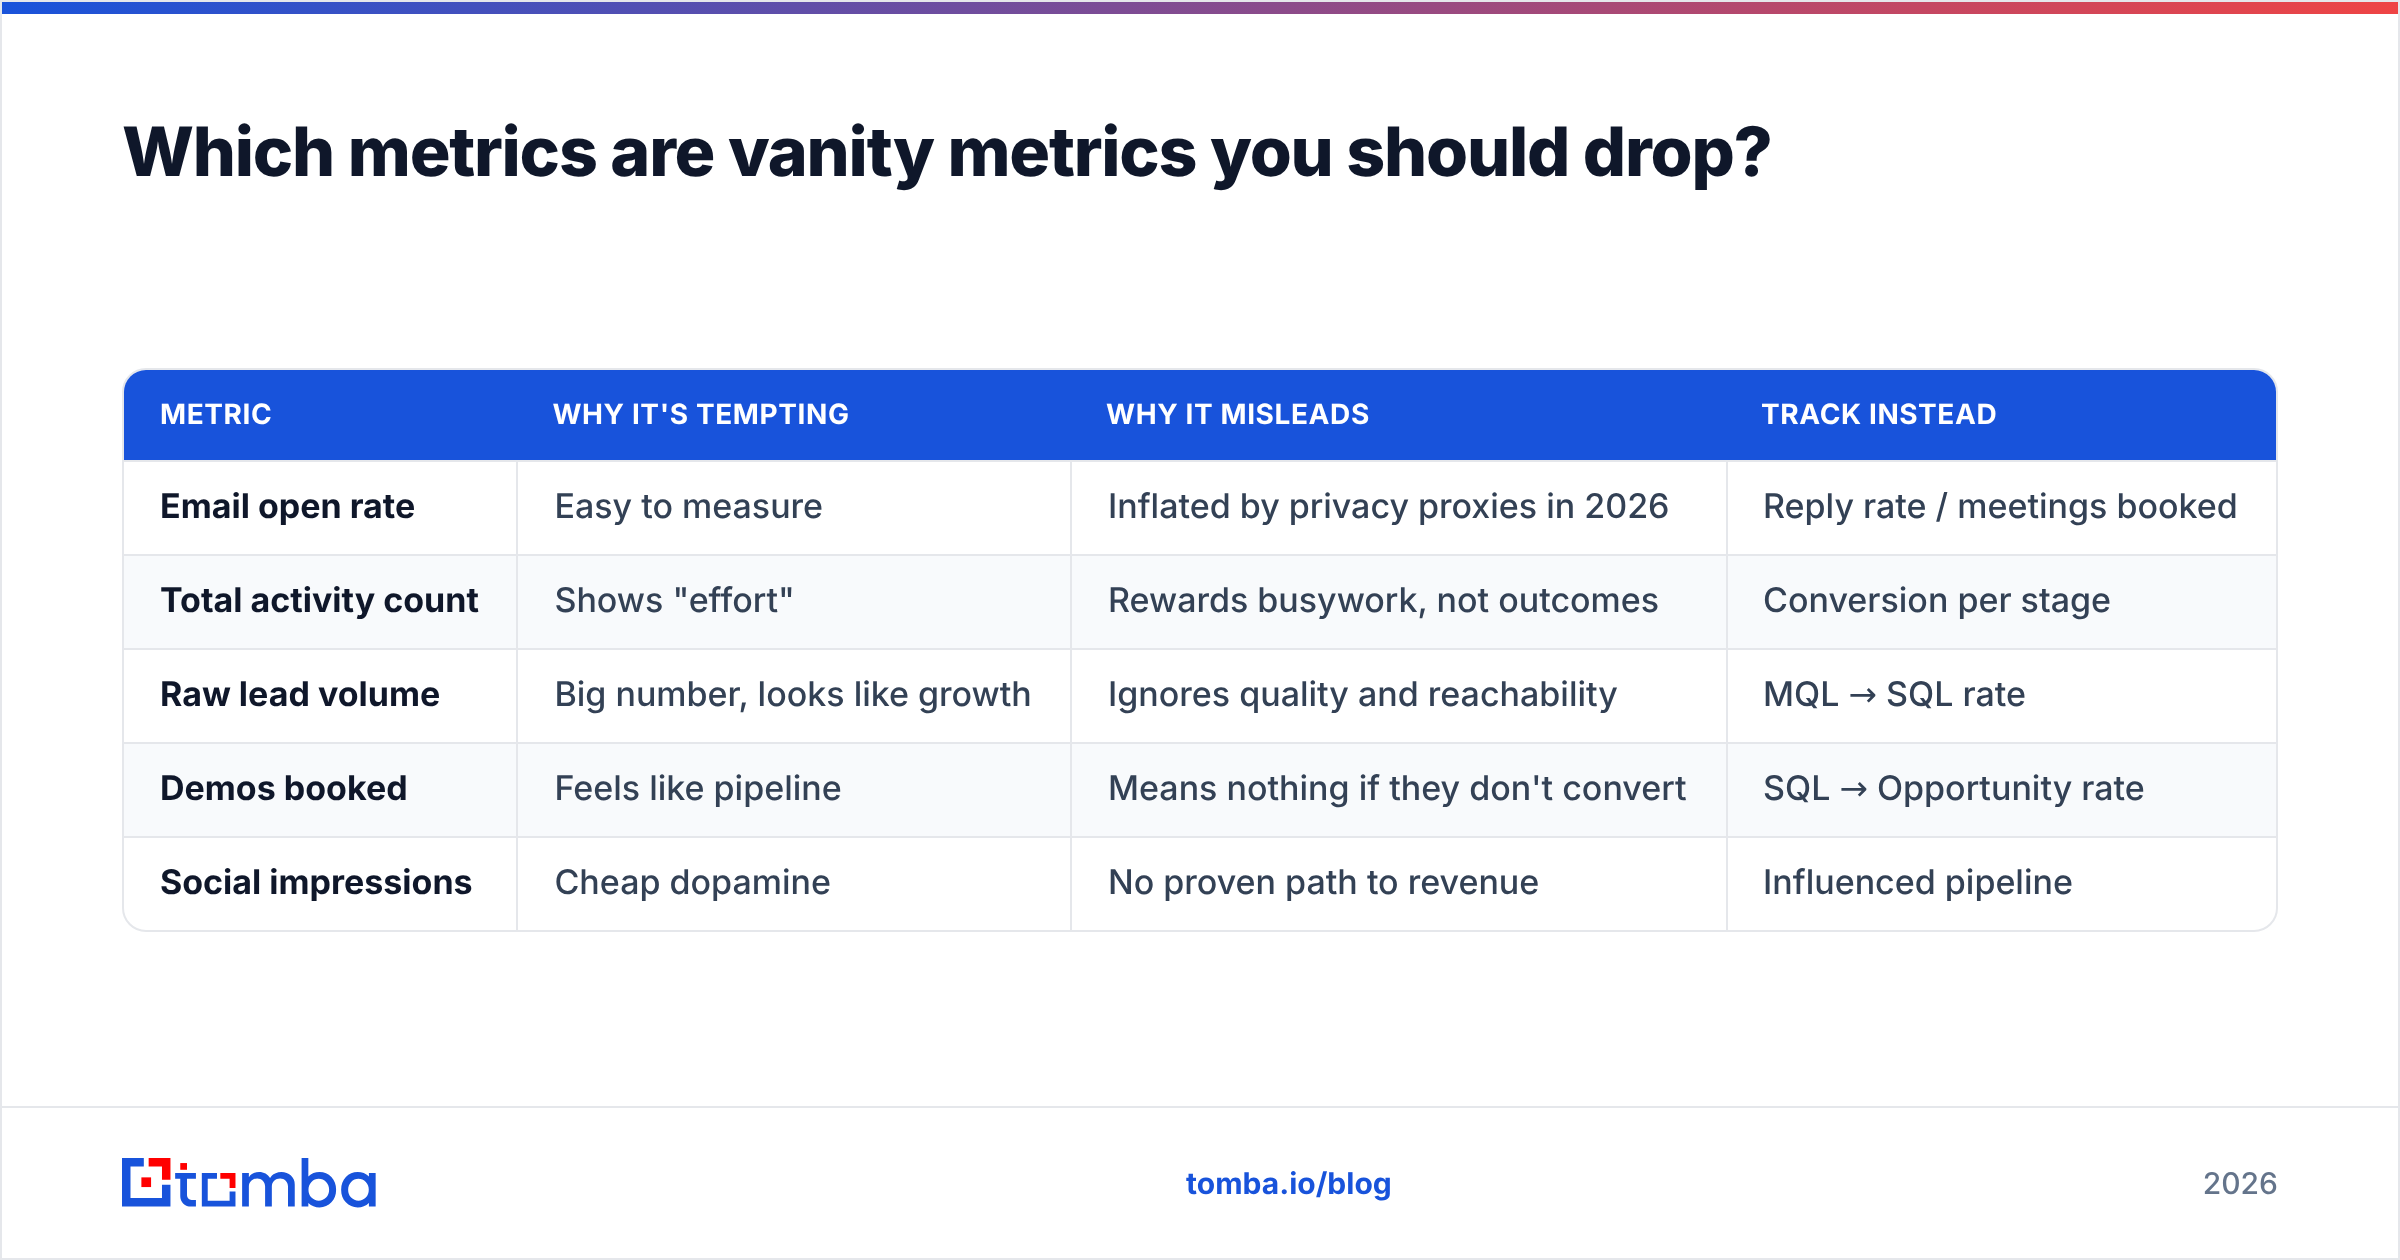
Some numbers feel productive but never move revenue. Cut or demote these:
| Metric | Why it's tempting | Why it misleads | Track instead |
|---|---|---|---|
| Email open rate | Easy to measure | Inflated by privacy proxies in 2026 | Reply rate / meetings booked |
| Total activity count | Shows "effort" | Rewards busywork, not outcomes | Conversion per stage |
| Raw lead volume | Big number, looks like growth | Ignores quality and reachability | MQL → SQL rate |
| Demos booked | Feels like pipeline | Means nothing if they don't convert | SQL → Opportunity rate |
| Social impressions | Cheap dopamine | No proven path to revenue | Influenced pipeline |
The test is simple: if a metric can go up while revenue stays flat, it belongs on a diagnostic report, not your main scoreboard. The response rate on your outreach is a far better leading indicator than open rate, because a reply requires a human decision.
What are realistic B2B funnel benchmarks for 2026?#
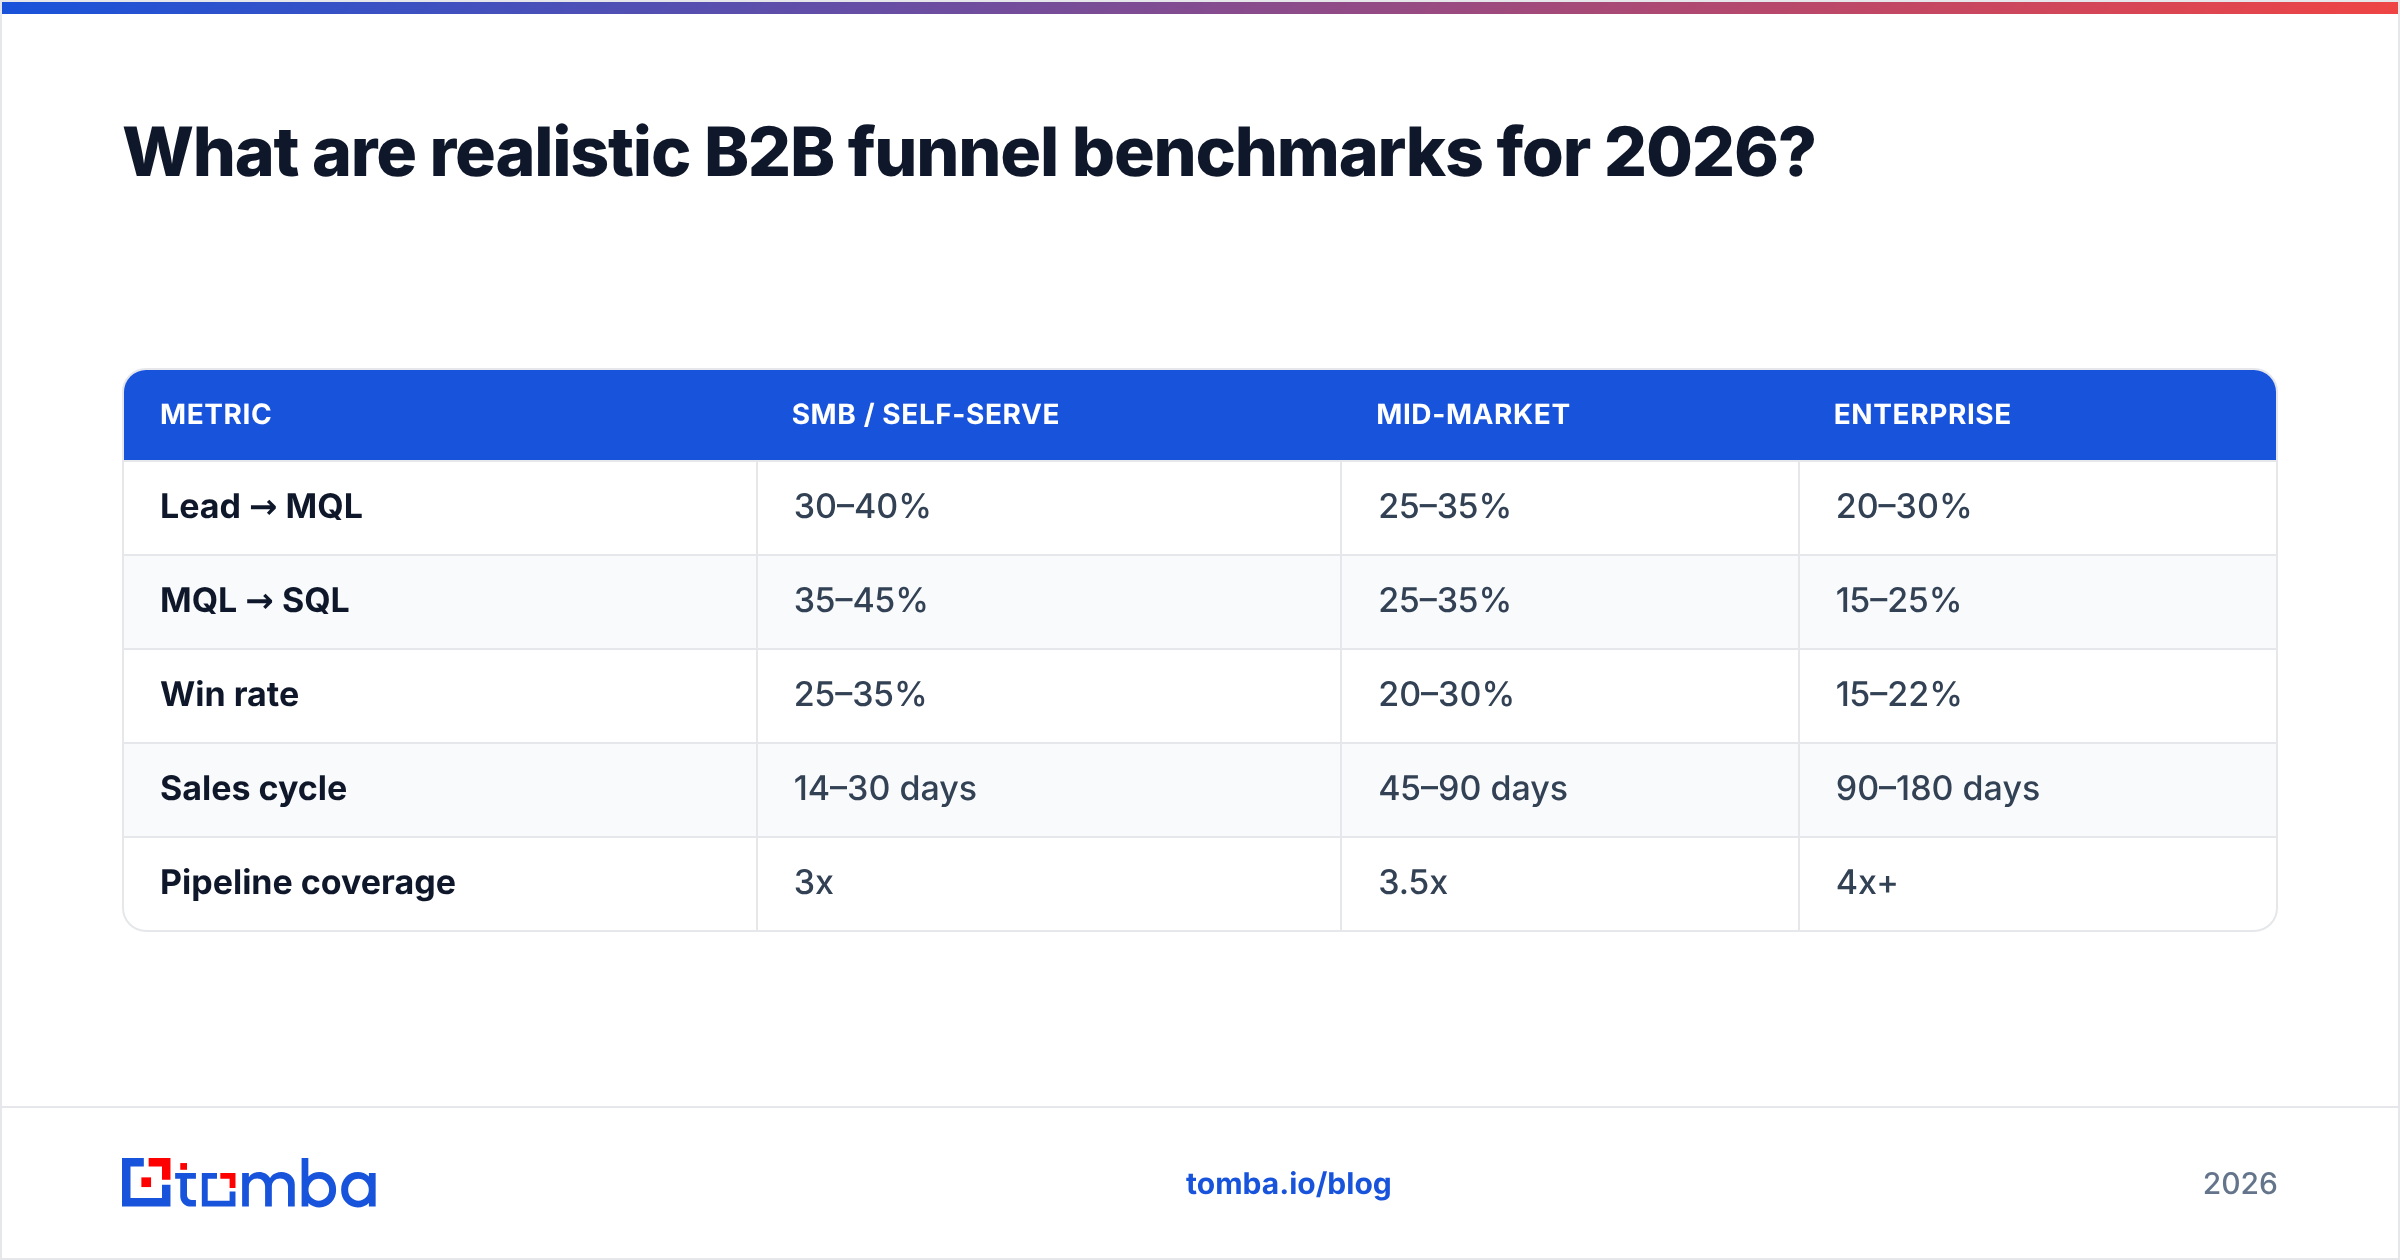
Benchmarks vary wildly by ACV, motion, and segment, so use these as guardrails, not targets. A self-serve $50/month product and a $250,000 enterprise platform live in different universes.
| Metric | SMB / self-serve | Mid-market | Enterprise |
|---|---|---|---|
| Lead → MQL | 30–40% | 25–35% | 20–30% |
| MQL → SQL | 35–45% | 25–35% | 15–25% |
| Win rate | 25–35% | 20–30% | 15–22% |
| Sales cycle | 14–30 days | 45–90 days | 90–180 days |
| Pipeline coverage | 3x | 3.5x | 4x+ |
Two notes. First, longer cycles at the enterprise end are not a failure — they reflect larger committees and bigger contracts. Second, the most useful benchmark is your own quarter-over-quarter trend. Industry data tells you if you are roughly sane; your own line tells you if you are improving. For independent benchmark data, Gartner and peer-review sites like G2 publish segment breakdowns worth cross-checking.
How does data quality affect every funnel metric?#
Data quality is the silent multiplier on every metric in this article. Garbage in, garbage funnel.
Consider the chain reaction from one bad data point. A lead enters with a guessed email format. It bounces, but your CRM still counts it as a lead, inflating your top of funnel. The rep wastes a touch on an unreachable contact, dragging down response rate. Because the contact never engages, it eventually dies as an "unqualified" MQL, depressing your MQL → SQL rate through no fault of the sales team. One bad record quietly distorts four metrics.
This is why accurate prospecting data is a funnel-metrics issue, not just a sales-ops chore. The fixes are straightforward:
- Verify at entry. Validate every email before it counts as a lead.
- Enrich thin records. Append firmographics and role data so qualification is accurate. Tools like data enrichment turn a bare email into a scored, routable lead.
- Source reachable contacts. When you build target lists, start from verified data rather than scraped guesses. An email finder that returns verified, ICP-matched contacts keeps your top of funnel real.
- Deduplicate ruthlessly. Duplicate opportunities double-count pipeline and break coverage ratios.
Get this layer right and every downstream metric becomes trustworthy. Get it wrong and you are forecasting on fiction. For how upstream data sourcing connects to deliverability, the email deliverability basics are worth a read before you scale outreach.
How often should you review these metrics?#
Match the cadence to how fast each metric can move. Reviewing win rate daily is noise; reviewing lead response time monthly is negligence.
- Daily: lead response time, new opportunities created.
- Weekly: pipeline coverage, stage velocity, activity-to-outcome ratios.
- Monthly: conversion rates by stage, sales velocity, win rate.
- Quarterly: CAC, full-funnel conversion, stage-definition review.
The quarterly stage-definition review is the one teams skip and regret. Markets shift, products change, and an MQL definition from 18 months ago slowly drifts from reality, silently corrupting your trend lines. Reputable sources like HubSpot's research reset their benchmark studies regularly for the same reason — definitions decay.
Putting it together: a minimal funnel dashboard#
You do not need 40 charts. A board-ready B2B funnel dashboard fits on one screen:
- Sales velocity (the headline, trended monthly).
- Conversion rate by stage (the leak detector).
- Pipeline coverage vs. quota (the forecast confidence check).
- Win rate and average deal size (the quality of what you close).
- Data quality indicator — bounce rate or % of records verified (the metric under the metrics).
Everything else is a drill-down you open only when one of these five flashes red.
Start with clean data#
Every metric in this guide degrades the moment your contact data does. The fastest, cheapest improvement most B2B teams can make is not a new playbook — it is feeding the funnel verified, ICP-matched contacts so the numbers reflect reality.
That is exactly what the Tomba Email Finder is built for: find verified professional emails by name, company, or domain, enrich them with role and firmographic data, and push reachable contacts straight into your pipeline. Start on the free tier (25 searches/month), or scale on the Starter plan at $49/month — see full Tomba pricing for higher-volume tiers. Clean inputs, honest metrics, a funnel you can actually forecast.
// get started
Find, verify and enrich your first contacts today
Start on the free plan with 25 searches a month, then scale when your team is ready.
Free plan · No credit card required · GDPR & CCPA
// about the author