B2B Sales Process Flowchart: 7 Stages to Map in 2026
A B2B sales process flowchart turns a fuzzy pipeline into a repeatable system. Here are the 7 stages, exit criteria, and tools to map every deal in 2026.
A B2B sales process flowchart is the difference between a team that closes on instinct and a team that closes on a system. When every rep follows the same map — same stages, same exit criteria, same handoffs — your forecast stops being a guess and your pipeline stops leaking deals at random.
This guide walks through the seven stages every B2B flowchart needs, the exit criteria that move a deal forward, and the tools that automate the busywork in between.
TL;DR#
- A B2B sales process flowchart is a visual map of every stage a deal passes through, from lead generation to closed-won, with clear exit criteria between each box.
- The standard flow has 7 stages: prospecting, qualification, discovery, demo/evaluation, proposal, negotiation, and close (plus a post-sale handoff loop).
- Each stage needs a single exit criterion — the one thing that must be true before a deal advances — or your pipeline inflates with stalled deals.
- Automate the top of the funnel: an email finder and verified contact data feed clean leads into stage one so reps spend time selling, not researching.
- Review the flowchart quarterly. A process that fit a 5-person team breaks at 25 reps.
What is a B2B sales process flowchart?#
A B2B sales process flowchart is a diagram that shows, step by step, how a lead becomes a customer. Think of it like a subway map: each station is a stage, the lines between stations are the actions that move a deal, and you can't skip from the first stop to the last without passing through the ones in between.
Technically, it standardizes three things: the stages a deal moves through, the exit criteria that gate each transition, and the owner responsible at each step. Without a flowchart, "qualified" means whatever each rep decides on a Tuesday. With one, qualified means a specific, checkable definition that everyone shares.
The payoff is measurable. Companies with a documented, defined sales process see materially higher win rates than teams running on tribal knowledge, because the flowchart exposes exactly where deals stall and why.

What are the 7 stages of a B2B sales flowchart?#
Here are the seven stages most B2B teams map, in order, with the action that defines each one:
- Prospecting — Build a target list and source verified contact details. This is where a bulk email finder and accurate data matter most; garbage in, garbage out for the whole funnel.
- Qualification — Score the lead against fit criteria (budget, authority, need, timing). Disqualify fast so reps don't waste cycles.
- Discovery — Run a structured call to map pain, stakeholders, and the cost of inaction. This is listening, not pitching.
- Demo / Evaluation — Show the product solving the specific problem surfaced in discovery, not a generic feature tour.
- Proposal — Send pricing and scope tied to the buyer's stated business case.
- Negotiation — Resolve objections, terms, and procurement requirements.
- Close — Sign, then trigger the handoff to onboarding and customer success.
Each stage flows into the next only when its exit criterion is met. The numbered list above is the skeleton; the exit criteria below are the muscle.
What are the exit criteria for each stage?#
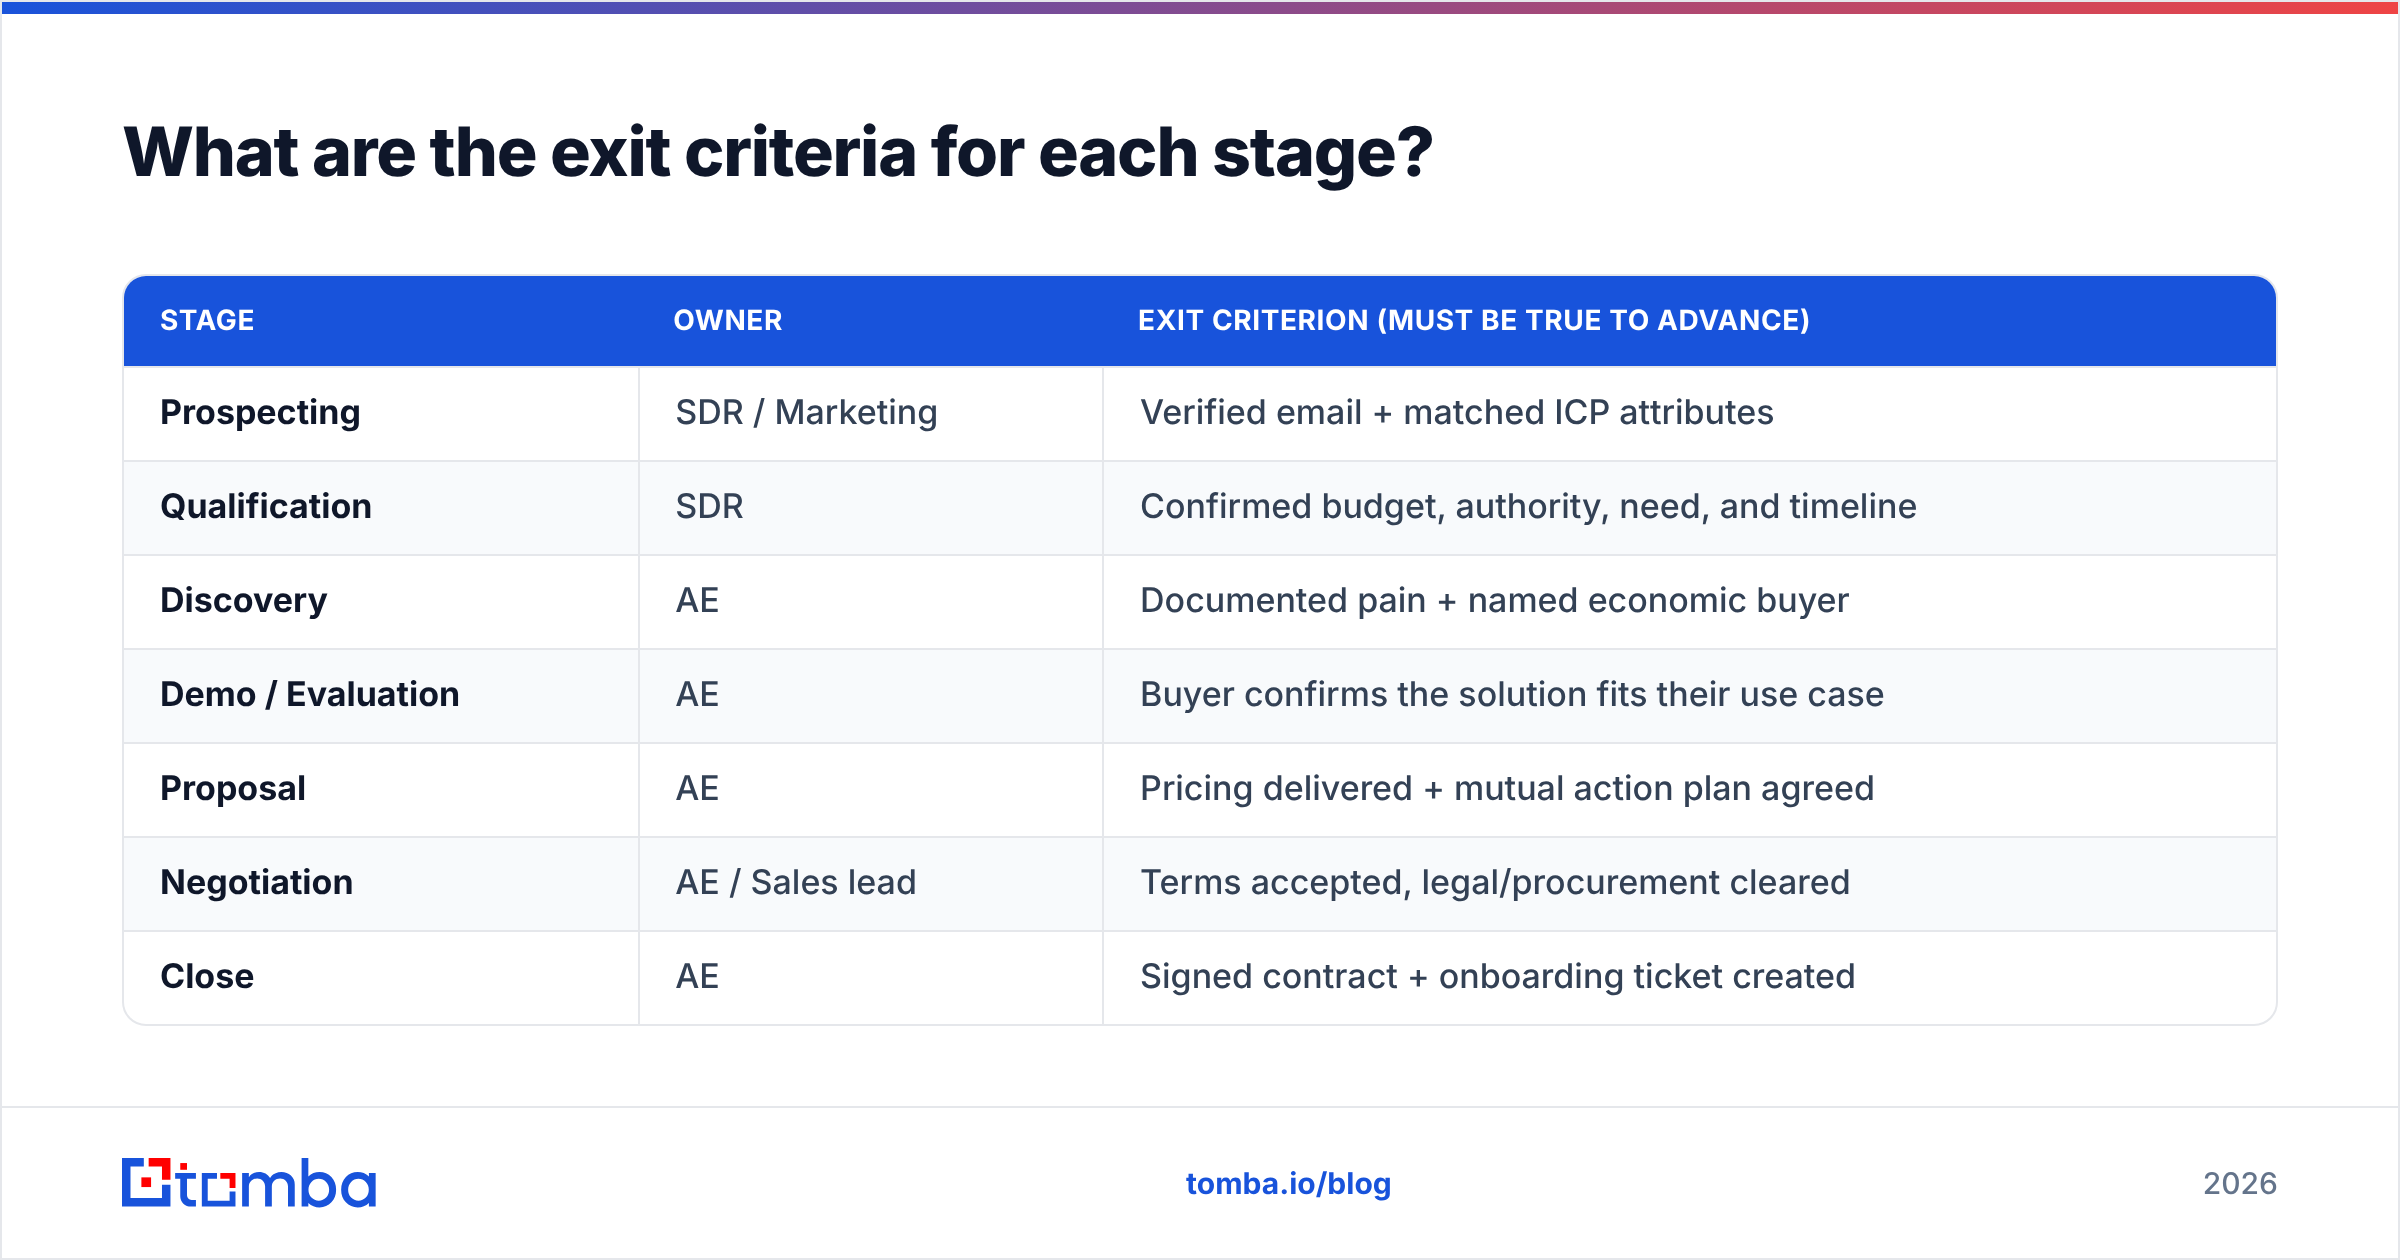
Exit criteria are the single most important part of any flowchart, and the part most teams skip. An exit criterion is the one fact that must be true before a deal advances. If you can't check it off, the deal stays put.
| Stage | Owner | Exit criterion (must be true to advance) |
|---|---|---|
| Prospecting | SDR / Marketing | Verified email + matched ICP attributes |
| Qualification | SDR | Confirmed budget, authority, need, and timeline |
| Discovery | AE | Documented pain + named economic buyer |
| Demo / Evaluation | AE | Buyer confirms the solution fits their use case |
| Proposal | AE | Pricing delivered + mutual action plan agreed |
| Negotiation | AE / Sales lead | Terms accepted, legal/procurement cleared |
| Close | AE | Signed contract + onboarding ticket created |
Notice the pattern: every criterion is binary. "Buyer seems interested" is not a criterion. "Buyer confirmed they have budget approved this quarter" is. When criteria are checkable, your CRM stages stop lying to your forecast.
This is also where a clean CRM earns its keep. Encode each exit criterion as a required field, and reps physically cannot drag a deal to the next stage until the field is filled.
How do you build the flowchart, step by step?#
Start with the deals you already won, not a blank canvas. Reverse-engineering your best closes tells you what your real process is, versus the idealized one in a sales playbook nobody reads.
Step 1 — Pull your last 20 closed-won deals. Map the actual touchpoints: when did the first reply come, who got looped in, what triggered the demo. Patterns emerge fast.
Step 2 — Name your stages. Use the seven above as a default, then cut or merge to fit your motion. A transactional SMB deal might collapse discovery and demo into one call. An enterprise deal might split negotiation into "business terms" and "legal."
Step 3 — Write one exit criterion per stage. Force yourself to a single, binary check. If you list three, pick the one that best predicts the deal advancing.
Step 4 — Assign an owner to every box and every arrow. The arrows — the handoffs — are where deals die. An SDR-to-AE handoff with no owner is a deal sitting in limbo.
Step 5 — Instrument it. Map each stage to a CRM pipeline stage and each criterion to a required field. Now the flowchart isn't a poster on the wall; it's the system reps work inside every day.
Which tools power each stage of the flowchart?#
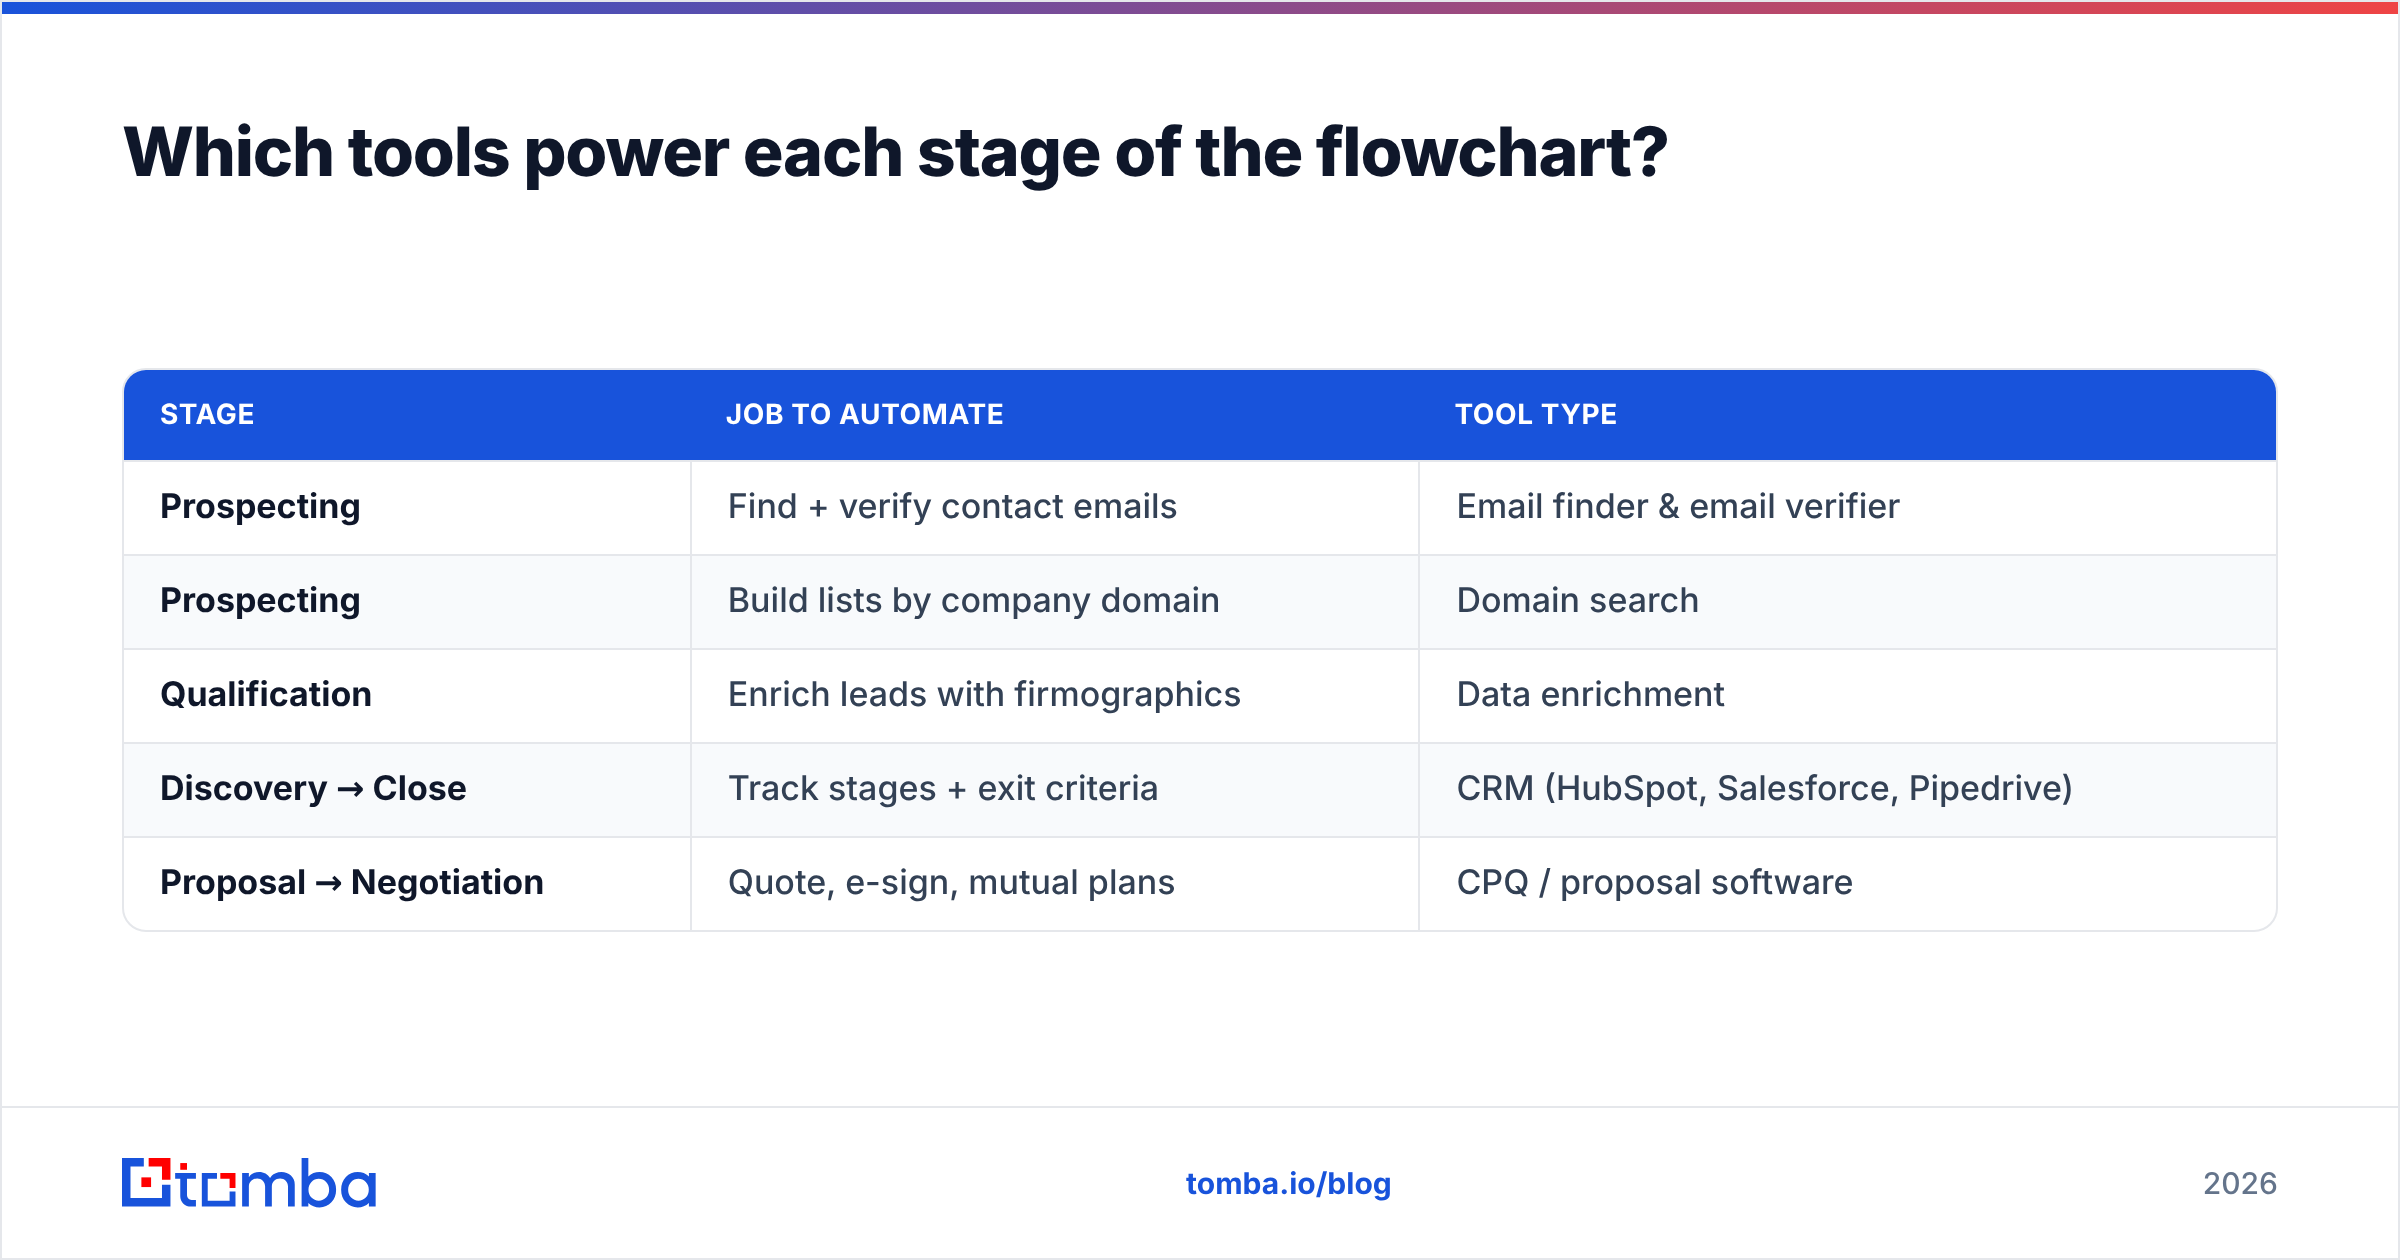
The flowchart describes the path; tools remove the friction along it. Here's where automation pays off the most, mapped to the stages it serves:
| Stage | Job to automate | Tool type |
|---|---|---|
| Prospecting | Find + verify contact emails | Email finder & email verifier |
| Prospecting | Build lists by company domain | Domain search |
| Qualification | Enrich leads with firmographics | Data enrichment |
| Discovery → Close | Track stages + exit criteria | CRM (HubSpot, Salesforce, Pipedrive) |
| Proposal → Negotiation | Quote, e-sign, mutual plans | CPQ / proposal software |
The top of the funnel is where bad data does the most damage, because every downstream stage inherits it. If a rep advances a deal built on a guessed email address, the bounce doesn't just cost one send — it poisons your sender reputation and skews every metric after it.

How is a B2B flowchart different from a B2C one?#
A B2B sales process flowchart has more stages, longer arrows, and more owners than a B2C one — because B2B deals involve a buying committee, not a single shopper.
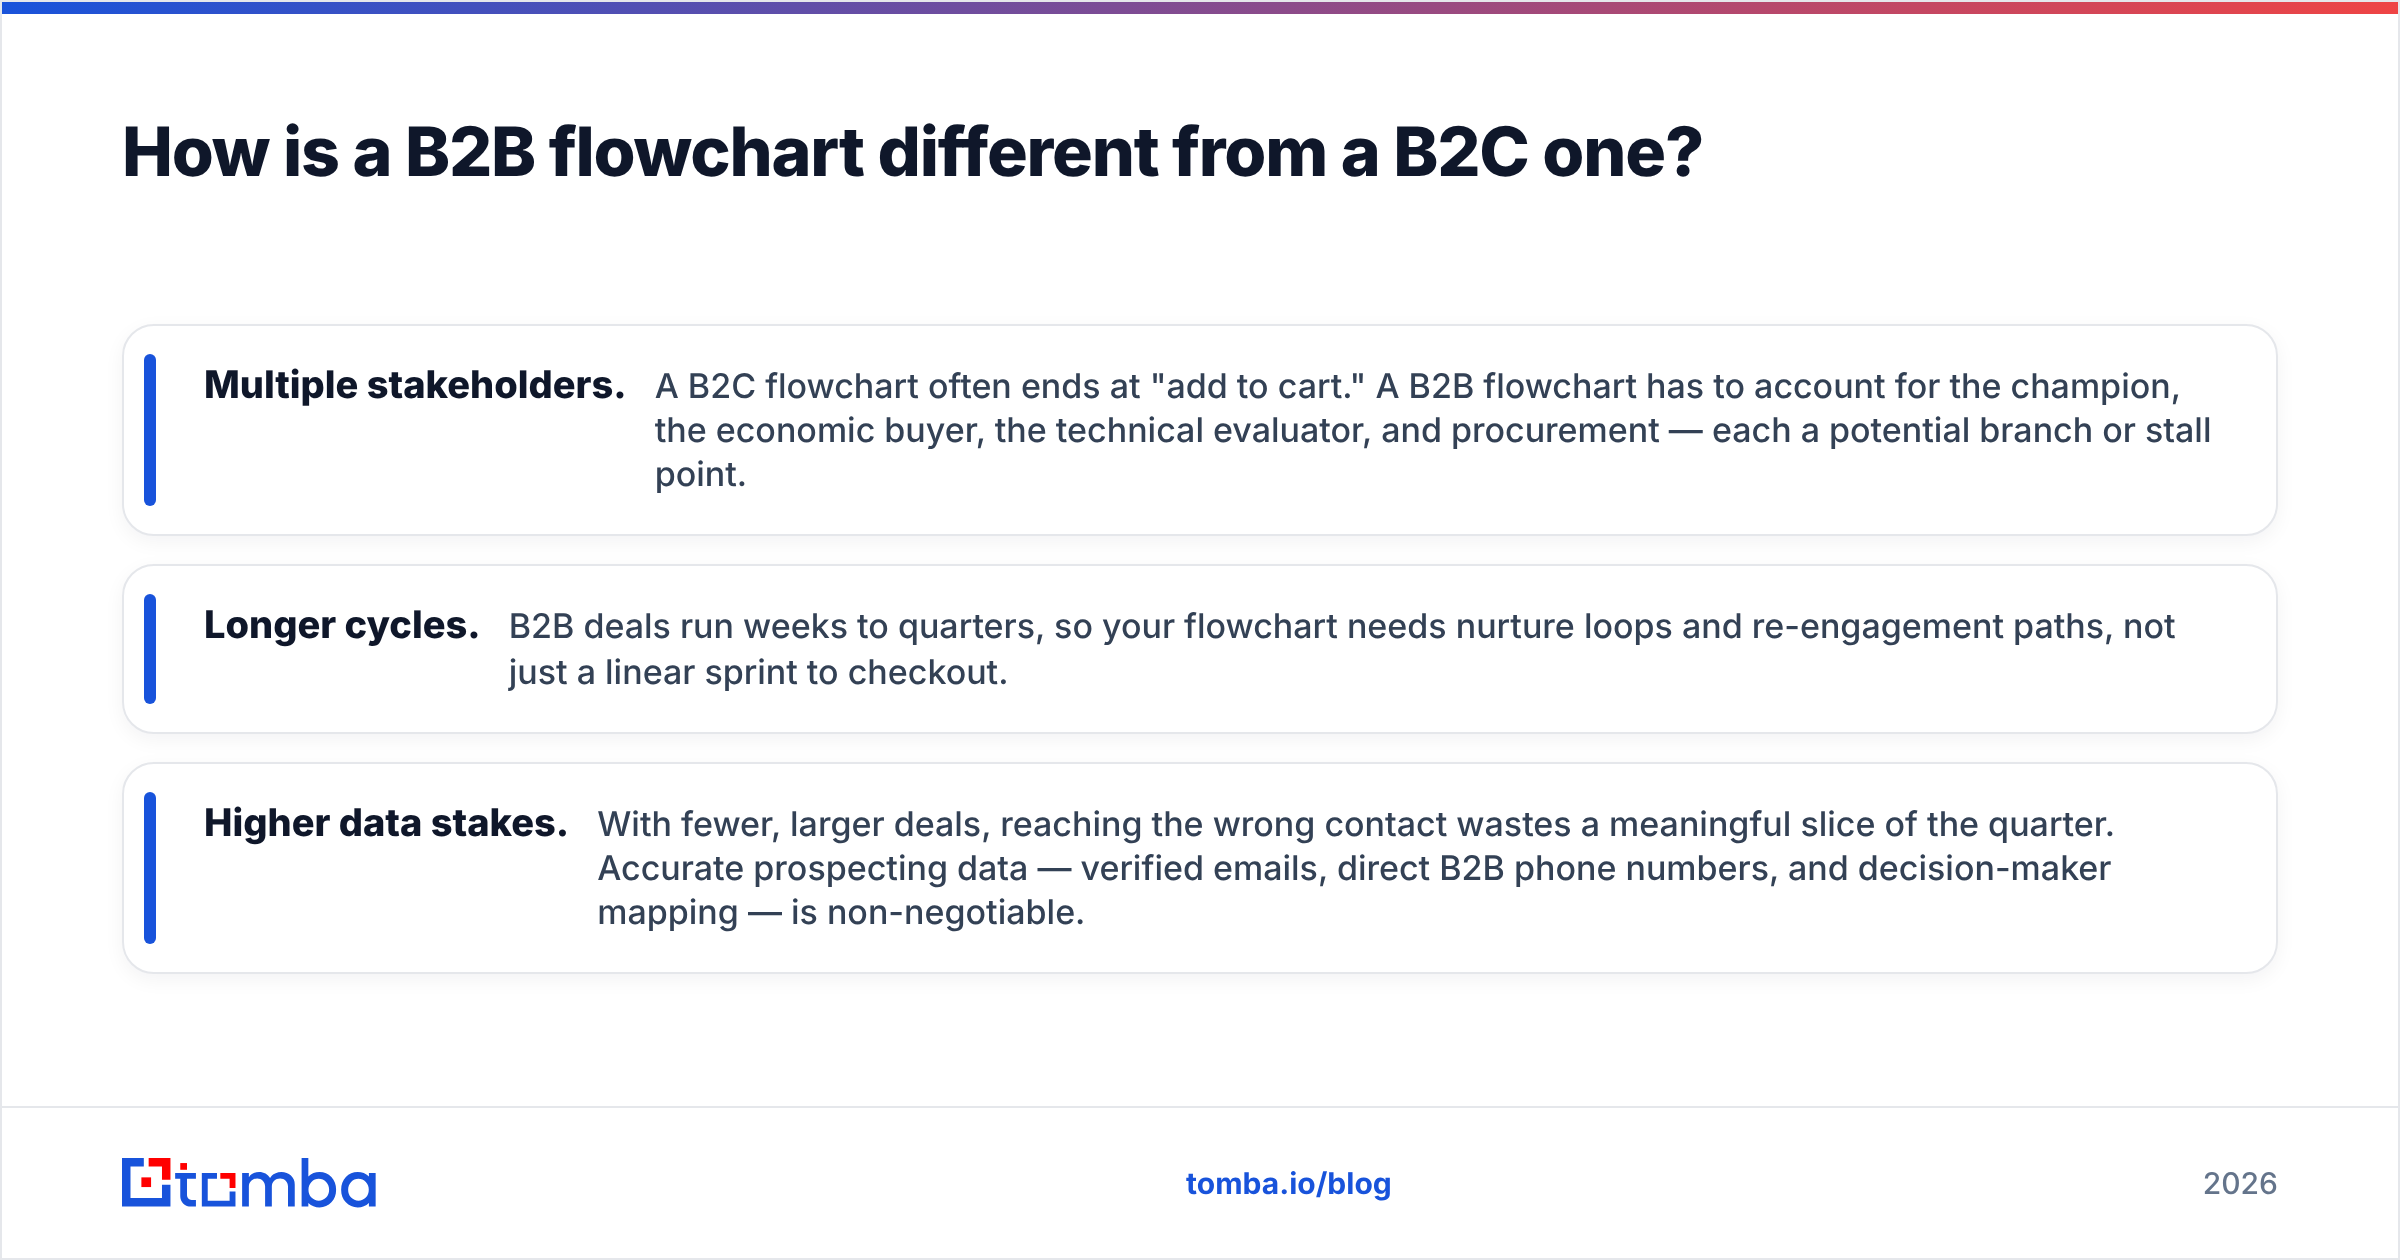
Three differences shape the diagram:
- Multiple stakeholders. A B2C flowchart often ends at "add to cart." A B2B flowchart has to account for the champion, the economic buyer, the technical evaluator, and procurement — each a potential branch or stall point.
- Longer cycles. B2B deals run weeks to quarters, so your flowchart needs nurture loops and re-engagement paths, not just a linear sprint to checkout.
- Higher data stakes. With fewer, larger deals, reaching the wrong contact wastes a meaningful slice of the quarter. Accurate prospecting data — verified emails, direct B2B phone numbers, and decision-maker mapping — is non-negotiable.
According to HubSpot's sales research, the gap between top-performing teams and the rest is rarely effort; it's process discipline. The flowchart is how that discipline gets enforced at scale.
What are the most common flowchart mistakes?#
Most broken flowcharts fail the same handful of ways. Check yours against these:
- Too many stages. If you have 11 stages, reps round to the nearest familiar one and your data blurs. Five to seven is the sweet spot for most teams.
- Vague exit criteria. "Customer is engaged" can't be checked. Rewrite every criterion until it's a yes/no fact.
- No disqualification path. A good flowchart sends deals out as readily as forward. Without an exit door, your pipeline fills with zombies that inflate the forecast and demoralize reps.
- Unowned handoffs. Every arrow between stages needs a name attached. The SDR-to-AE pass is the most common place deals vanish.
- Set and forget. A process tuned for 5 reps cracks at 25. Review the flowchart quarterly against fresh closed-won data.
You can validate your prospecting data quality before it ever hits the flowchart with a free email checker — a 30-second gate that keeps invalid contacts out of stage one.
How do you measure if the flowchart is working?#
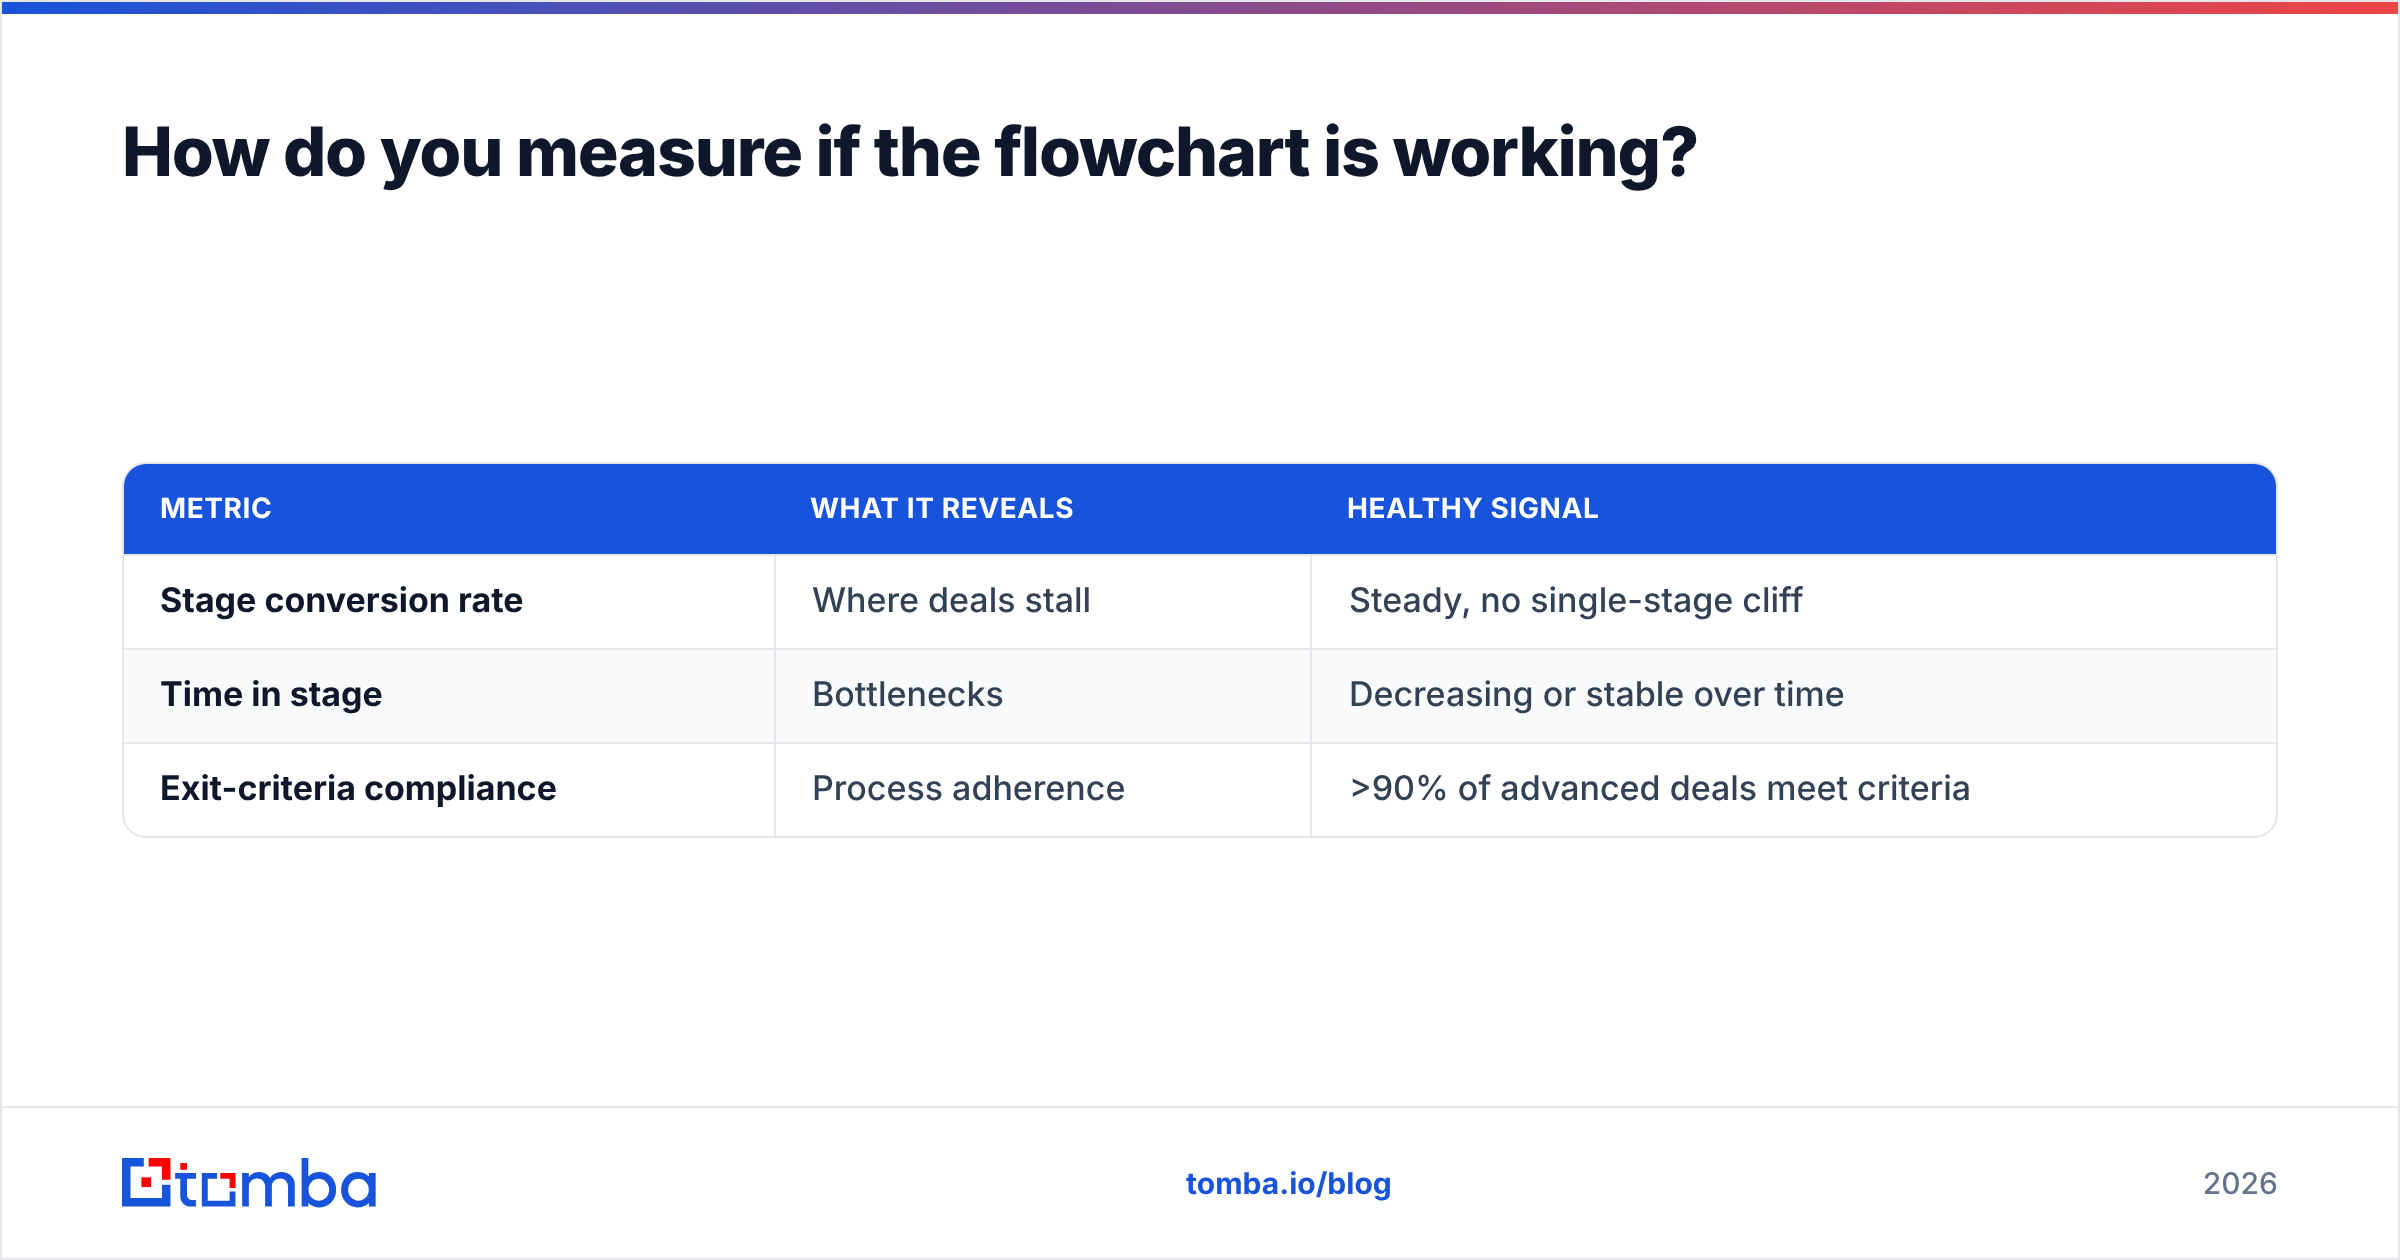
Track three numbers per stage and the flowchart tells you exactly where to fix.
| Metric | What it reveals | Healthy signal |
|---|---|---|
| Stage conversion rate | Where deals stall | Steady, no single-stage cliff |
| Time in stage | Bottlenecks | Decreasing or stable over time |
| Exit-criteria compliance | Process adherence | >90% of advanced deals meet criteria |
If one stage shows a conversion cliff — say, 60% of deals die between demo and proposal — your flowchart just earned its keep. That number is invisible without defined stages. With them, it's a flashing arrow pointing at the exact conversation that needs coaching.
Pair stage conversion with response rate at the top of the funnel, and you can trace a closed-won deal all the way back to the first verified email that started it.
Frequently asked questions#
How many stages should a B2B sales flowchart have? Five to seven for most teams. Fewer than five usually hides a real transition; more than seven creates stages reps can't distinguish, which corrupts your data. Start with seven and merge any two that always advance together.
What's the difference between a sales process and a sales methodology? The process is the what (the stages and exit criteria in your flowchart). The methodology — MEDDIC, SPIN, Challenger — is the how you execute within each stage. The flowchart is the map; the methodology is the driving technique.
Do small teams need a flowchart? Yes, earlier than you'd think. A documented flowchart is how a 3-person team onboards its 4th rep in days instead of months. The cost of building it is one afternoon; the cost of not having it compounds with every hire.
Where does prospecting data fit in? At stage one, and it determines everything downstream. A flowchart fed by unverified contacts wastes every later stage on deals that were never reachable. Verified emails and enriched firmographics are the fuel the whole diagram runs on.
Build the engine behind stage one#
A flowchart only moves as fast as the leads entering it. If stage one is fed by guessed emails and stale contact data, no amount of process discipline downstream will save your forecast.
That's where Tomba fits. The Tomba Email Finder sources verified professional emails by name, company, or domain, so your prospecting stage starts with contacts that actually reach a human — not a bounce. Pair it with the built-in email verifier and data enrichment, and every deal entering your B2B sales process flowchart starts on clean, reachable, ICP-matched data.
Start free with 25 searches a month, then scale on the Starter plan at $49/mo when your pipeline does — see full Tomba pricing for Growth and Pro tiers. Map your flowchart once, feed it clean data, and watch the forecast stop lying.
Ready to find emails that actually work?
Join 150,000+ professionals who stopped guessing and started sending. Free credits on signup — no credit card required.
Get the Tomba newsletter
Practical outbound tactics and product updates — once every two weeks.
About the author