Bottom-Up Forecasting: A Practical Playbook for 2026
Bottom-up forecasting builds revenue predictions from real pipeline data instead of executive guesses. Here's how to run it accurately in 2026.
TL;DR
- Bottom-up forecasting builds a revenue number from the ground up — individual deals, reps, and accounts — instead of slicing a market-size guess from the top down.
- It is more accurate for short- and mid-range planning because every input traces back to a real opportunity you can inspect.
- The method only works when your CRM data is clean: accurate contacts, verified emails, and complete account records.
- Top-down forecasting still has a place for board-level vision and brand-new markets where you have no pipeline history.
- The biggest failure point isn't the math — it's garbage input data. Fix enrichment first, then forecast.
What is bottom-up forecasting?#
Bottom-up forecasting is a revenue prediction method that starts with the smallest real units of your business — individual deals, reps, products, or accounts — and adds them up into a total. Instead of asking "the market is $4B, can we grab 2%?", you ask "Sarah has 14 open deals worth $320K at these probabilities, what closes this quarter?" and you do that for every rep.
Think of it like estimating how much a grocery run will cost. The top-down way is to guess "groceries are usually about $150." The bottom-up way is to walk the aisles, put real items in the cart, and add up the actual prices. The second number is almost always closer to what you pay at the register — because it's built from things that physically exist.
That's the whole appeal. A bottom up forecasting model is auditable. When the number looks wrong, you can drill into a specific deal and ask why. You can't do that with a market-share percentage pulled from a slide.

How is bottom-up different from top-down forecasting?#
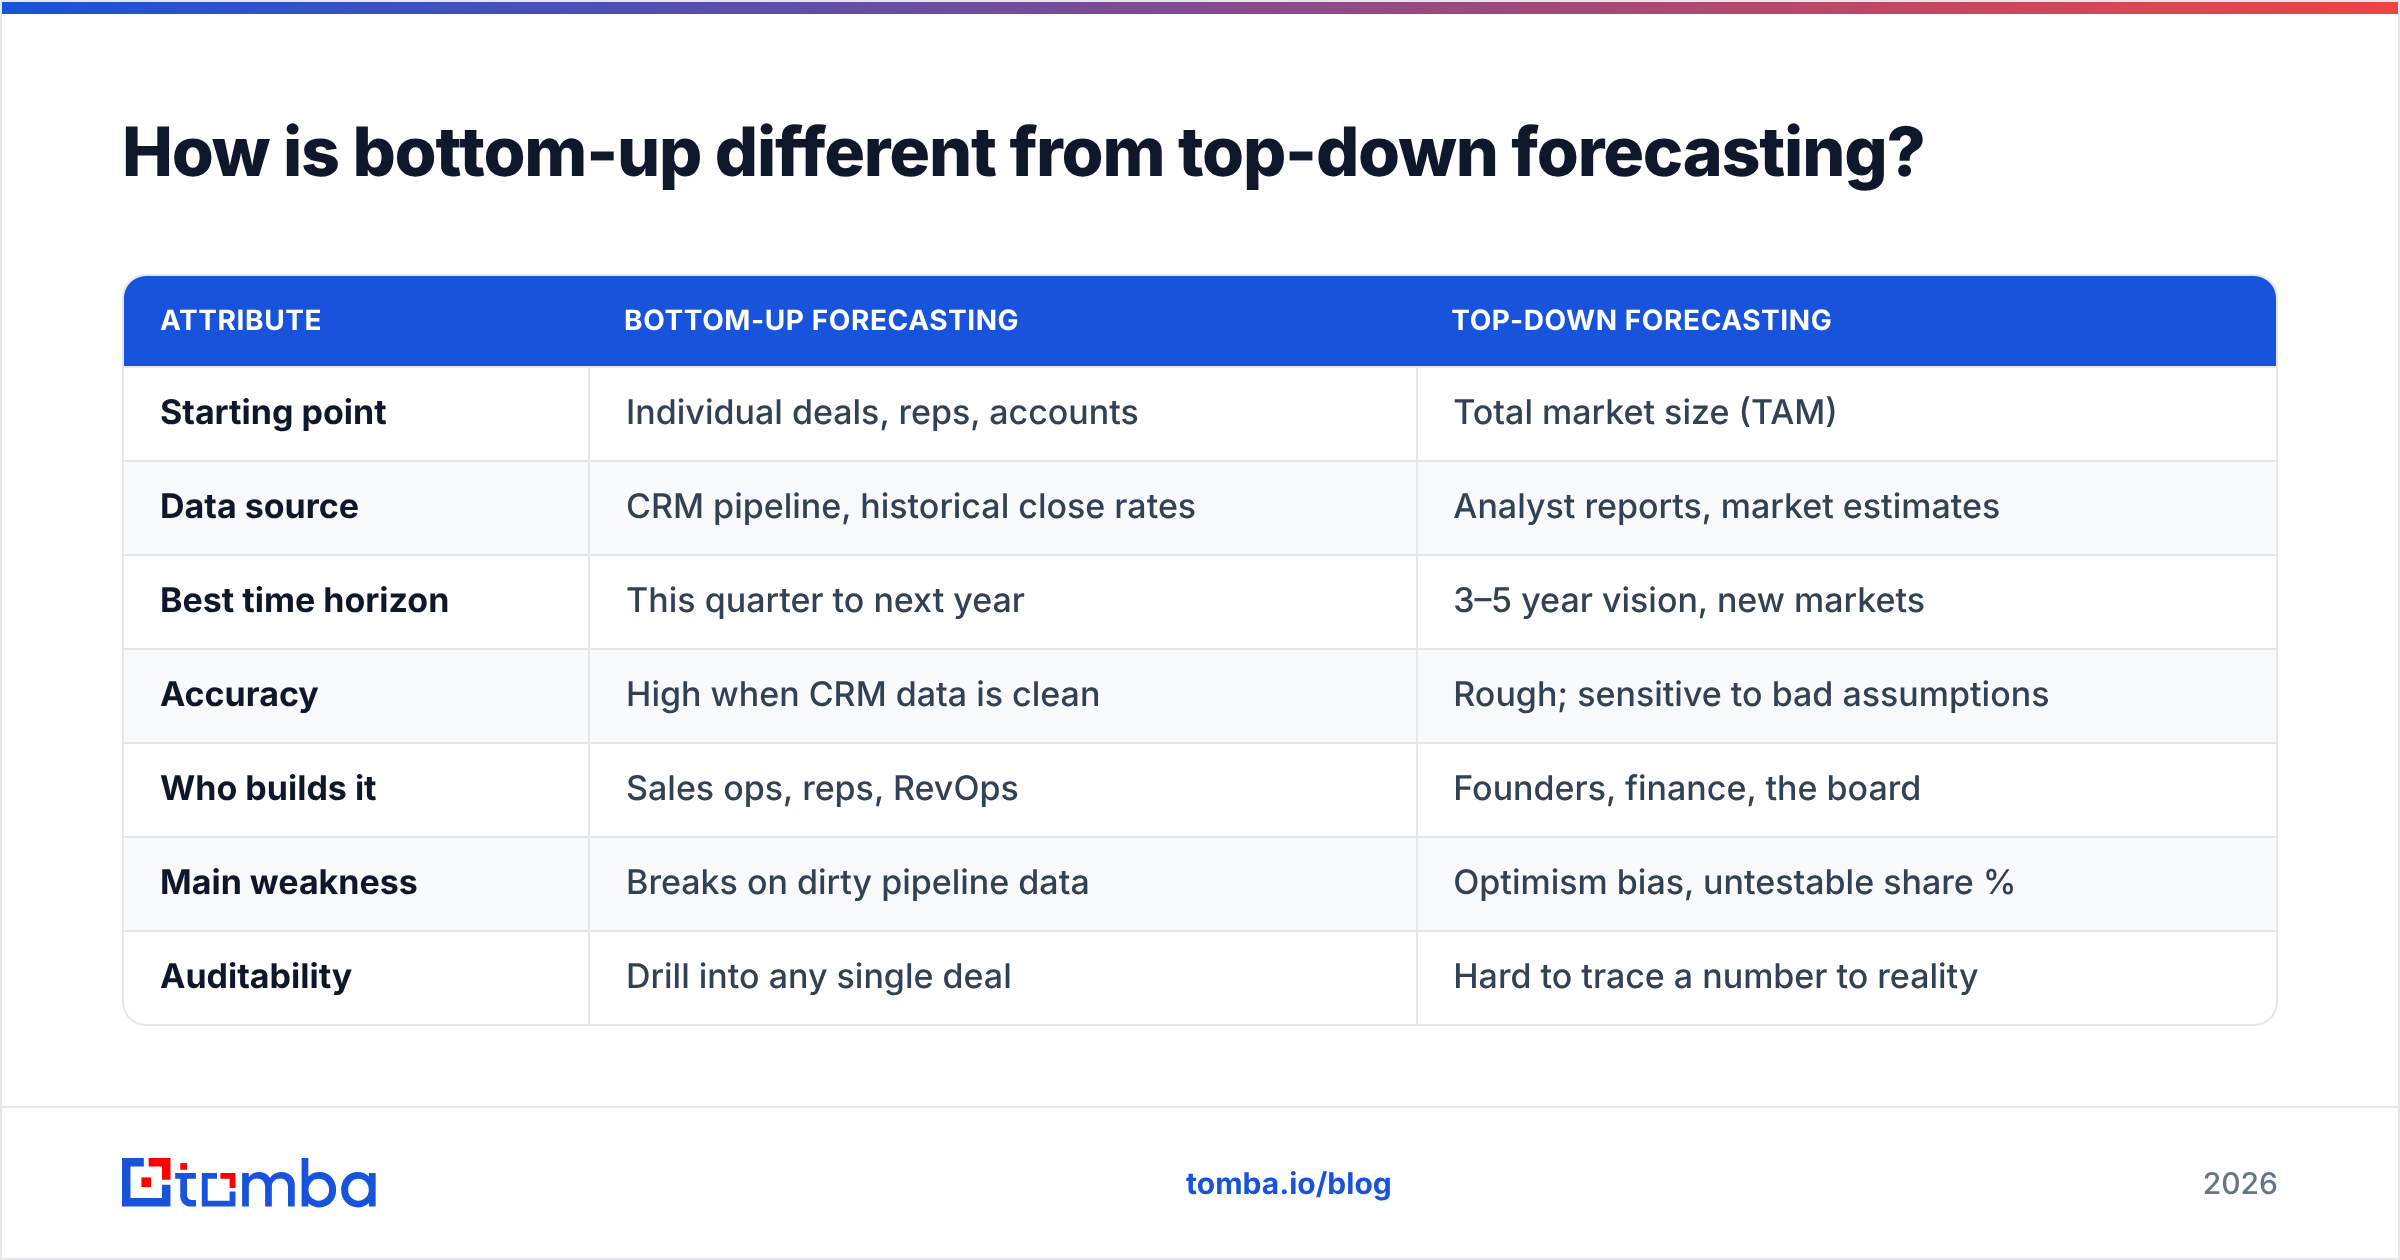
The two approaches answer the same question — "how much revenue will we make?" — from opposite directions. Top-down starts with a total addressable market and works down through market share. Bottom-up starts with line-item reality and works up.
| Attribute | Bottom-Up Forecasting | Top-Down Forecasting |
|---|---|---|
| Starting point | Individual deals, reps, accounts | Total market size (TAM) |
| Data source | CRM pipeline, historical close rates | Analyst reports, market estimates |
| Best time horizon | This quarter to next year | 3–5 year vision, new markets |
| Accuracy | High when CRM data is clean | Rough; sensitive to bad assumptions |
| Who builds it | Sales ops, reps, RevOps | Founders, finance, the board |
| Main weakness | Breaks on dirty pipeline data | Optimism bias, untestable share % |
| Auditability | Drill into any single deal | Hard to trace a number to reality |
Neither is "correct" in all cases. A Series A startup entering a brand-new category has no pipeline to count, so top-down is the only option. An established team with two years of CRM history should lean bottom-up because the inputs already exist. Most mature revenue orgs run both and reconcile the gap — if bottom-up says $2M and top-down says $5M, that delta is a conversation worth having before the quarter starts. Gartner and most enterprise sales leaders treat that reconciliation as a core forecasting discipline.
How do you build a bottom-up sales forecast?#
A reliable bottom-up forecast follows a repeatable sequence. Skip a step and the number gets soft.
- Inventory every open opportunity. Pull all active deals from your CRM with their stage, amount, owner, and expected close date. This is your raw material — and it's only as good as the data hygiene behind it.
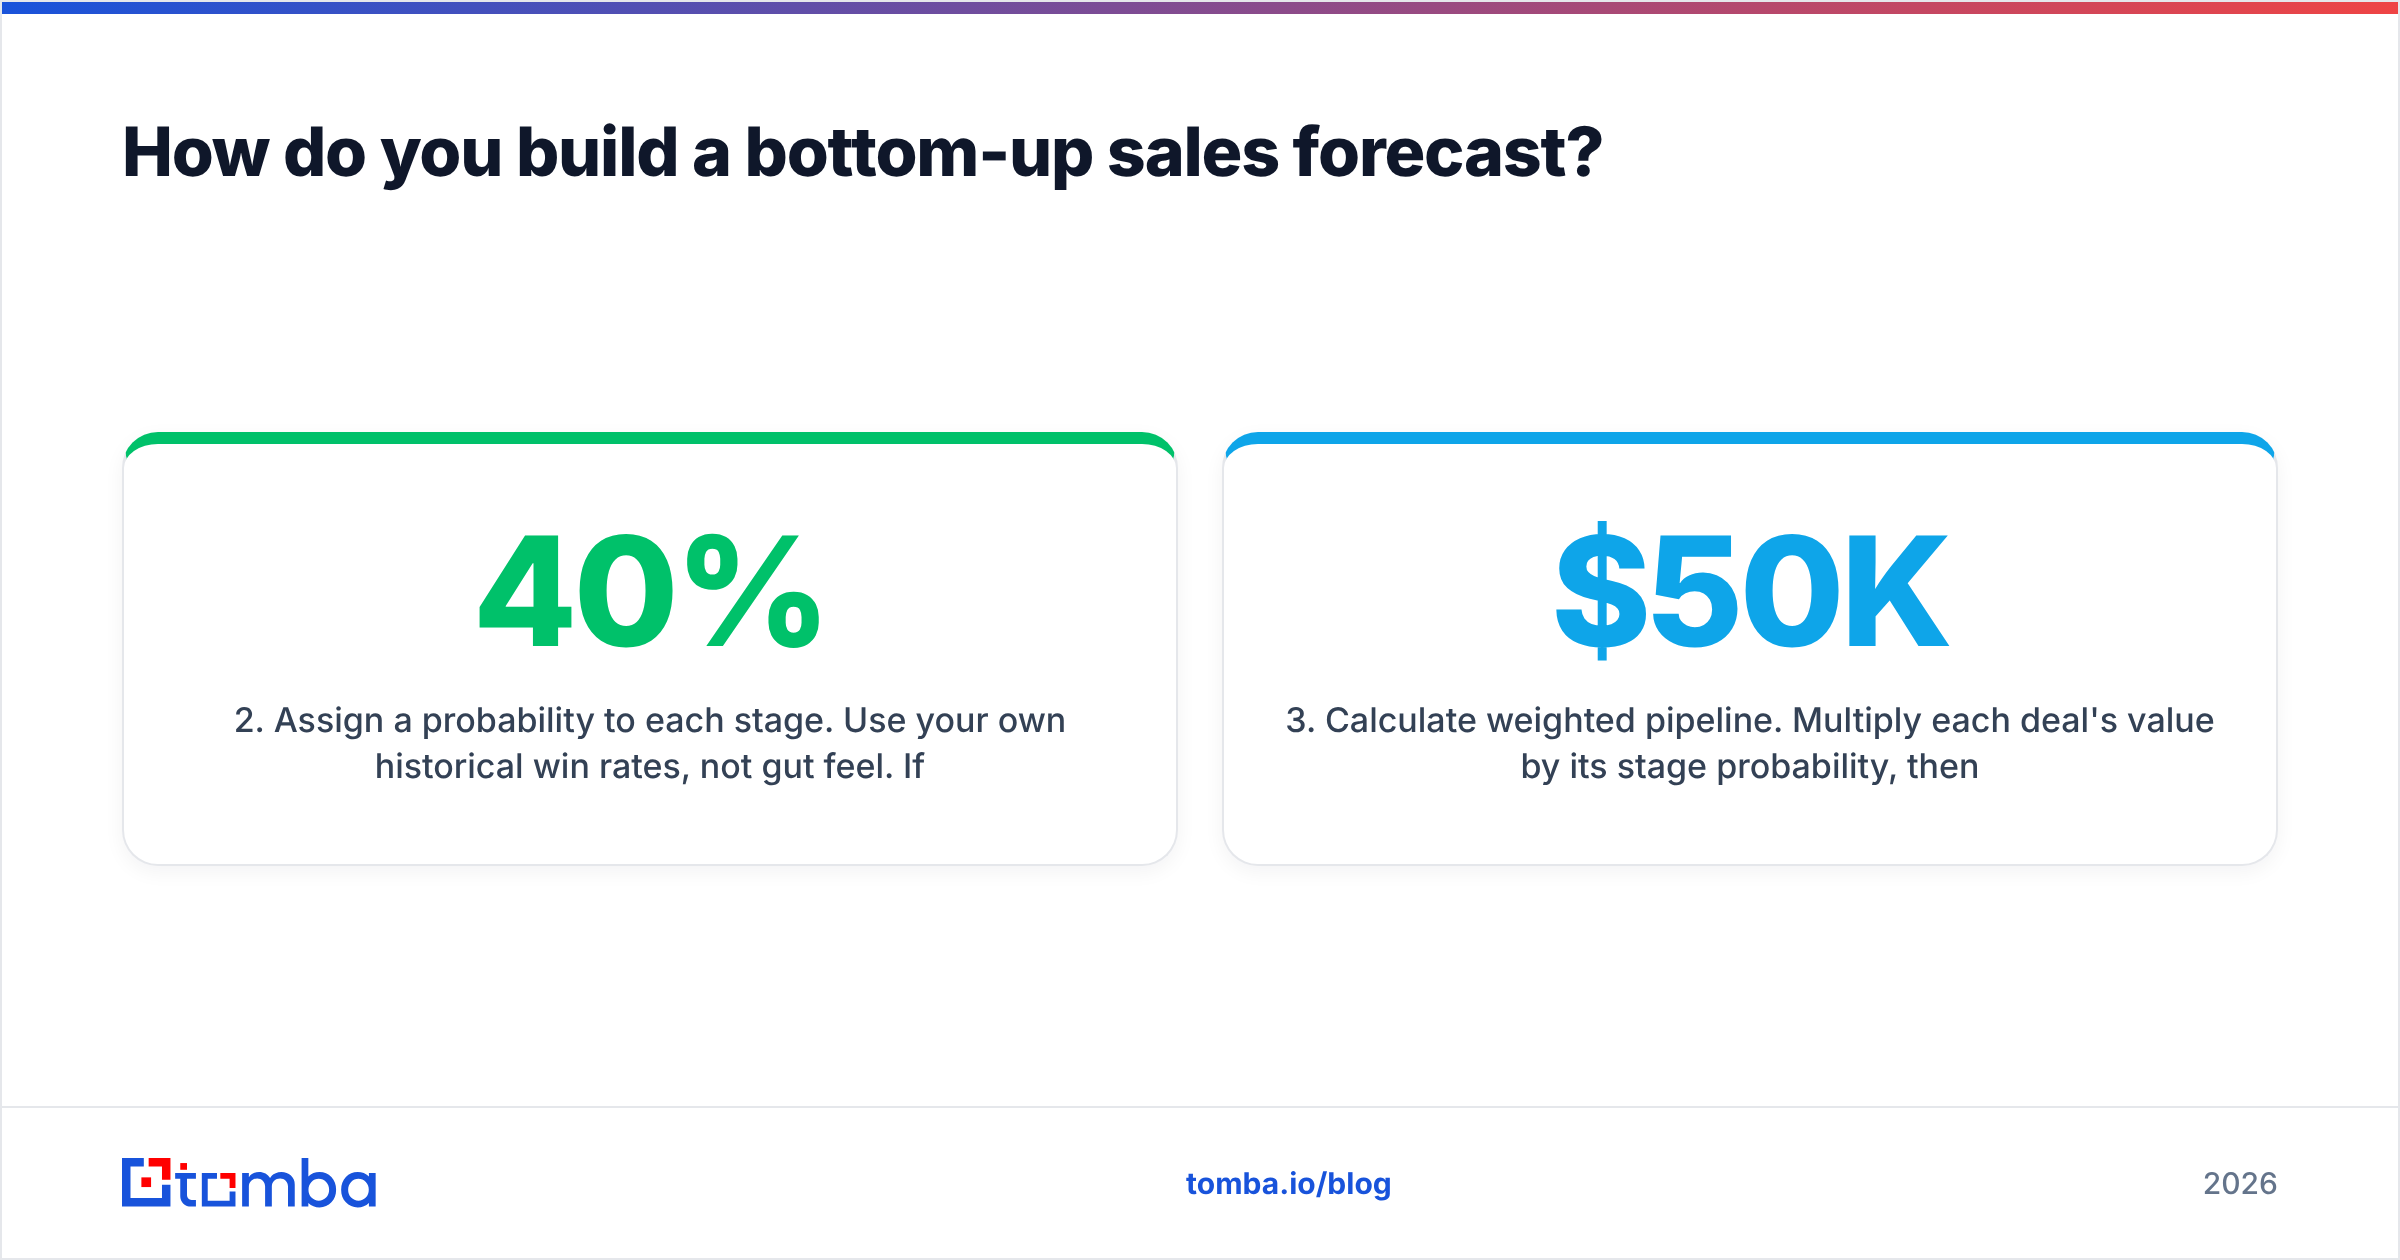
- Assign a probability to each stage. Use your own historical win rates, not gut feel. If deals at "Proposal Sent" close 40% of the time, that's your multiplier — not the 70% your optimistic AE wants.
- Calculate weighted pipeline. Multiply each deal's value by its stage probability, then sum. A $50K deal at 40% contributes $20K to the forecast.
- Layer in rep and segment reality. Adjust for ramp time, territory quality, and seasonality. A new rep's pipeline shouldn't be weighted like a veteran's.
- Add new-business assumptions. Forecast deals that aren't in the pipeline yet using your lead-to-deal conversion rate and current top-of-funnel volume.
- Reconcile and pressure-test. Compare the total against last quarter's actuals and your top-down number. Investigate any large gap before you commit.
The formula at the core of step 3 is simple:
Forecasted revenue = Σ (deal value × stage win probability)
The hard part was never the arithmetic. It's making sure the deals, contacts, and accounts feeding that sum are real and current.
Why does bottom-up forecasting fail in practice?#
Bottom-up forecasting fails when the underlying CRM data is wrong — full stop. The model assumes every deal points to a real company with a reachable buyer. When 30% of your contact records are stale, bounced, or duplicated, your "weighted pipeline" is weighting fiction.
Here are the failure modes that quietly wreck the number:
- Phantom pipeline. Deals tied to contacts who left the company months ago. The opportunity looks alive in the CRM; the buyer is gone.
- Duplicate accounts. The same logo entered three times inflates both pipeline value and apparent conversion rates.
- Unreachable decision-makers. Reps forecast deals they can't actually progress because they never had a verified email or direct line to the economic buyer.
- Missing firmographics. Without company size, industry, or revenue on the account, you can't segment probabilities correctly — so every deal gets the same naive multiplier.
This is why mature RevOps teams treat data quality as a prerequisite, not an afterthought. Clean, enriched records are the foundation the entire forecast sits on. You can enrich and deduplicate your pipeline with data enrichment before you ever open the forecasting spreadsheet, and verify that the contacts you're counting on are actually reachable using an email verifier.

What data do you need for an accurate bottom-up forecast?#
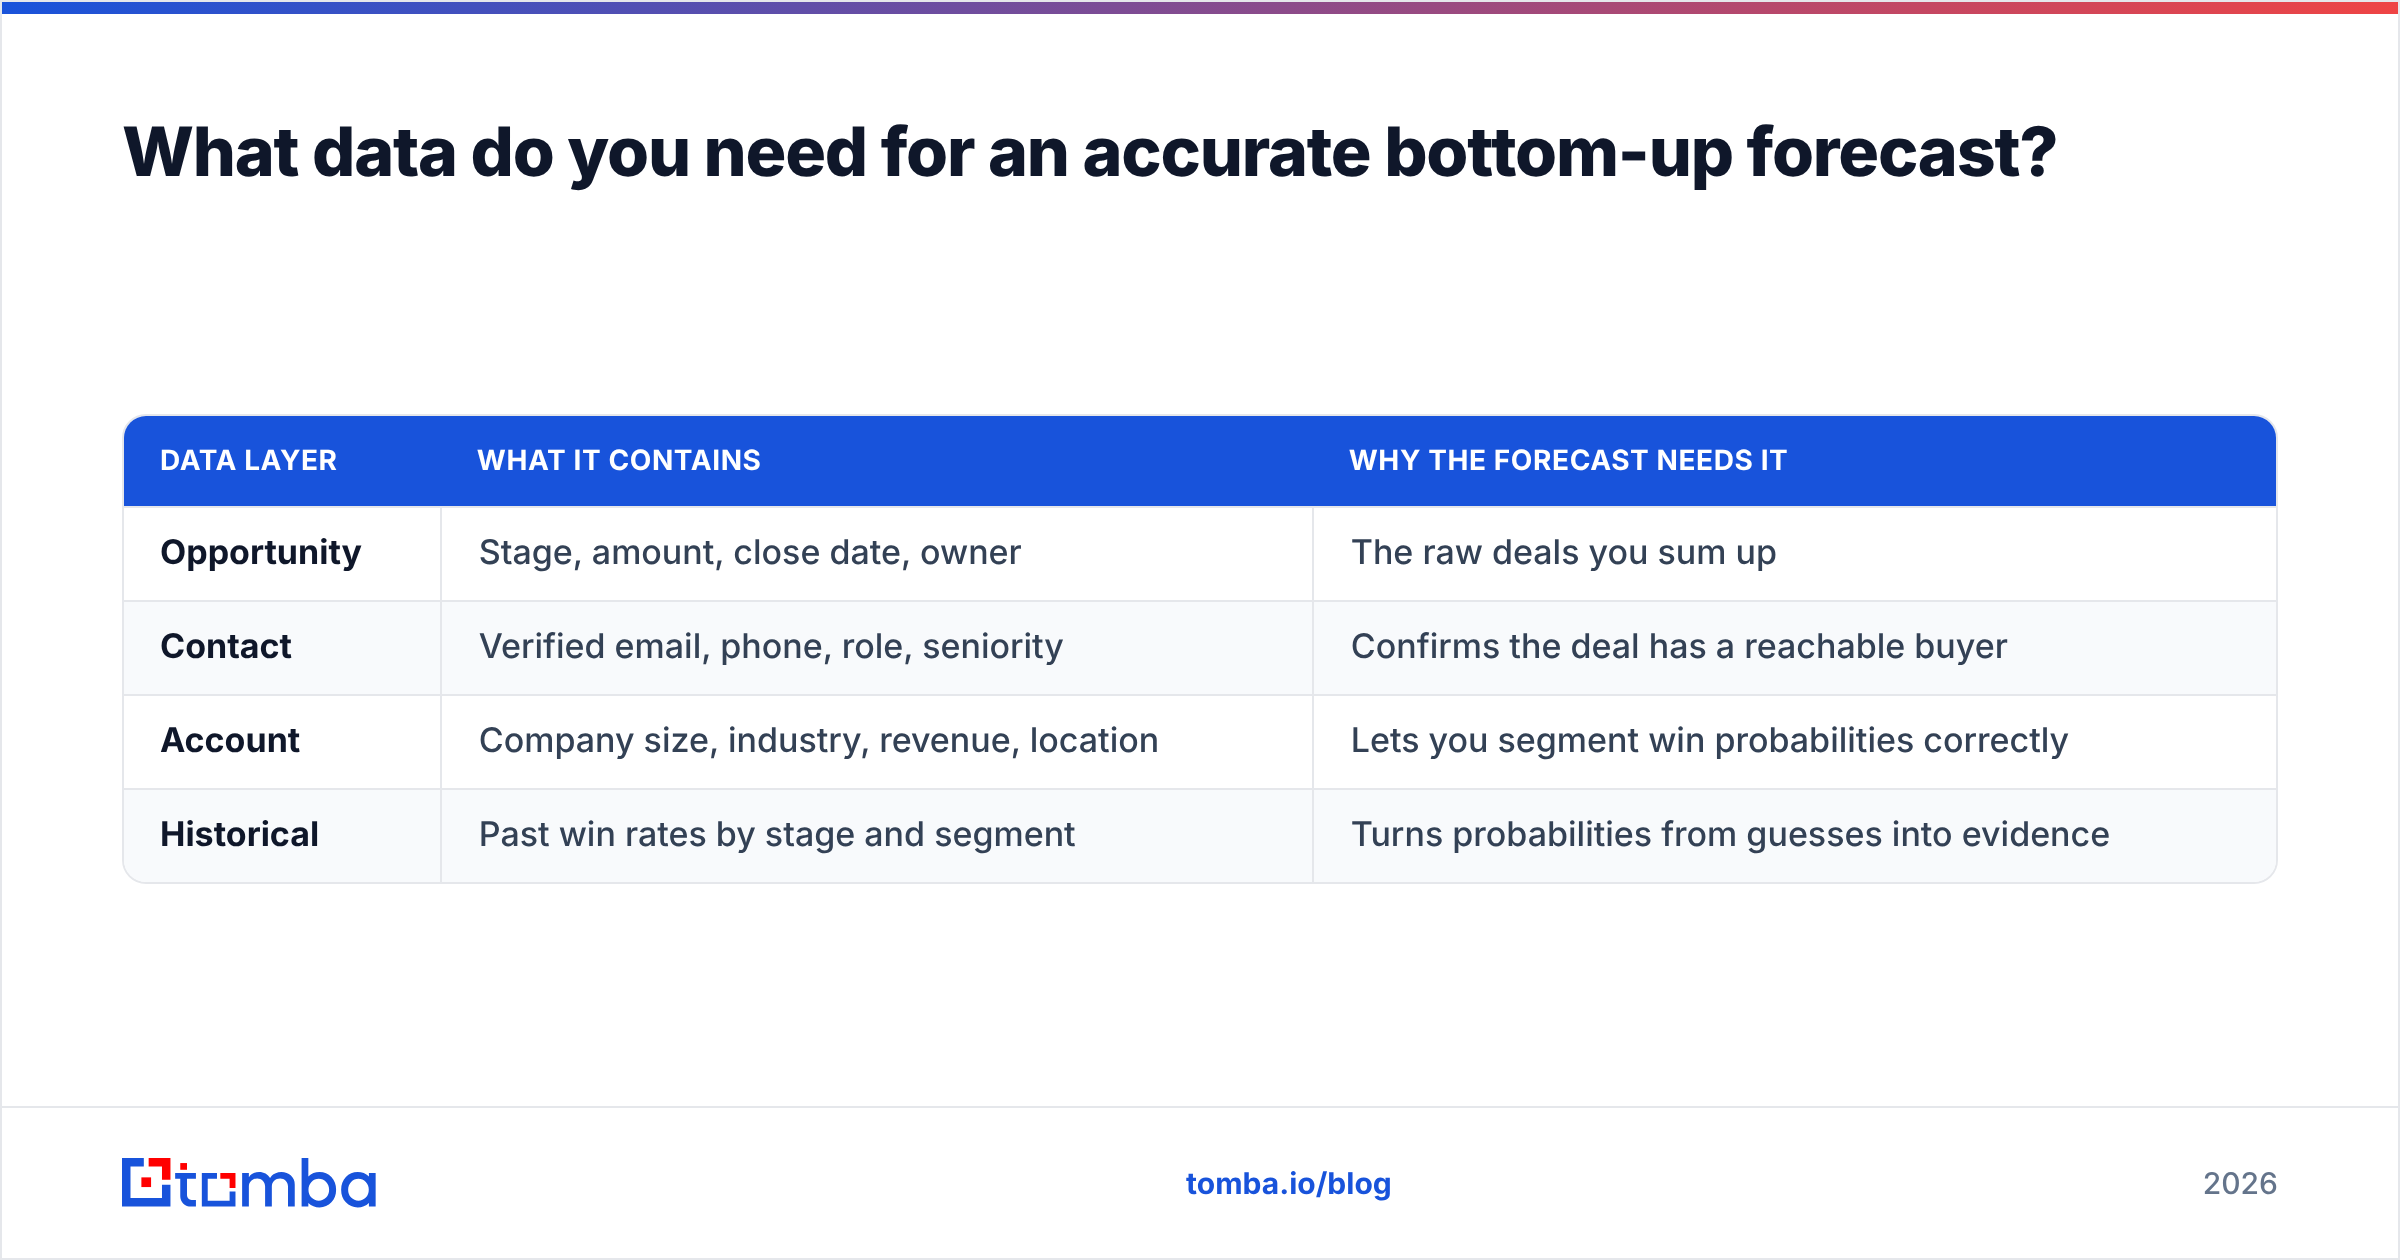
You need three layers of clean data: opportunity data, contact data, and account data. Most teams have the first, neglect the second, and ignore the third — which is exactly backwards from what accuracy requires.
| Data layer | What it contains | Why the forecast needs it |
|---|---|---|
| Opportunity | Stage, amount, close date, owner | The raw deals you sum up |
| Contact | Verified email, phone, role, seniority | Confirms the deal has a reachable buyer |
| Account | Company size, industry, revenue, location | Lets you segment win probabilities correctly |
| Historical | Past win rates by stage and segment | Turns probabilities from guesses into evidence |
The contact layer is where most pipelines rot. A deal "owned" by a champion who changed jobs is a deal that won't close, no matter what the CRM says. Keeping that layer fresh is an ongoing job: when a key contact disappears, you need to re-establish a line into the account fast. Tools like a domain search let you pull current verified contacts at a target company in seconds, so a forecasted deal doesn't quietly die because nobody noticed the buyer left.
For the account layer, firmographic enrichment matters more than people expect. A $50K deal at a 5,000-person enterprise and a $50K deal at a 12-person startup should not carry the same win probability — and you can only tell them apart if size and industry are populated on the record.
When should you use top-down instead?#
Use top-down forecasting when you have no pipeline to count. That's the honest dividing line.
Specifically, reach for top-down when you're:
- Entering a brand-new market where you have zero historical close data.
- Setting a long-range vision (3–5 years) for a board or investors, where deal-level precision is impossible anyway.
- Sizing an opportunity before you've built a sales motion — pre-revenue or early-stage, where TAM math is the only input available.
- Sanity-checking an aggressive bottom-up number against what the market could theoretically support.
Industry leaders like HubSpot and most modern sales orgs recommend running both methods in parallel for established businesses. Bottom-up gives you the committable number for this quarter; top-down keeps leadership honest about the ceiling. The gap between them is signal, not noise — a persistent gap usually means either your pipeline is too thin to hit the vision, or your market assumptions are inflated.
How do you keep a bottom-up forecast accurate over time?#
Accuracy is a maintenance habit, not a one-time build. The forecast decays the moment your pipeline data goes stale, so the work is in keeping inputs fresh.
Three practices keep the number trustworthy:
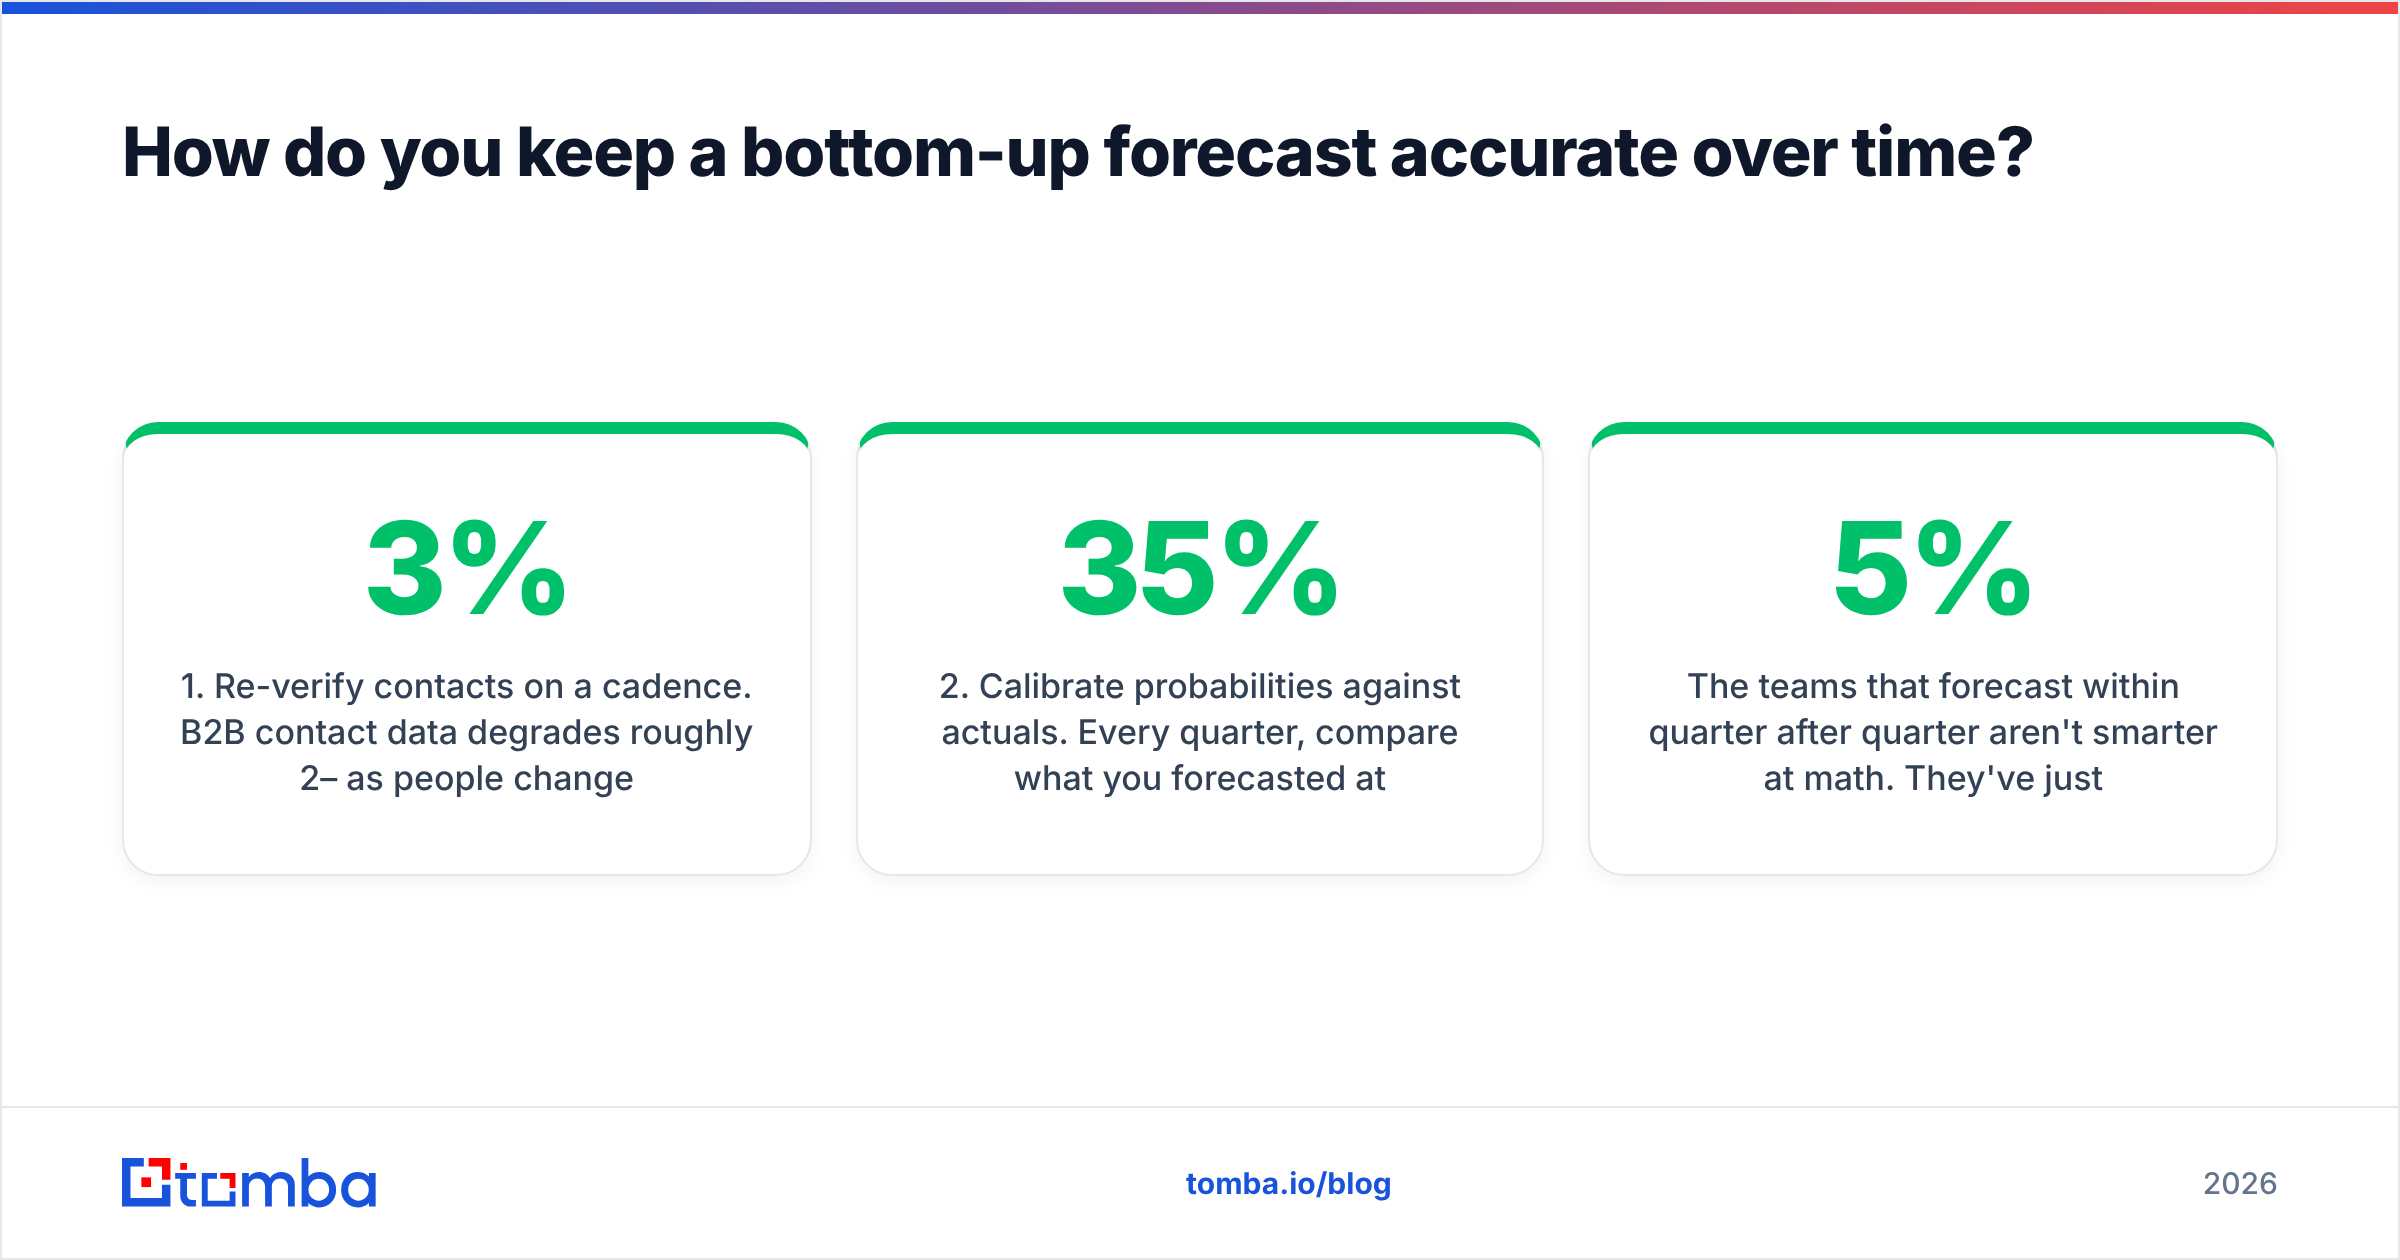
- Re-verify contacts on a cadence. B2B contact data degrades roughly 2–3% per month as people change jobs. A quarterly verification sweep keeps phantom deals out of the forecast. Running pipeline contacts through a bulk email finder catches the churn before it distorts the math.
- Calibrate probabilities against actuals. Every quarter, compare what you forecasted at each stage to what actually closed. Adjust the multipliers. Your "Proposal" stage might really be 35%, not the 50% you've been using.
- Audit for duplicates and dead accounts. Merge duplicate logos and archive accounts whose entire contact set has gone unreachable. Both inflate the forecast if left alone.
The teams that forecast within 5% quarter after quarter aren't smarter at math. They've just made data hygiene boring and routine — so the inputs are clean every single time they run the model.
The bottom line#
Bottom-up forecasting wins on accuracy because every number traces back to something real you can inspect, challenge, and fix. But that strength is also its dependency: the model is only as honest as the pipeline feeding it. Clean, verified, enriched contact and account data isn't a nice-to-have around forecasting — it is the forecast.
Before you build your next bottom-up model, make sure the deals you're counting point to real, reachable buyers. Tomba's Email Finder lets you find and verify professional email addresses by domain, name, or company — so your pipeline reflects people you can actually reach, not contacts who left six months ago. Start free with 25 searches a month, and check the Tomba pricing plans (Starter at $49/mo) when you're ready to clean an entire book of business. A forecast built on verified data is a forecast you can stand behind in the QBR.
// get started
Find, verify and enrich your first contacts today
Start on the free plan with 25 searches a month, then scale when your team is ready.
Free plan · No credit card required · GDPR & CCPA
// about the author