Bottom-Up Revenue Forecasting: A 2026 Playbook for GTM Teams
Top-down targets sound great until they miss by 40%. Bottom-up revenue forecasting builds your number from actual pipeline, deal by deal. Here's how to do it right in 2026.
Most forecasts miss because they start from a wish, not a number. A board says "we'll do $20M next year," that figure trickles down to regions, then to reps, and by Q3 nobody can explain why the model and reality have drifted 40% apart. Bottom-up revenue forecasting flips the direction: you build the company number from the smallest real units of demand you have — accounts, opportunities, and signed contracts — and roll it up.
This guide breaks down what bottom-up forecasting is, when to use it, the exact formulas, and how to keep the inputs clean enough that the output is worth trusting.
TL;DR#
- Bottom-up revenue forecasting builds your total from granular inputs (deals, accounts, units sold) rolled up — instead of dividing a top-line goal downward.
- It's more accurate for short- and mid-term planning because every dollar traces to a real pipeline record you can inspect.
- The core formula is leads × conversion rate × average deal size, refined by stage-weighted pipeline and historical win rates.
- Garbage inputs kill bottom-up models. Clean contact data, accurate deal stages, and verified accounts are non-negotiable.
- Pair bottom-up (operational accuracy) with a top-down sanity check (market ambition) — the gap between them is where your hardest GTM questions live.
What is bottom-up revenue forecasting?#
Bottom-up revenue forecasting estimates future revenue by summing individual, granular components — open deals, expected renewals, new pipeline, expansion — rather than starting from a market-size percentage and working down.
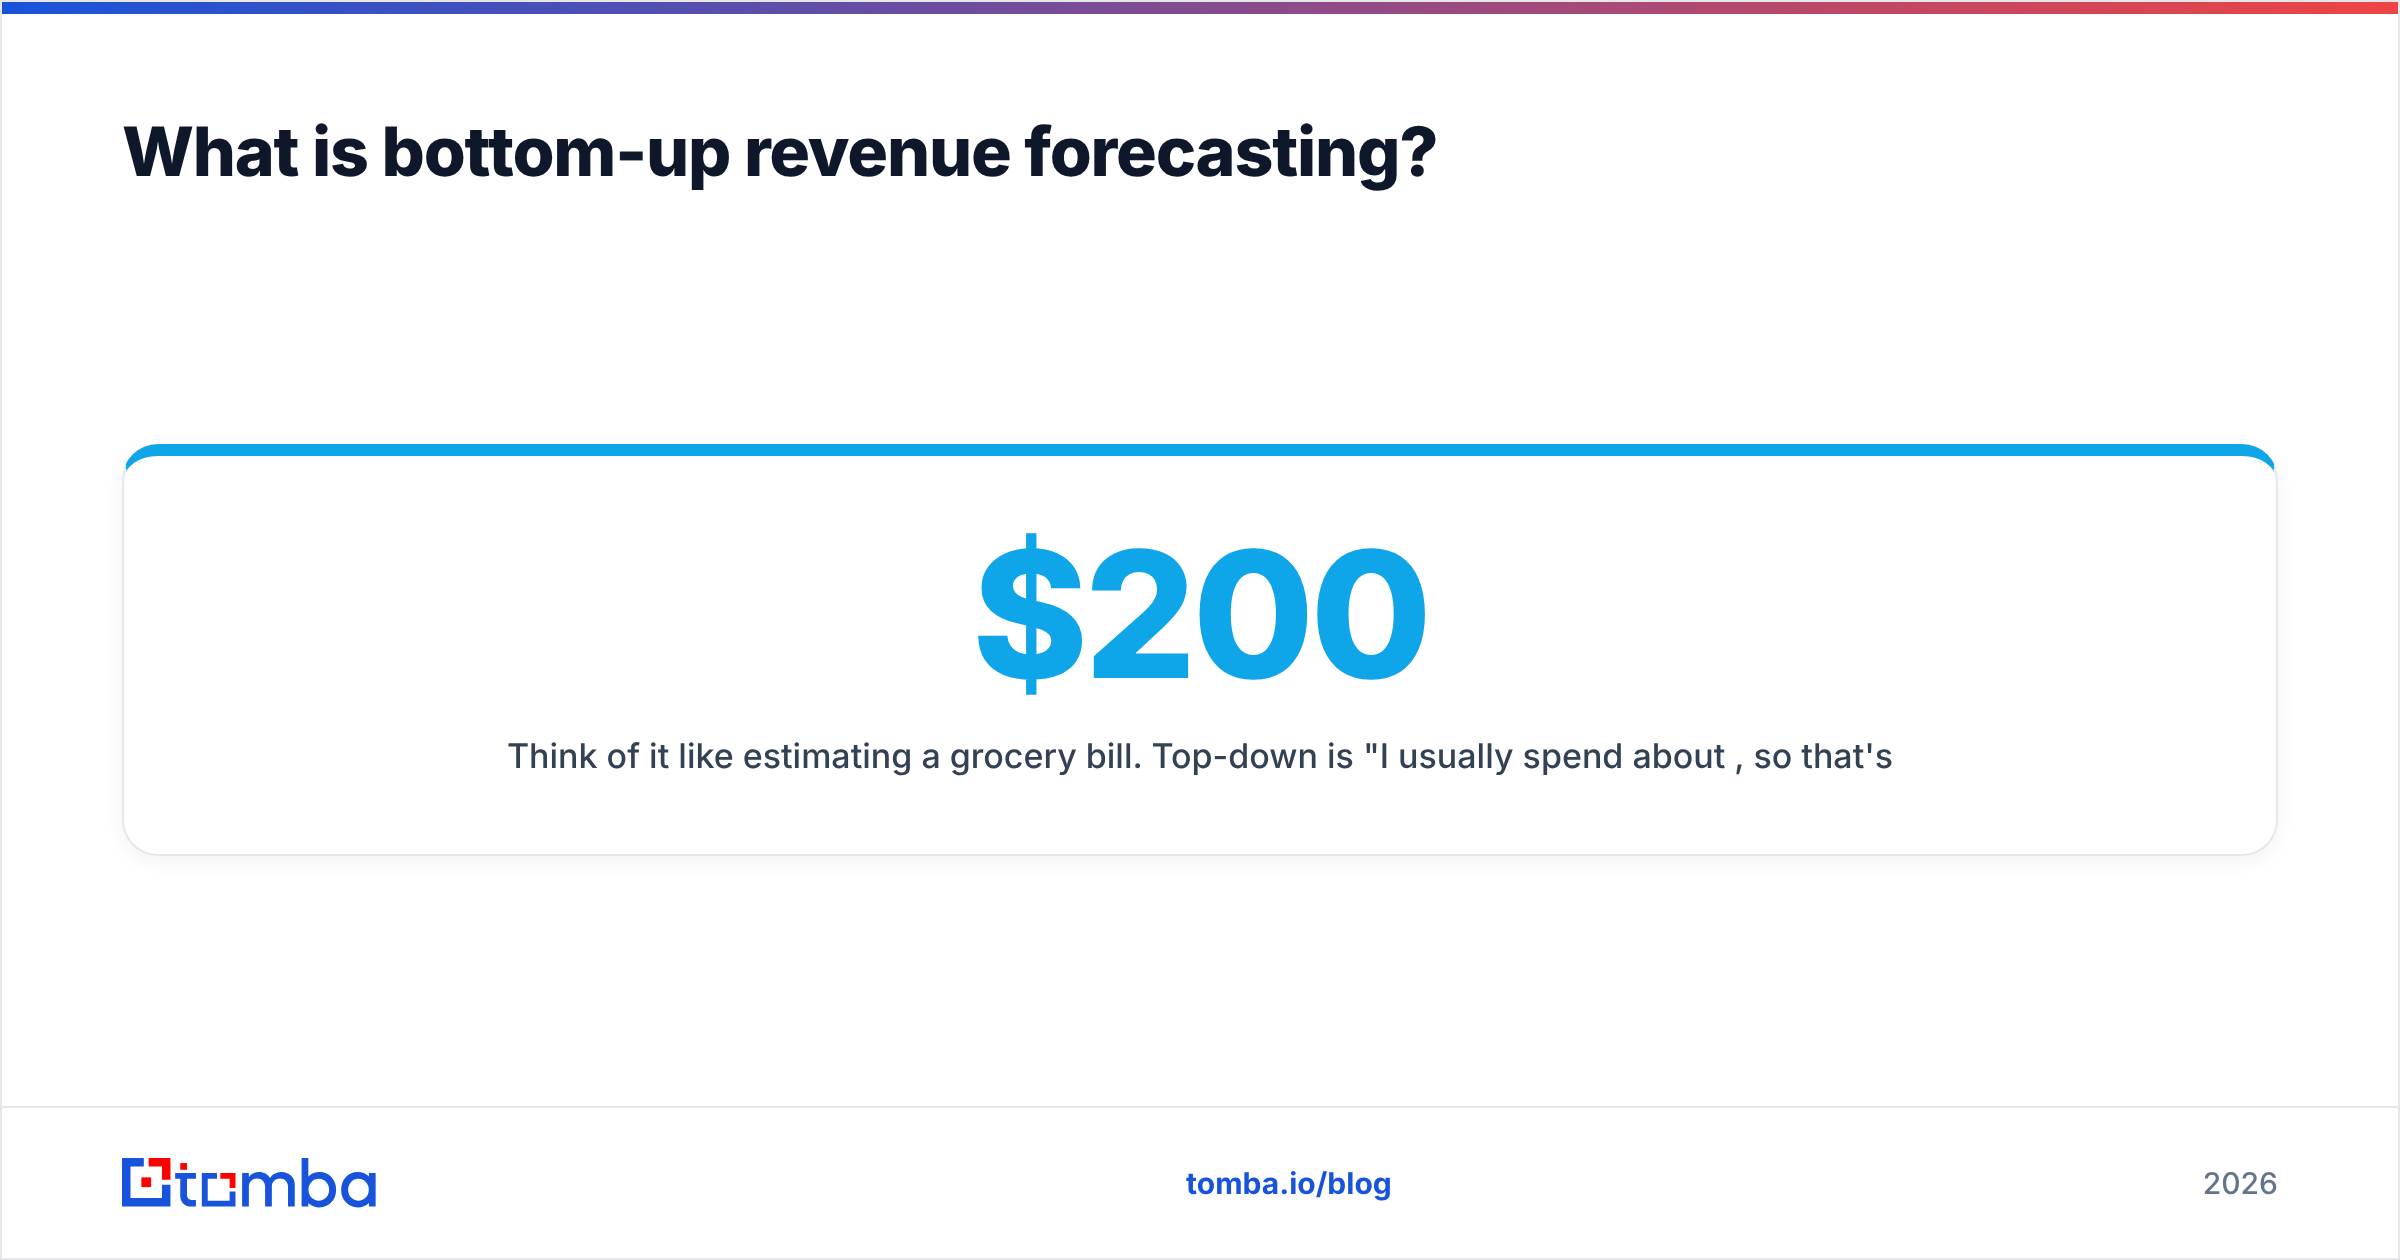
Think of it like estimating a grocery bill. Top-down is "I usually spend about $200, so that's my budget." Bottom-up is "milk $4, bread $3, coffee $14…" item by item until you reach a real total. The second method takes longer, but you can point at any line and explain it — and you notice immediately when something doesn't belong in the cart.
In revenue terms, the "items" are usually:
- Open opportunities weighted by stage or win probability.
- Recurring revenue from existing customers (the renewal base).
- Expansion / upsell expected from current accounts.
- New pipeline that hasn't been created yet but is implied by your lead volume and conversion math.
- Expected churn, subtracted.
Add those up, account by account, and you have a forecast you can defend in a board meeting because each number maps to a record in your CRM.

Bottom-up vs top-down forecasting: which is better?#
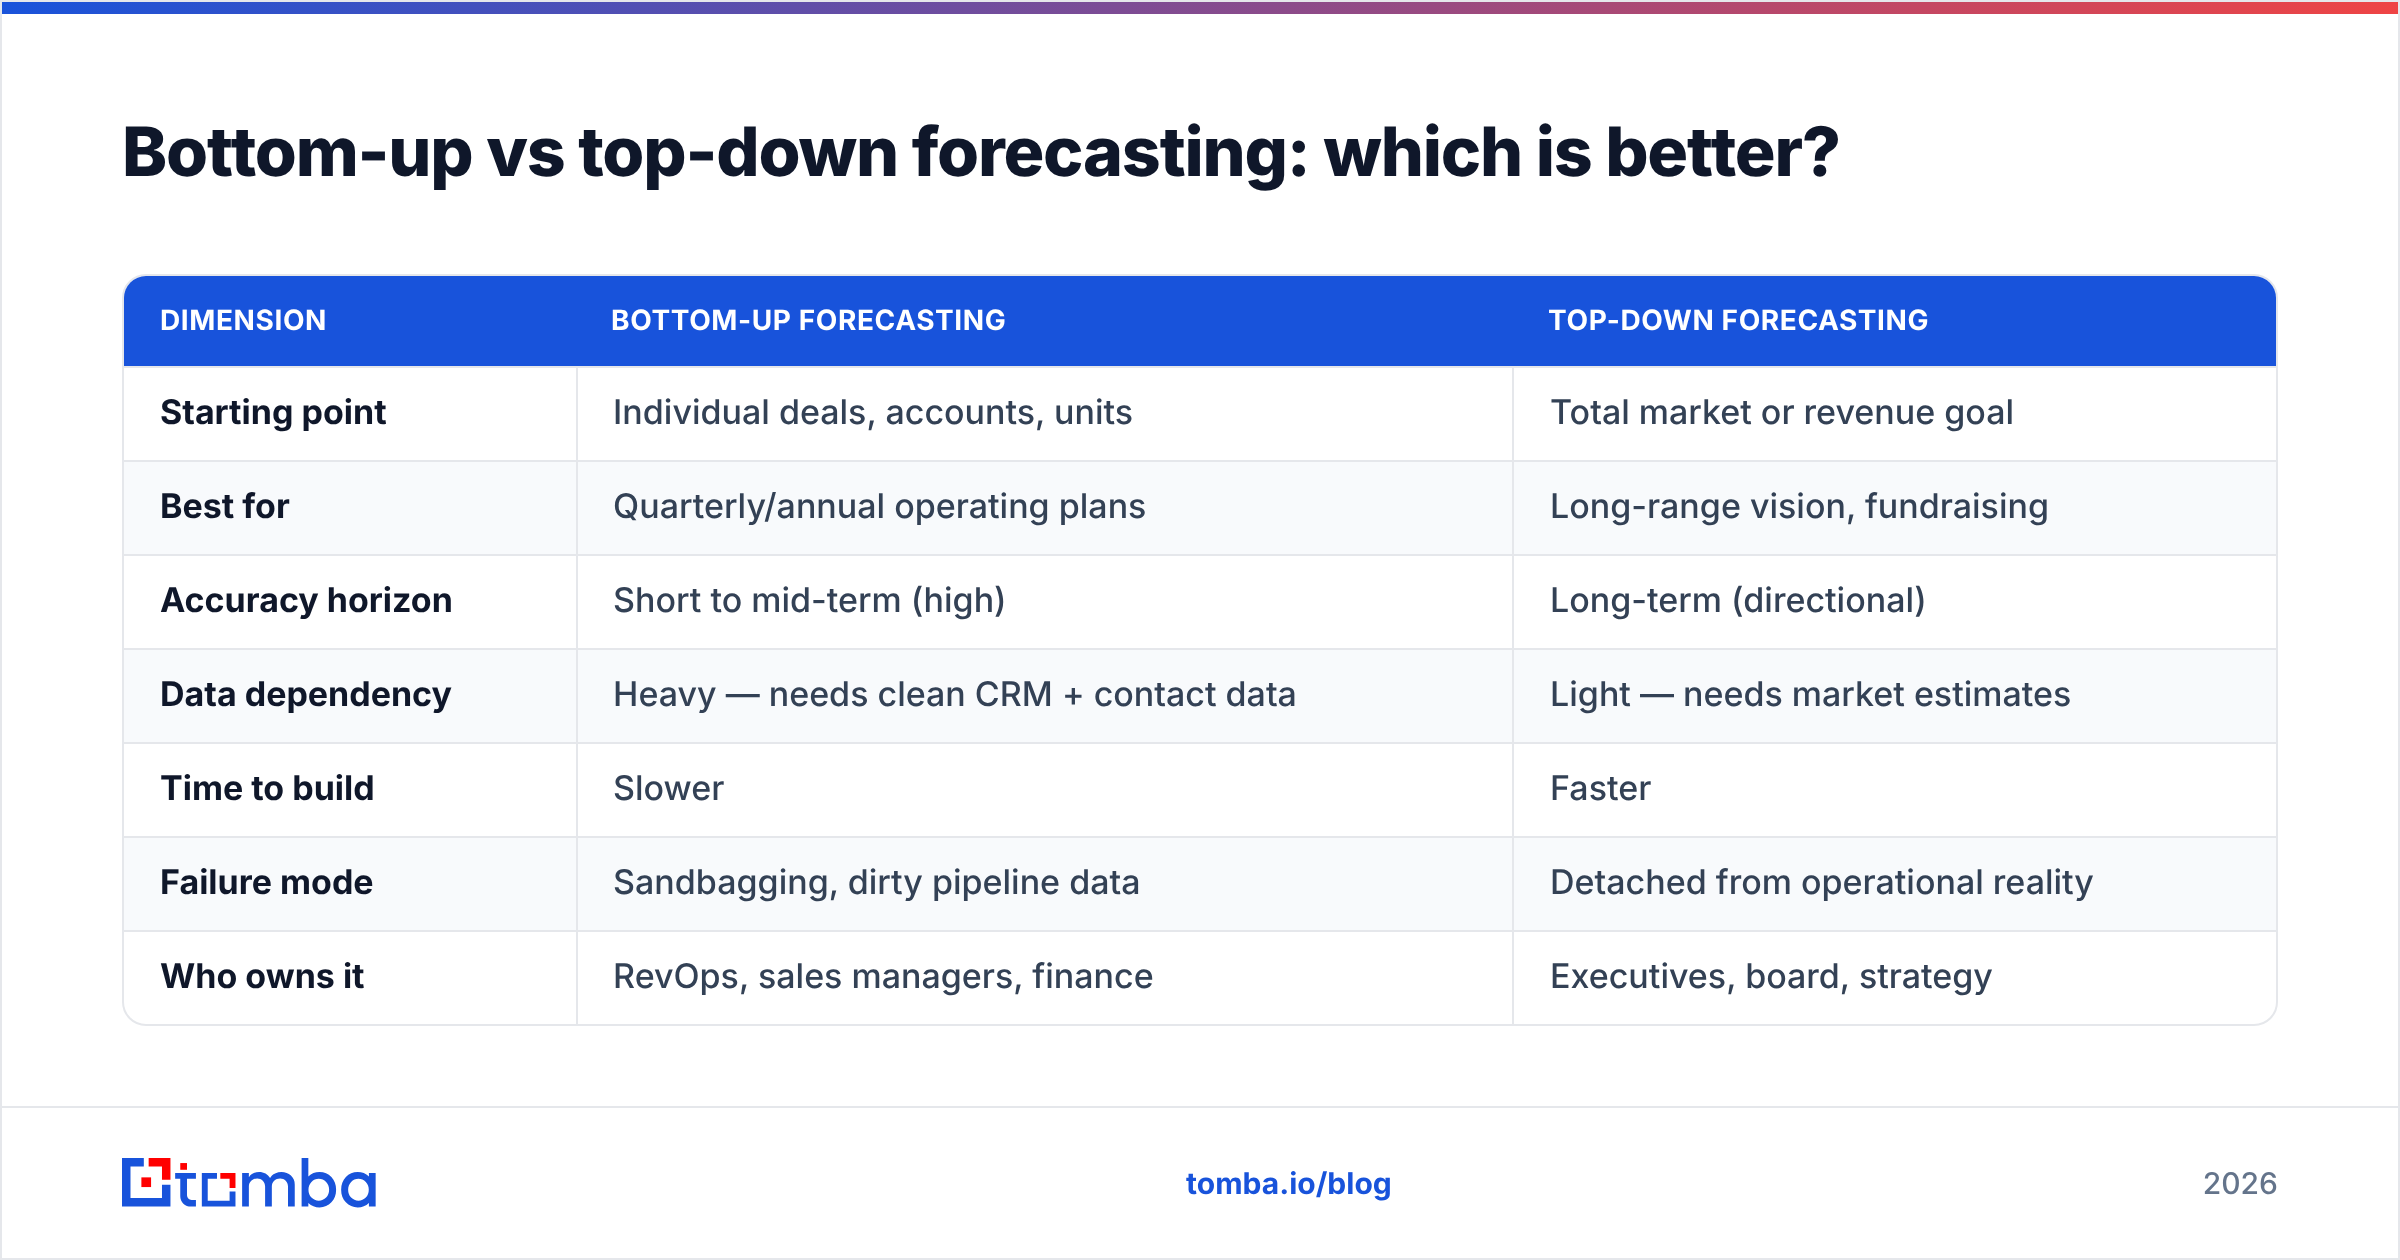
Neither is "better" — they answer different questions. Top-down asks how big could this get? Bottom-up asks what will actually close? Mature revenue operations teams run both and treat the delta as a planning signal.
| Dimension | Bottom-Up Forecasting | Top-Down Forecasting |
|---|---|---|
| Starting point | Individual deals, accounts, units | Total market or revenue goal |
| Best for | Quarterly/annual operating plans | Long-range vision, fundraising |
| Accuracy horizon | Short to mid-term (high) | Long-term (directional) |
| Data dependency | Heavy — needs clean CRM + contact data | Light — needs market estimates |
| Time to build | Slower | Faster |
| Failure mode | Sandbagging, dirty pipeline data | Detached from operational reality |
| Who owns it | RevOps, sales managers, finance | Executives, board, strategy |
A practical rule: if a number will drive hiring, quota, and spend in the next 12 months, lead with bottom-up. If it will drive a Series B narrative or a 3-year market thesis, lead with top-down — then pressure-test it against what bottom-up says is reachable.
What are the bottom-up forecasting models?#
There are three models most B2B teams actually use. Pick by how much pipeline history you have.
Pipeline (stage-weighted) model. Every open deal is multiplied by the historical win rate of its current stage. A $50K deal at a stage that closes 30% of the time contributes $15K. Sum across all open deals. Best when your stages are well-defined and stable.
Conversion-rate (funnel) model. Start from top-of-funnel volume and apply conversion rates at each step: leads → MQLs → SQLs → opportunities → closed-won. Multiply through, then by average deal size. Best when new pipeline (not yet created) is a big share of the number.
Rep-/account-level roll-up. Each rep or account owner commits a number per deal, managers adjust for known optimism, and you roll up. Best in enterprise motions with few, large, high-touch deals where human judgment beats statistics.
Most teams blend them: stage-weighting for existing pipeline, conversion math for net-new, and a rep commit layer for the biggest deals.
How do you calculate a bottom-up revenue forecast?#
The foundational formula is deceptively simple:
Forecasted revenue = number of leads × conversion rate × average deal size
Say your funnel produces 1,000 qualified leads in a quarter, you close 4% of them, and your average contract is $12,000:
1,000 × 0.04 × $12,000 = $480,000
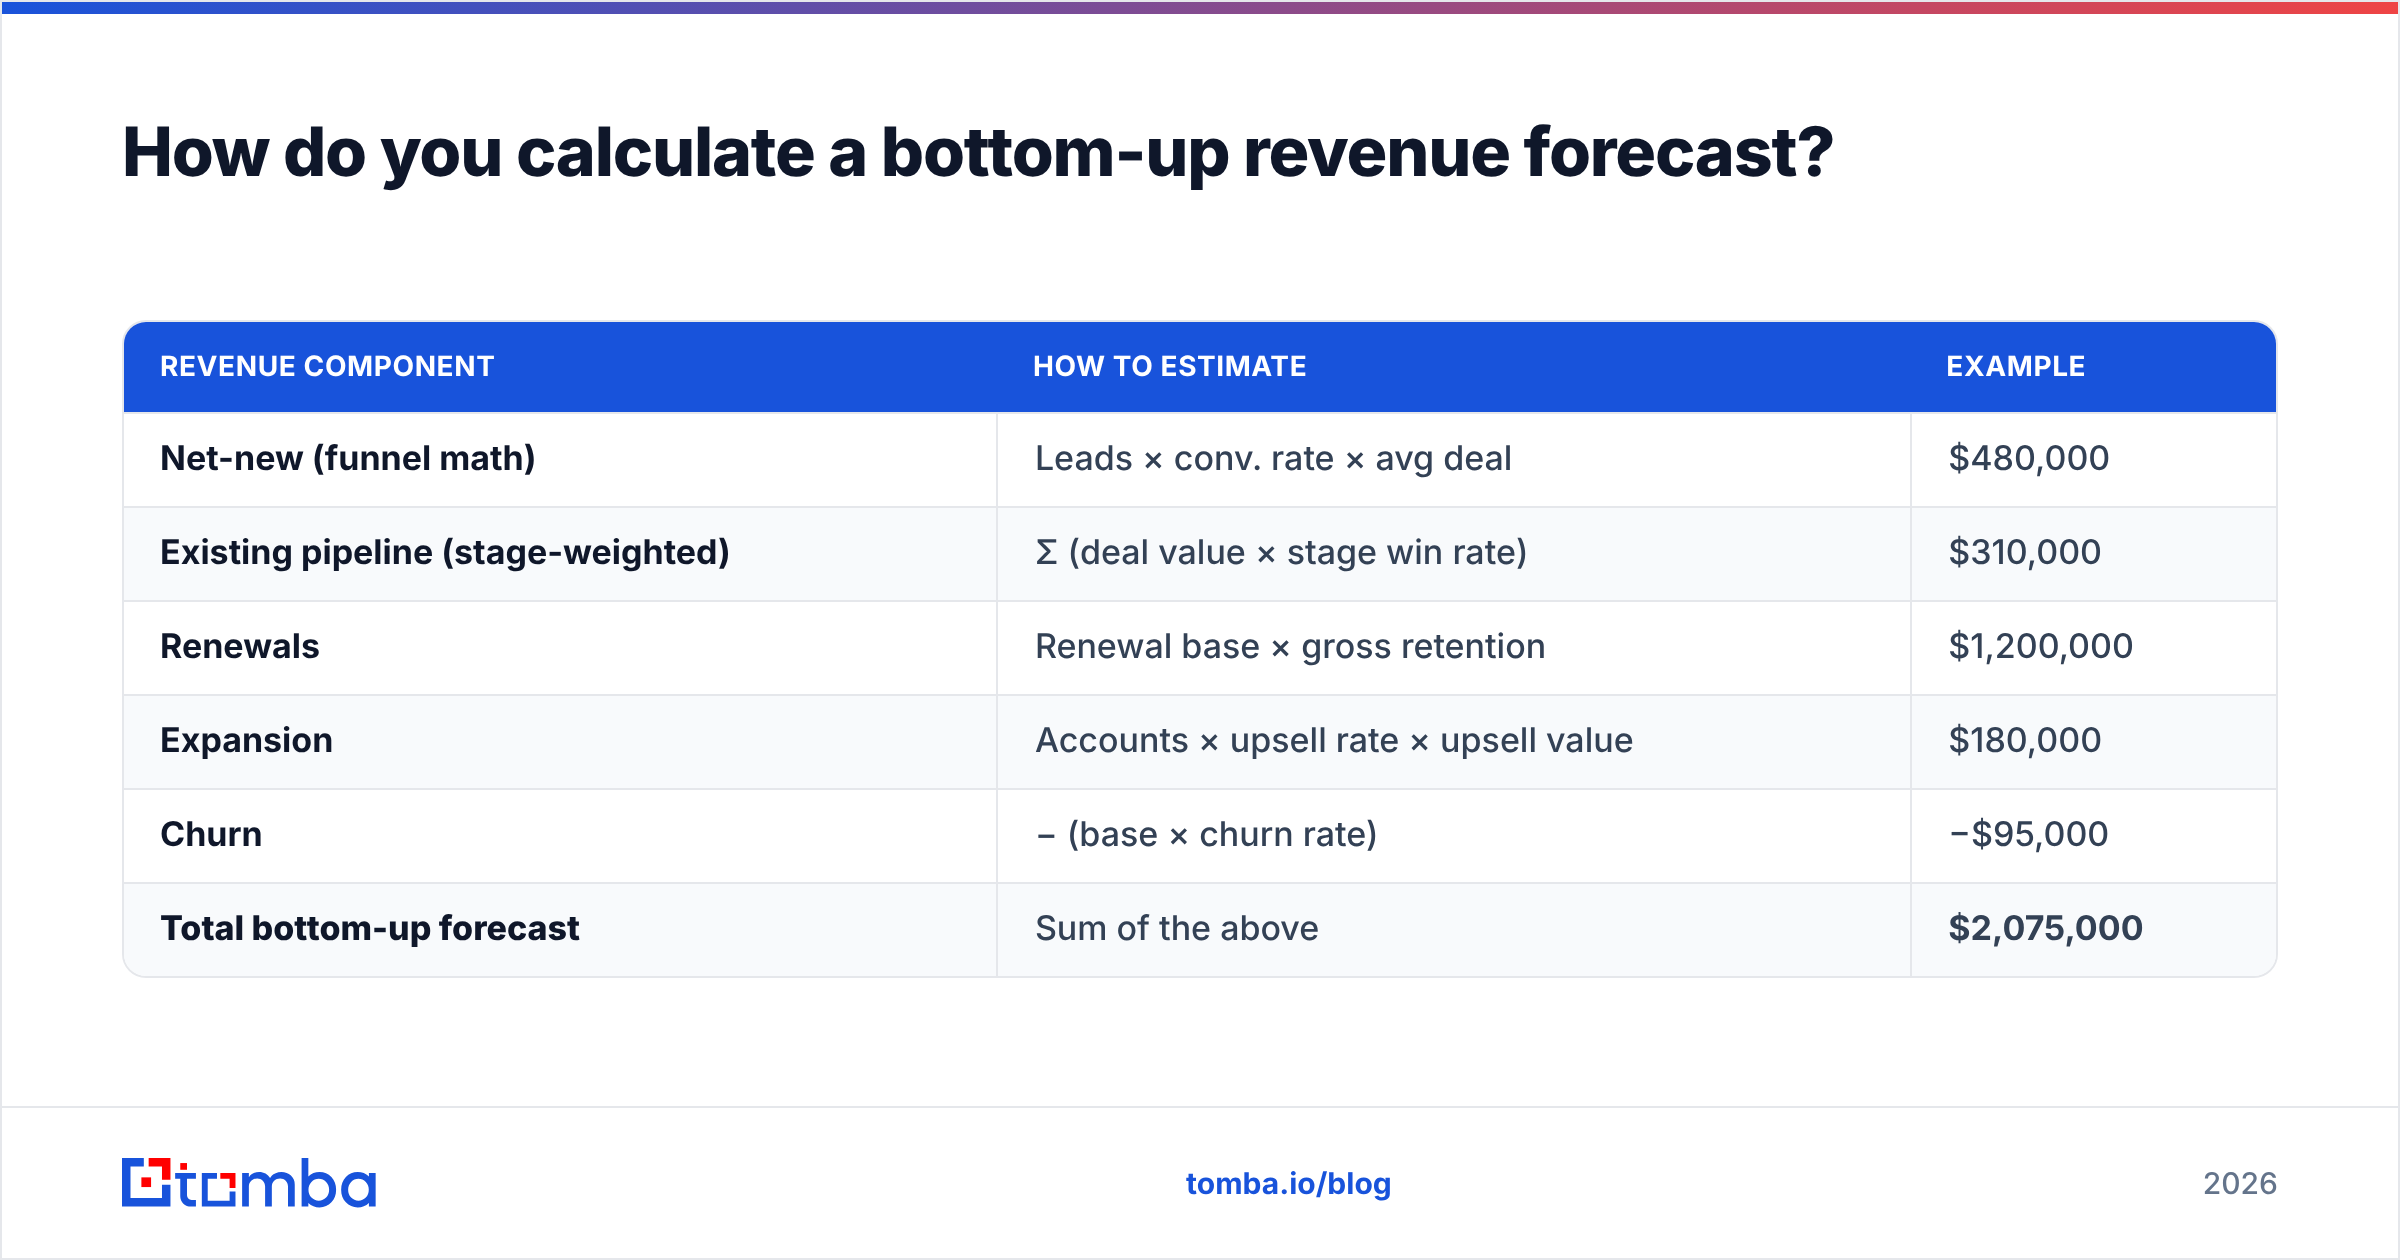
That's your net-new number. Then layer the rest of the bottom-up stack on top:
| Revenue component | How to estimate | Example |
|---|---|---|
| Net-new (funnel math) | Leads × conv. rate × avg deal | $480,000 |
| Existing pipeline (stage-weighted) | Σ (deal value × stage win rate) | $310,000 |
| Renewals | Renewal base × gross retention | $1,200,000 |
| Expansion | Accounts × upsell rate × upsell value | $180,000 |
| Churn | − (base × churn rate) | −$95,000 |
| Total bottom-up forecast | Sum of the above | $2,075,000 |
The power here is auditability: if finance challenges the $480K, you can drill straight into the 1,000 leads and ask whether that volume is real. Which is exactly where most bottom-up models quietly fall apart.

Why do bottom-up forecasts go wrong?#
Bottom-up forecasting is only as good as its smallest input. The model is sound; the data feeding it usually isn't. The four most common failure points:
- Phantom pipeline. Deals that should have been closed-lost months ago still sit in "Negotiation," inflating the weighted number. Enforce stage hygiene and aging rules.
- Bad contact and account data. If 25% of your "qualified leads" have wrong or unreachable contacts, your conversion rate is built on sand. This is where data enrichment and verification pay for themselves — accurate inputs make the multiplication trustworthy.
- Stale conversion rates. Using last year's 4% close rate when the market shifted. Recompute rates on a rolling basis.
- Rep sandbagging or happy ears. Human commits skew low (to beat quota) or high (to look good). Calibrate against each rep's historical accuracy, not their confidence.
Notice that two of the four are fundamentally data-quality problems. A forecast that multiplies lead count by conversion rate assumes those leads are real, reachable people at real companies. The moment that assumption breaks, the elegance of the math becomes a liability — it produces a precise number that happens to be wrong.
How does data quality drive forecast accuracy?#
Clean go-to-market data is the load-bearing wall of bottom-up forecasting. Here's the chain of dependency, and where each link breaks:
- Account universe. You can't forecast new pipeline without a credible count of target accounts. A verified B2B database gives you the denominator — how many accounts actually fit your ICP — so your top-of-funnel assumptions aren't guesses.
- Reachable contacts. A lead with no valid email or phone isn't a lead; it's a row. Finding and confirming the right decision-maker contact converts "rows" into pipeline you can model. Tools like an email finder close that gap at the point of list-building.
- Conversion measurement. With reachable contacts, your conversion rates reflect reality instead of noise from undeliverable outreach.
- Roll-up. Only now does the math — leads × conversion × deal size — produce a number worth presenting.
Skip step 1 or 2 and every downstream rate is contaminated. According to research summarized by Gartner, poor data quality costs organizations millions annually in misdirected effort — and a forecast is just data quality with a dollar sign attached. The CRM hygiene practices that platforms like Salesforce and HubSpot preach exist precisely because forecasting depends on them.
When should you use bottom-up forecasting?#
Reach for bottom-up when accuracy matters more than speed and you have the operational data to support it:
- Annual operating plans and quota-setting — you're committing real budget and headcount.
- Board reporting on near-term revenue — you'll be asked to defend the number deal by deal.
- Sales capacity planning — how many reps, at what ramp, hitting what attainment.
- Cash-flow-sensitive businesses — where a 20% miss is an existential event, not a rounding error.
Reach for top-down instead when you're sizing a new market, building a multi-year vision, or you simply don't have enough pipeline history for bottom-up to be meaningful (early-stage startups, brand-new product lines). Even then, build the bottom-up version as soon as you have two or three quarters of conversion data — it's the fastest way to find out whether the dream is reachable.
A 6-step bottom-up forecasting workflow#
Here's a repeatable process you can run every quarter:
- Define the units. Decide your granular building blocks — usually open opportunities, renewal accounts, and net-new funnel. Be explicit about what counts.
- Clean the inputs. Verify contacts, dedupe accounts, age out dead deals, and enrich missing firmographics before you touch the math. This is the step everyone skips and everyone regrets.
- Pull historical rates. Compute stage win rates, funnel conversion rates, retention, and expansion from the last 4–8 quarters — rolling, not static.
- Build the roll-up. Apply rates to each unit, sum by segment, then by region, then company-wide. Keep the drill-down intact.
- Calibrate against humans. Layer in rep commits for large deals and adjust each rep by their historical forecast accuracy.
- Reconcile with top-down. Compare to the ambition number. A 10–15% gap is healthy tension; a 50% gap means one of the two models is lying — usually find out which before the quarter starts, not after.
Bottom-up forecasting tools and inputs#
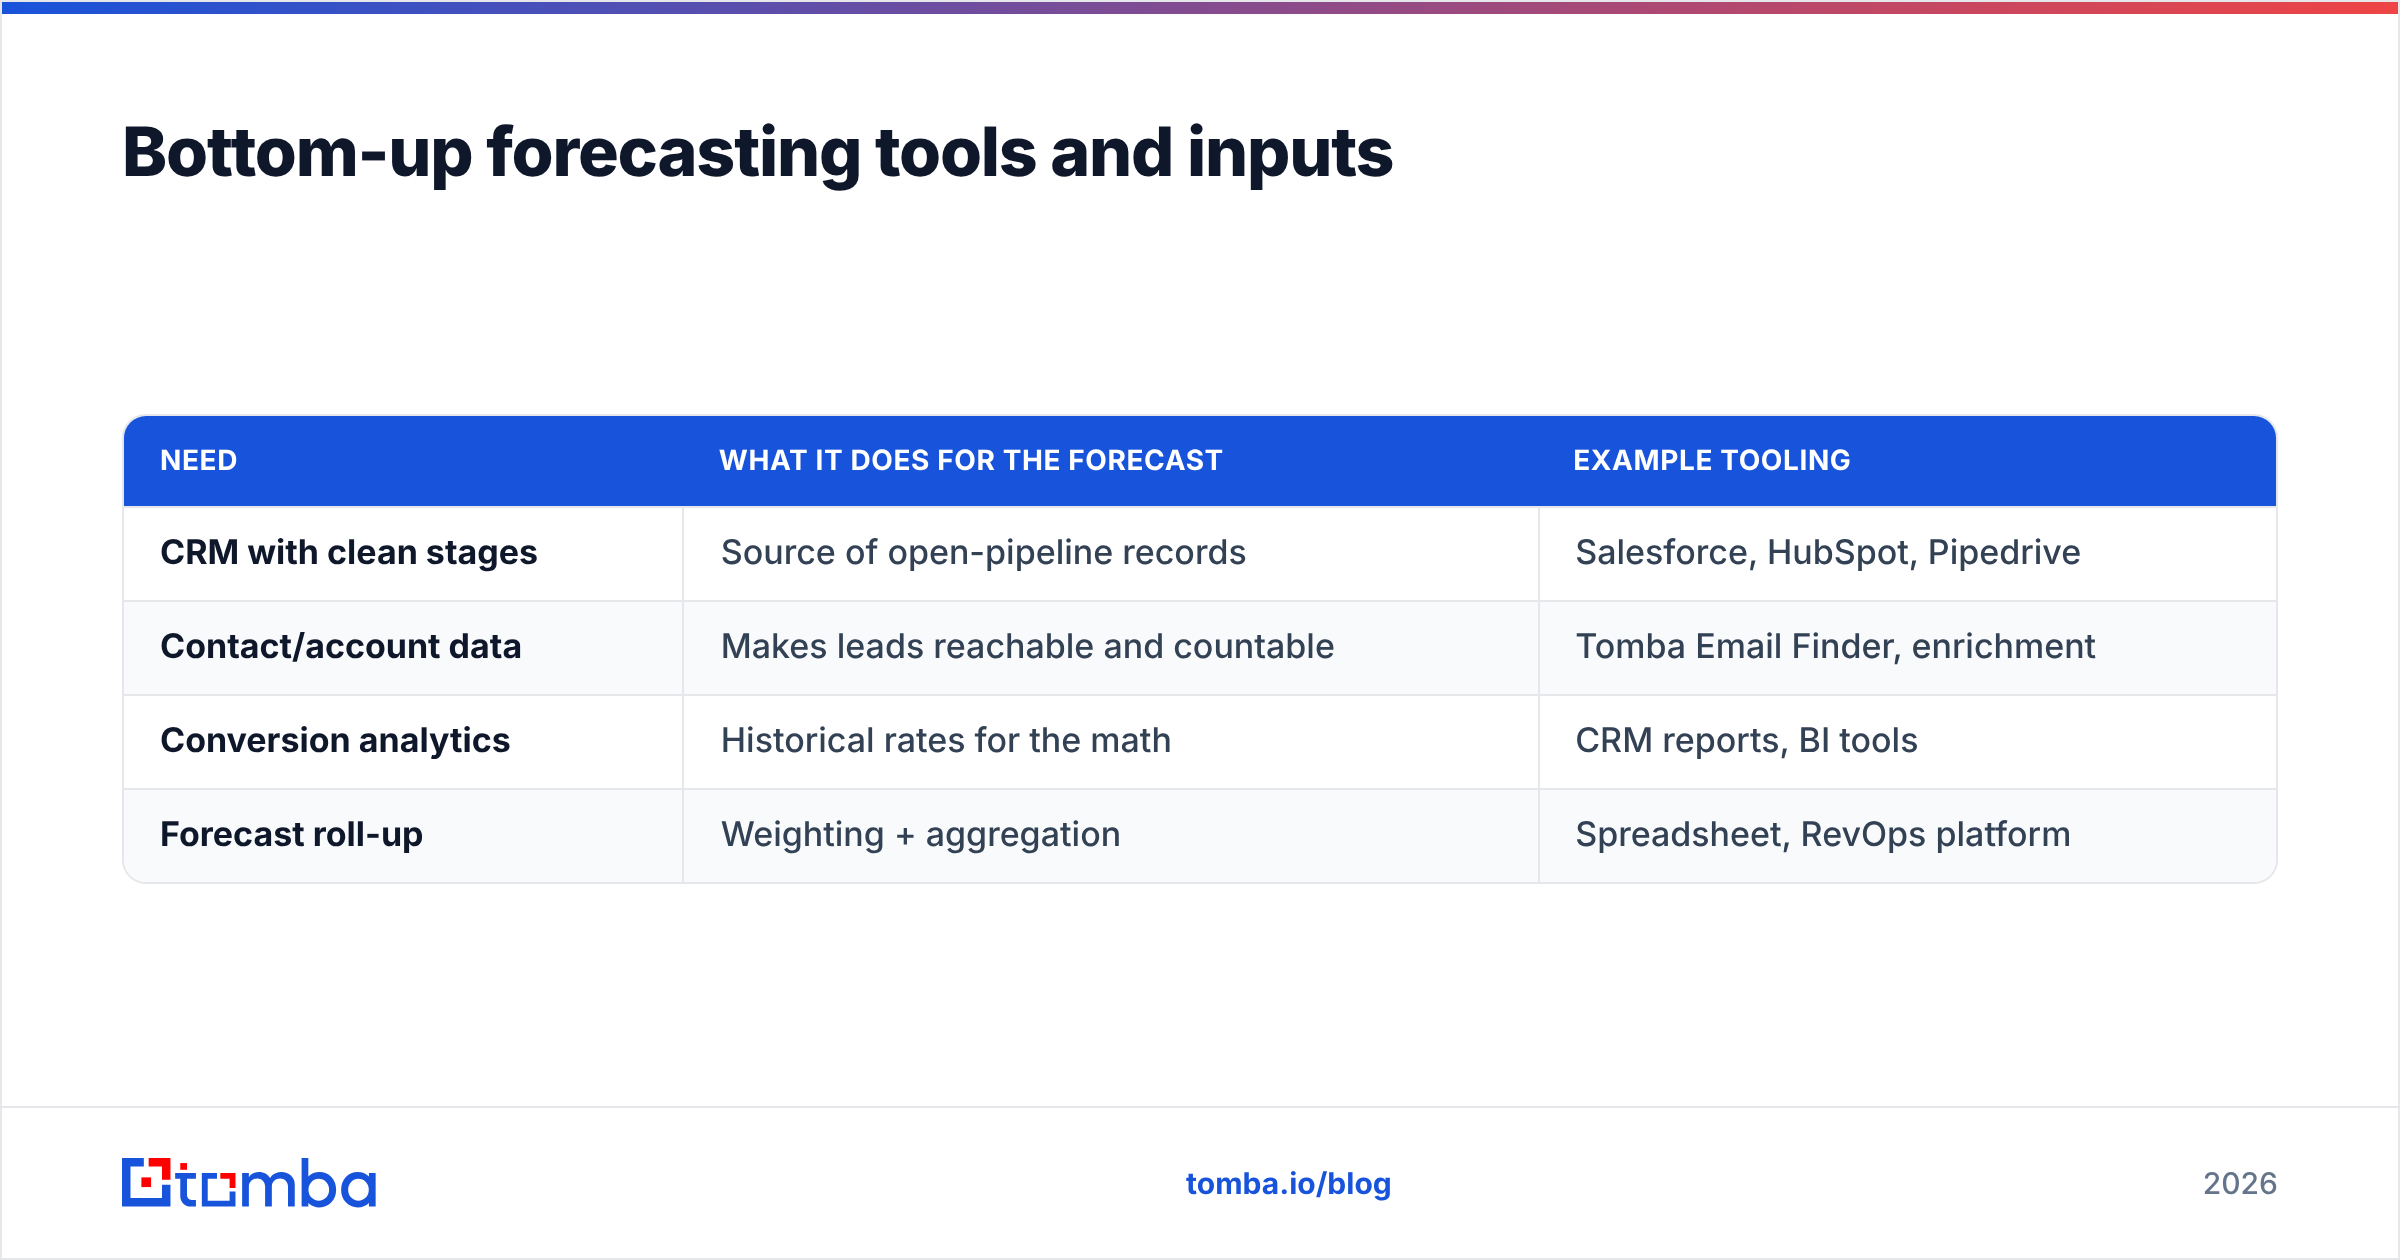
You don't need a dedicated forecasting suite to start — a clean CRM and a spreadsheet get you surprisingly far. What you do need is trustworthy inputs. Here's how the pieces map:
| Need | What it does for the forecast | Example tooling |
|---|---|---|
| CRM with clean stages | Source of open-pipeline records | Salesforce, HubSpot, Pipedrive |
| Contact/account data | Makes leads reachable and countable | Tomba Email Finder, enrichment |
| Conversion analytics | Historical rates for the math | CRM reports, BI tools |
| Forecast roll-up | Weighting + aggregation | Spreadsheet, RevOps platform |
The constant across that table is data: every modeled dollar starts as a real contact at a real company. Get that layer right and the forecasting method almost doesn't matter. Get it wrong and no model — bottom-up, top-down, or AI-driven — will save you.
The bottom line#
Bottom-up revenue forecasting wins on accuracy because it refuses to start from a wish. It builds the company number from the smallest real units of demand — verified accounts, reachable contacts, weighted deals — and rolls them up into a figure you can defend line by line. The method is straightforward; the discipline is in the inputs.
That's the part most teams underinvest in. Before you obsess over weighting formulas, make sure the leads you're multiplying are real, reachable people at companies that fit your ICP. Tomba's Email Finder turns your target account list into verified, contactable pipeline — the clean denominator your bottom-up model depends on. Start free with 25 searches a month, and when forecasting volume grows, plans scale from $49/mo Starter to Growth and Pro. Accurate forecasts begin with accurate data; give your model something real to count.
Ready to find emails that actually work?
Join 150,000+ professionals who stopped guessing and started sending. Free credits on signup — no credit card required.
Get the Tomba newsletter
Practical outbound tactics and product updates — once every two weeks.
About the author