Business Development Tracking: The 2026 Playbook & Metrics
Most BD teams confuse activity with progress. Here's how to build a business development tracking system that ties every meeting, lead, and follow-up to revenue you can actually forecast in 2026.
TL;DR
- Business development tracking is the discipline of measuring every BD activity — outreach, meetings, partnerships, and pipeline — against revenue outcomes, not vanity counts.
- Track three layers: leading activity metrics, conversion-stage metrics, and outcome metrics. Most teams only watch the third and fly blind on the first two.
- A spreadsheet works until ~50 active opportunities. Past that, you need a CRM plus clean contact data feeding it.
- Dirty data quietly kills tracking: bounced emails, stale titles, and missing phone numbers make your dashboards lie.
- Start with five KPIs, one source of truth, and a weekly review cadence. Add sophistication only after the basics are honest.
What is business development tracking?#
Business development tracking is the system you use to record, measure, and forecast every stage of your BD motion — from first touch to signed deal or partnership. Think of it like a fitness tracker for your growth engine. A fitness tracker doesn't just show your weight (the outcome); it shows steps, heart rate, and sleep (the inputs), so you know why the number moved. Good BD tracking does the same: it connects the meetings you booked and the emails you sent to the revenue that eventually landed.
Technically, it sits on top of your CRM and pulls together three things: activity data (what your team did), pipeline data (where deals sit), and conversion data (how things move between stages). Without all three, you get a scoreboard with no game footage.
The mistake nearly every team makes is treating "we sent 400 emails this week" as progress. Activity is an input, not an outcome. Tracking exists to expose the ratio between the two — and to tell you which inputs actually produce pipeline.
Why does business development tracking matter in 2026?#
Because guesswork no longer survives a budget review. Buying committees are larger, sales cycles are longer, and finance wants a forecast it can trust. According to Gartner research on B2B buying, the typical purchase now involves multiple stakeholders and dozens of interactions — which means a single "yes" hides a long trail of touches you need to see.
When tracking is honest, three things happen:
- You forecast instead of hope. A tracked pipeline with real stage-conversion rates lets you predict next quarter within a believable range.
- You coach the right behavior. If reps who book three discovery calls a week close twice as much, that's a number you can manage to.
- You stop wasting outreach. Tracking reveals which segments, sources, and messages convert — so you pour effort into what works.
Without tracking, you optimize for the loudest rep and the most recent deal. With it, you optimize for the pattern.
What are the core business development metrics to track?#
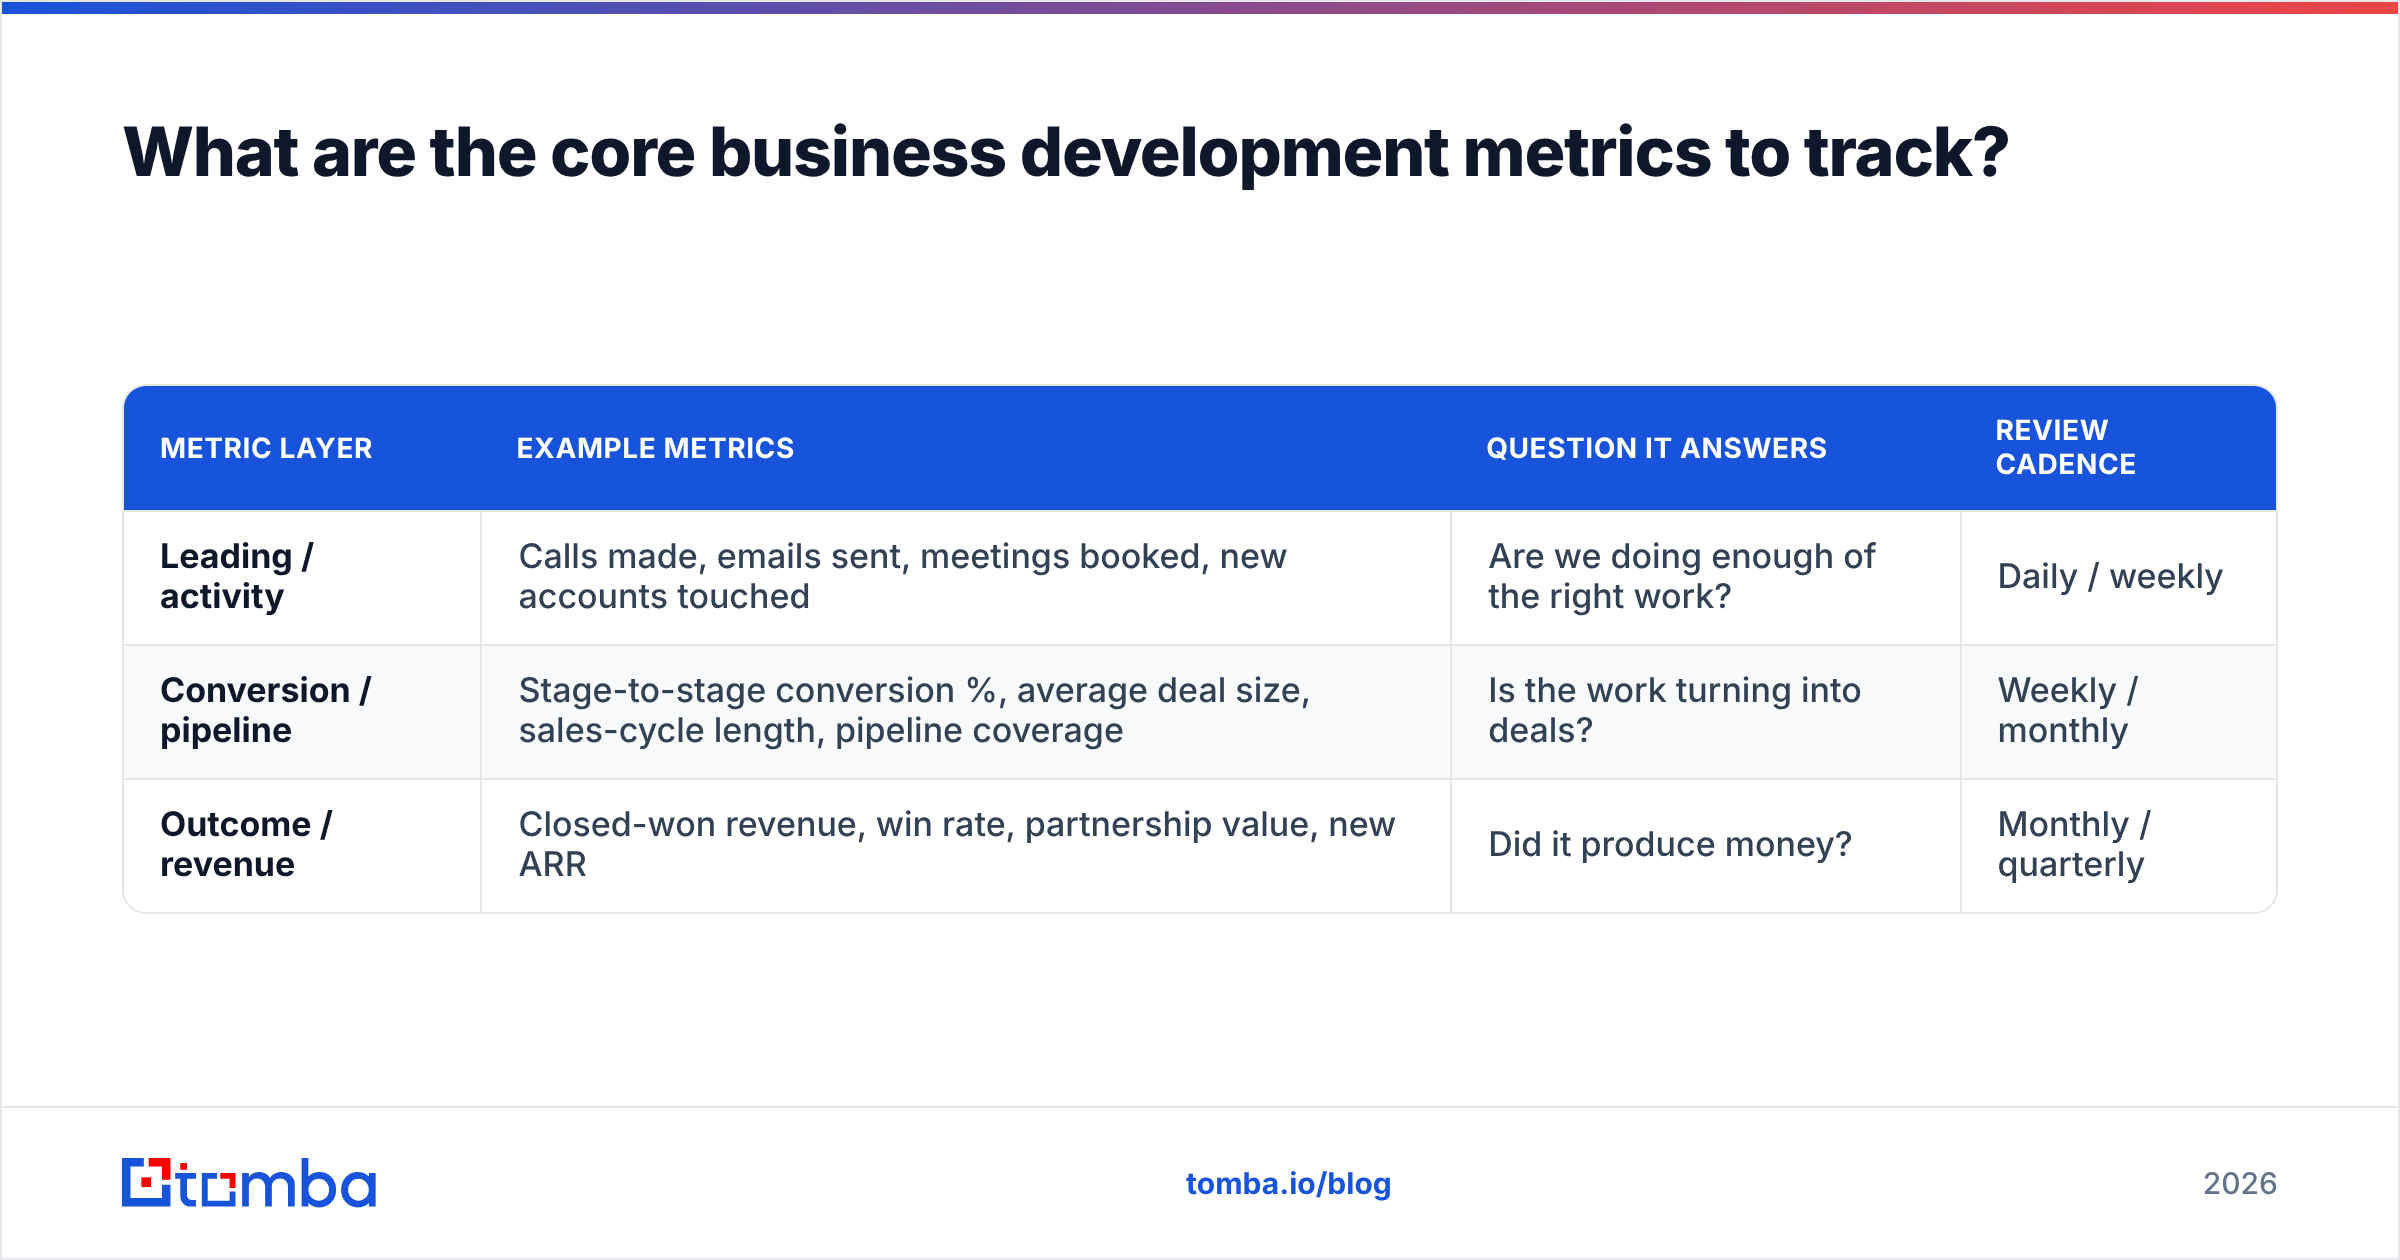
Group your metrics into three layers. Each answers a different question.
| Metric layer | Example metrics | Question it answers | Review cadence |
|---|---|---|---|
| Leading / activity | Calls made, emails sent, meetings booked, new accounts touched | Are we doing enough of the right work? | Daily / weekly |
| Conversion / pipeline | Stage-to-stage conversion %, average deal size, sales-cycle length, pipeline coverage | Is the work turning into deals? | Weekly / monthly |
| Outcome / revenue | Closed-won revenue, win rate, partnership value, new ARR | Did it produce money? | Monthly / quarterly |
Here are the five KPIs most BD teams should start with, in priority order:
- Meetings booked per rep, per week — the cleanest leading indicator of future pipeline.
- Lead-to-meeting conversion rate — exposes outreach and targeting quality.
- Pipeline coverage ratio — open pipeline divided by quota; under 3x is a warning light.
- Average sales-cycle length — tells you how far ahead to fill the funnel.
- Win rate by source — shows which channels deserve more investment.
Notice none of these is "number of emails sent." Volume is only useful when paired with a conversion rate. Five hundred emails with a 0.2% reply rate is a problem disguised as productivity.
How do you set up a business development tracking system?#
Conclusion first: pick one source of truth, define your stages, instrument five KPIs, and review weekly. Everything else is refinement.
Step 1 — Choose your single source of truth. This is your CRM. If two systems disagree, you have zero systems. Most teams use HubSpot or Salesforce depending on size and budget.
Step 2 — Define pipeline stages with exit criteria. A stage without a clear "what has to be true to move forward" is a parking lot. Write one sentence per stage: Discovery → prospect confirmed budget and timeline.
Step 3 — Instrument activity capture. Log calls, emails, and meetings automatically where you can. Manual logging decays within a month; reps stop, and your data rots.
Step 4 — Build a weekly dashboard. Five KPIs, one screen, same time every week. The discipline of the cadence matters more than the dashboard's beauty.
Step 5 — Feed it clean data. This is the step everyone skips. A tracking system is only as honest as the contacts inside it — which is the whole next section.
Why does data quality make or break your tracking?#
Because a dashboard built on bad contacts reports confident nonsense. If 20% of your outreach bounces, your "reply rate" is mathematically inflated and your activity metrics are fiction. Tracking dirty data is like weighing yourself on a broken scale — precise to the decimal, and wrong.
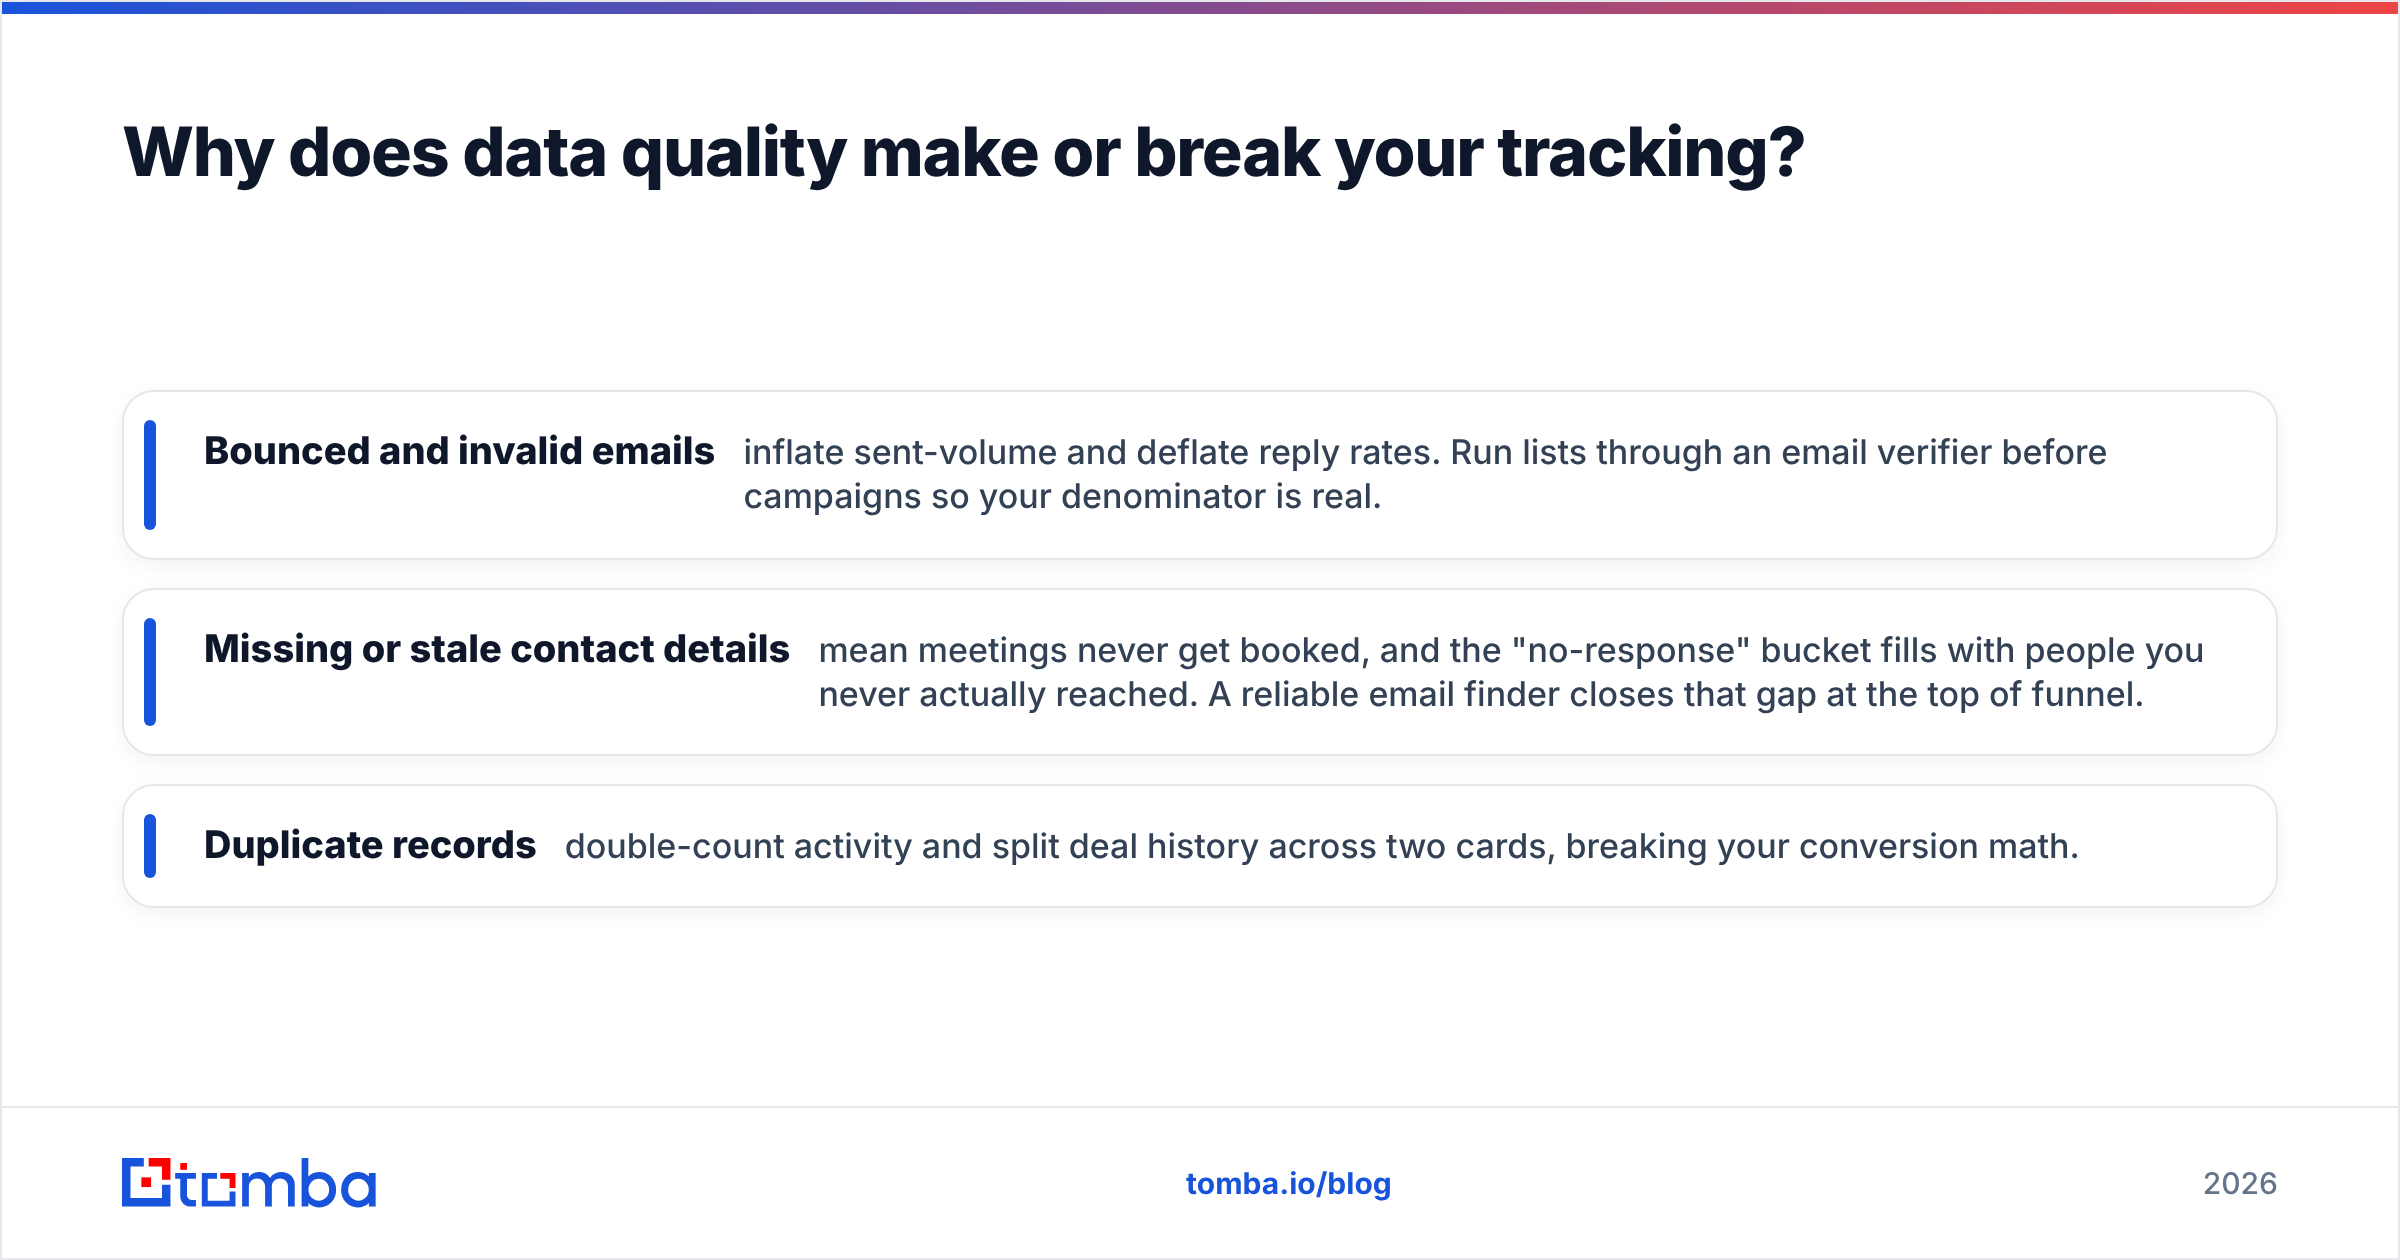
Three data problems silently corrupt BD tracking:
- Bounced and invalid emails inflate sent-volume and deflate reply rates. Run lists through an email verifier before campaigns so your denominator is real.
- Missing or stale contact details mean meetings never get booked, and the "no-response" bucket fills with people you never actually reached. A reliable email finder closes that gap at the top of funnel.
- Duplicate records double-count activity and split deal history across two cards, breaking your conversion math.
The fix is to treat data hygiene as part of the tracking system, not a separate chore. Verify on import, enrich on creation, and dedupe on a schedule. When your inputs are clean, every ratio downstream becomes trustworthy — and you can use data enrichment to fill in firmographics that make segmentation possible.
Spreadsheet vs CRM vs dedicated BD platform: which should you use?#
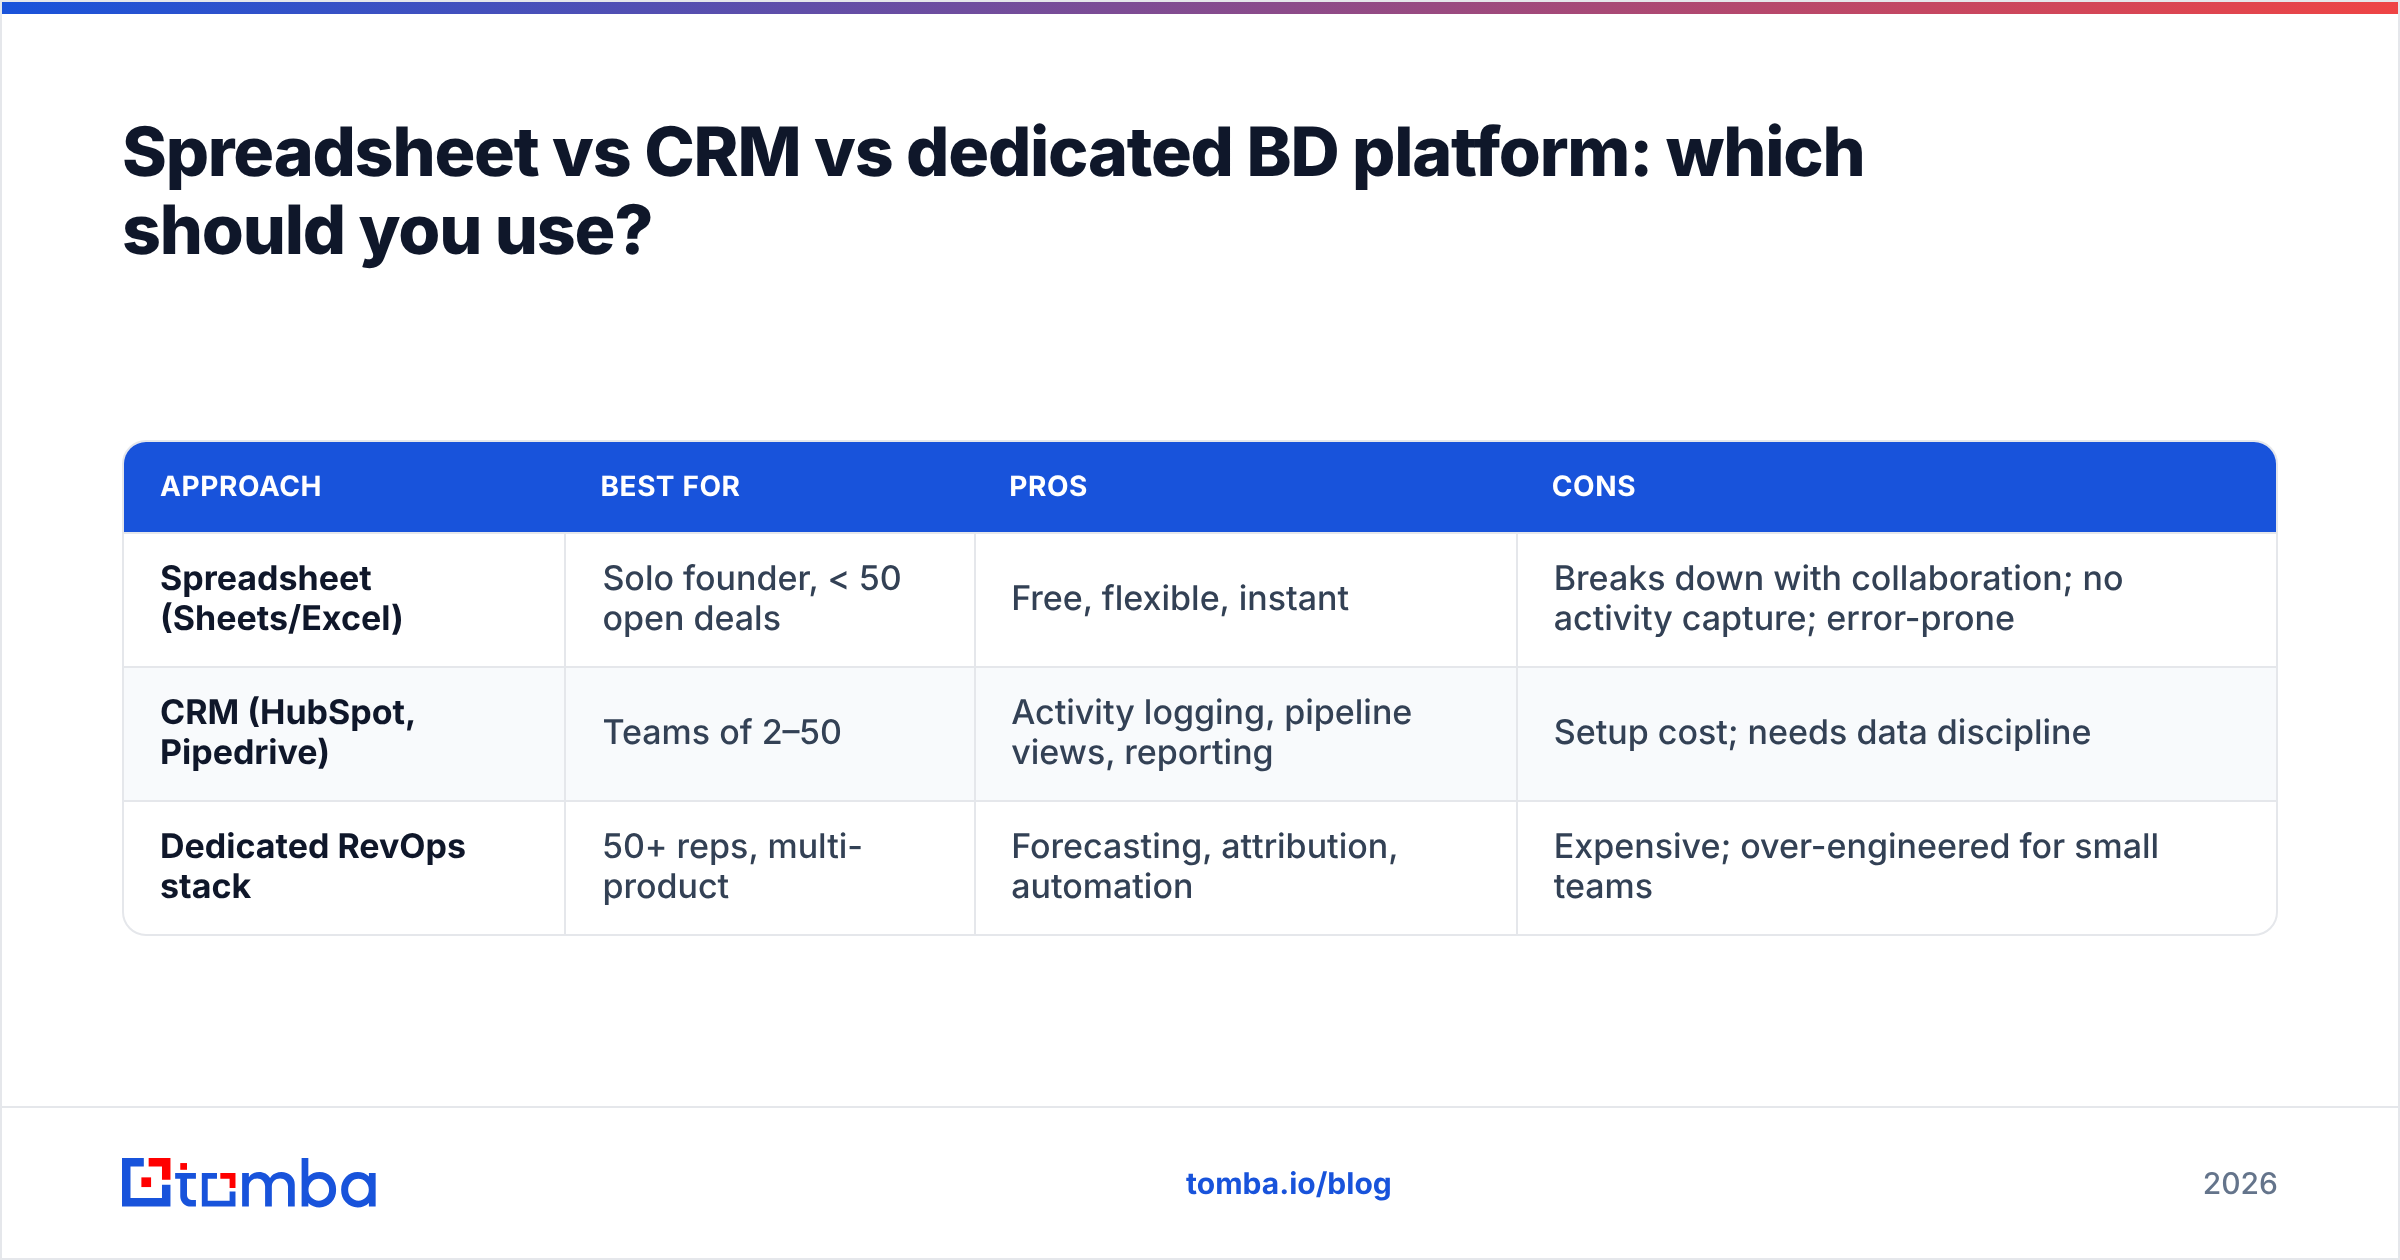
It depends on volume and team size. Use the lightest tool that keeps your data honest at your current scale.
| Approach | Best for | Pros | Cons |
|---|---|---|---|
| Spreadsheet (Sheets/Excel) | Solo founder, < 50 open deals | Free, flexible, instant | Breaks down with collaboration; no activity capture; error-prone |
| CRM (HubSpot, Pipedrive) | Teams of 2–50 | Activity logging, pipeline views, reporting | Setup cost; needs data discipline |
| Dedicated RevOps stack | 50+ reps, multi-product | Forecasting, attribution, automation | Expensive; over-engineered for small teams |
A practical path: start in a spreadsheet, graduate to a CRM the moment two people need to see the same pipeline, and layer enrichment and verification tools underneath. You can wire contact discovery directly into your CRM with native integrations so new accounts arrive pre-populated instead of half-blank. If you live in Sheets early on, a Google Sheets add-on can find and verify contacts without leaving the tab.
The tool matters far less than the habit. A disciplined spreadsheet beats a neglected $30k platform every time.
What does a healthy BD tracking dashboard look like?#
A healthy dashboard tells a story in under 30 seconds: are we ahead or behind, and why. It should answer "are we doing enough work?", "is the work converting?", and "will we hit the number?" on one screen.
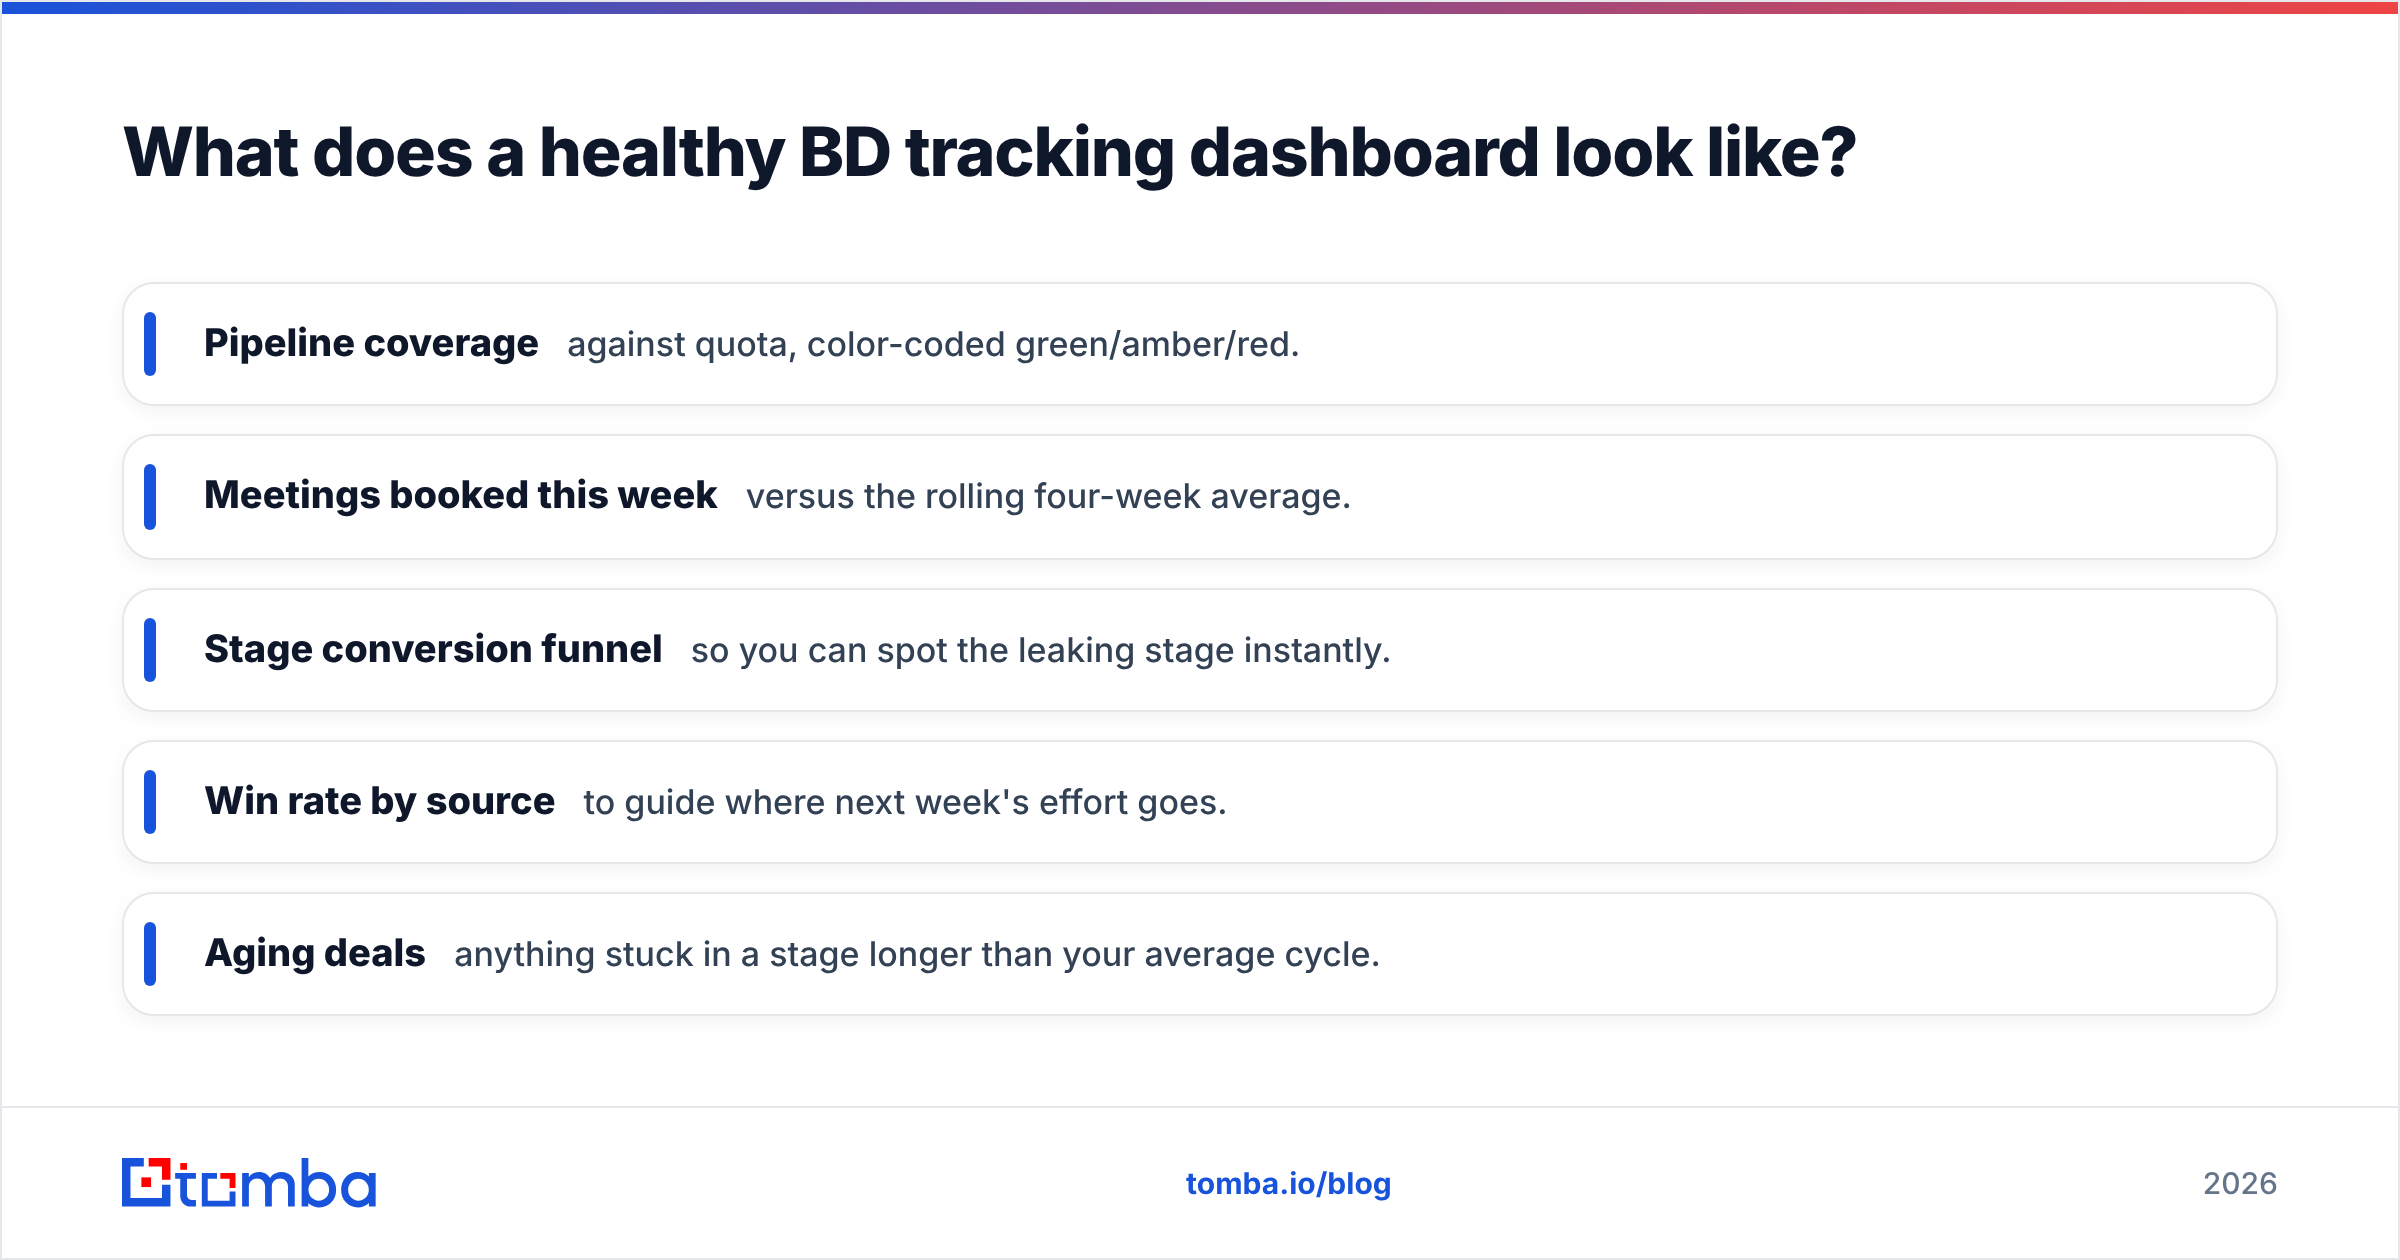
Keep it ruthless. A useful weekly BD dashboard usually shows:
- Pipeline coverage against quota, color-coded green/amber/red.
- Meetings booked this week versus the rolling four-week average.
- Stage conversion funnel so you can spot the leaking stage instantly.
- Win rate by source to guide where next week's effort goes.
- Aging deals — anything stuck in a stage longer than your average cycle.
Resist the urge to add a sixth and seventh widget. Dashboards die from clutter. If a metric doesn't change a decision you'd make this week, it belongs in a monthly report, not the weekly view.
Tie each number to an owner and an action. "Pipeline coverage is 2.1x" is data. "Pipeline coverage is 2.1x, so Sarah's team runs an extra prospecting sprint Thursday" is management. For reviews of channel performance, pair your dashboard with a clear definition of response rate so everyone measures it the same way.
How often should you review business development metrics?#
Match the cadence to the metric's volatility. Activity metrics move daily, so review them weekly. Conversion metrics move over weeks, so review them monthly. Outcome metrics move over quarters, so review them quarterly with leadership.
A simple rhythm that works for most teams:
- Weekly (15 min): activity and pipeline coverage. Tactical course-correction.
- Monthly (60 min): conversion rates, win rate, cycle length. Process tuning.
- Quarterly (half day): strategy, segment performance, tooling, and quota setting.
The danger is reviewing outcome metrics weekly. Revenue is too noisy week to week; you'll overreact to randomness. Watch the leading indicators weekly and trust that healthy inputs produce healthy outputs over time.
What are common business development tracking mistakes?#
The biggest one: measuring activity and calling it progress. Here are the traps to avoid.
- Vanity volume. Counting emails sent without tracking replies rewards spray-and-pray. Always pair an activity with its conversion ratio.
- Untracked dark funnel. Referrals, events, and warm intros often go unlogged, so your best source looks invisible. Make logging frictionless or it won't happen.
- Stage inflation. Reps mark deals "qualified" to look busy. Enforce exit criteria, not optimism.
- Dirty data. As covered above, unverified contacts poison every downstream ratio.
- Too many metrics. A 20-KPI dashboard is a 0-KPI dashboard. Nobody acts on it.
Each of these is a discipline problem, not a tooling problem. The cure is a short list of metrics, clean inputs, and a leader who reviews them on a fixed cadence.
How do you connect tracking to better outreach?#
Tracking is only valuable if it changes what you do next. When your dashboard shows which segments and sources convert, you redirect prospecting toward them — and that's where contact data quality compounds your gains.
Say tracking reveals that mid-market SaaS accounts close at twice your average win rate. The next move is obvious: build a targeted list of those accounts, find verified decision-maker contacts, and run a focused sequence. A domain search pulls every reachable contact at a target company, and pre-verification keeps your reply-rate denominator honest so next month's dashboard stays trustworthy. You can compare plan limits and costs on the Tomba pricing page before scaling a campaign.
Independent review sites like G2 are a useful sanity check when you're choosing the data layer that feeds your tracking — read how teams of your size rate accuracy and CRM fit before committing.
Closing: build the inputs your tracking depends on#
Honest business development tracking starts with honest data. You can buy the best CRM and design a beautiful dashboard, but if a fifth of your contacts bounce, every ratio on that screen is fiction. Fix the input first.
Tomba Email Finder gives your tracking system a clean top of funnel — verified professional emails by name, domain, or company, ready to drop into HubSpot, Salesforce, or your spreadsheet. Start on the free tier with 25 searches a month, then scale to the Starter plan at $49/mo when your pipeline grows. Get the contacts right, and your dashboards finally tell you the truth.
// get started
Find, verify and enrich your first contacts today
Start on the free plan with 25 searches a month, then scale when your team is ready.
Free plan · No credit card required · GDPR & CCPA
// about the author