Business Intelligence Sales: The 2026 Playbook for Reps
Business intelligence sales turns scattered CRM data into decisions reps can act on today. Here's how BI works, the tools that matter in 2026, and where data quality wins or loses the deal.

TL;DR
- Business intelligence sales is the practice of feeding clean, connected data into dashboards and models so reps and leaders make decisions on evidence instead of hunches.
- BI only works when the underlying contact and account data is accurate — garbage in, garbage dashboards out.
- The 2026 stack splits into three layers: data collection, the BI/analytics platform, and the activation layer that pushes insight back to reps.
- A working rollout starts with two or three metrics that change behavior, not a 40-tile dashboard nobody opens.
- Tools like Tableau, Power BI, and Looker visualize the data; tools like Tomba make sure the data is real before it ever hits a chart.
What is business intelligence in sales?#
Business intelligence sales is the discipline of converting raw sales activity — calls, emails, deals, account data — into structured insight that guides what a rep does next. Think of it like the dashboard in your car. The engine (your CRM, email tool, and dialer) generates thousands of signals every day. BI is the instrument cluster that turns those signals into a speedometer and a fuel gauge you can actually read at a glance.
Technically, BI sits on top of your data sources and answers three kinds of questions: what happened (descriptive), why it happened (diagnostic), and what is likely to happen next (predictive). A sales rep using BI does not query a database. They open a dashboard that already says "these 12 accounts went quiet this week" or "your win rate on inbound demos dropped 9 points."
The shift in 2026 is that BI is no longer a back-office reporting function. It is operational. Insights are pushed into the rep's workflow — into Slack, into the CRM record, into the morning standup — rather than locked inside a quarterly board deck. That is the difference between business intelligence as a report and business intelligence as a habit.
)
Why does business intelligence matter for sales teams?#
Conclusion first: BI matters because it shortens the distance between a signal and an action, and that distance is where revenue leaks out.
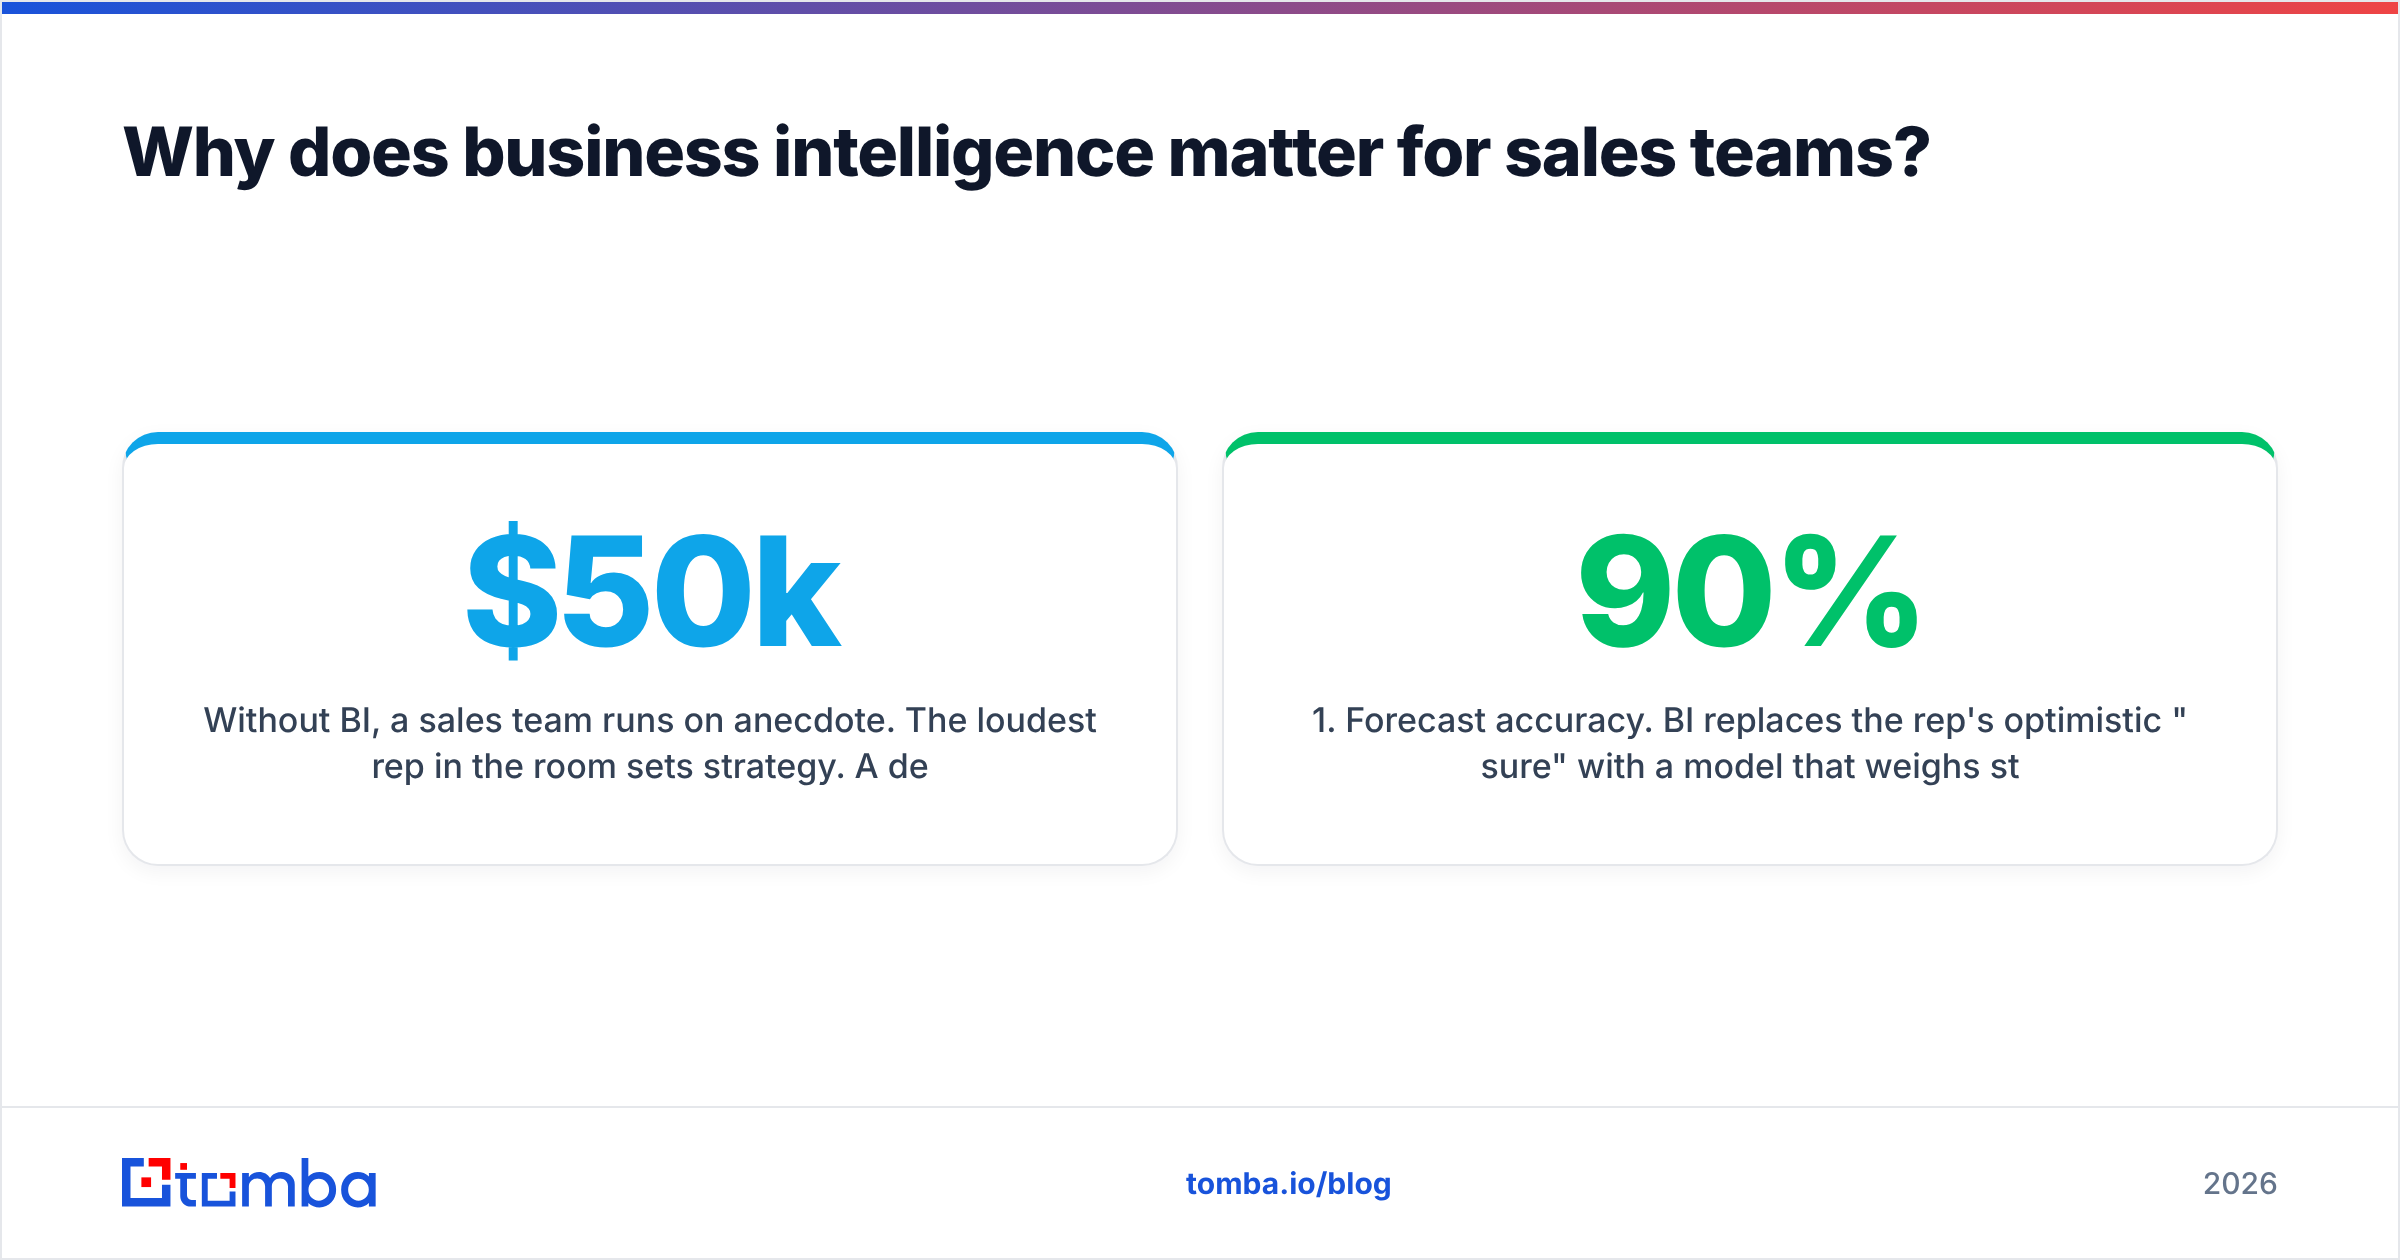
Without BI, a sales team runs on anecdote. The loudest rep in the room sets strategy. A deal slips and nobody can say why because the data lives in seven tabs. With BI, the same team can see that deals over $50k with no second stakeholder close at 11%, while deals with a champion plus an economic buyer close at 38%. Now the playbook writes itself: get a second contact on every large opportunity.
Here is where the numbers come from, and why each one moves the needle:
- Forecast accuracy. BI replaces the rep's optimistic "90% sure" with a model that weighs stage, age, activity, and historical close rates. Leadership stops getting surprised at quarter end.
- Pipeline hygiene. Dashboards surface stale deals, missing next steps, and contacts with no verified email — the rot that inflates pipeline until it collapses.
- Rep coaching. Managers see which activities correlate with closed-won, then coach to those behaviors instead of generic "make more calls" advice.
- Territory and ICP focus. BI shows which segments actually convert, so reps stop spraying effort across accounts that never buy.
- Faster ramp. New reps inherit a dashboard that encodes what good looks like, instead of learning it by losing deals for six months.
This is also where the foundation gets exposed. A forecast model is only as honest as the CRM records feeding it, and a "contacted" account with a bounced email is not really contacted. That is why clean data enrichment and verified contact data is the unglamorous prerequisite for every BI initiative. According to Gartner research on sales analytics, poor data quality is one of the most common reasons BI rollouts fail to change rep behavior.
What does a business intelligence sales stack look like in 2026?#
A modern BI sales stack has three layers, and most teams over-invest in the middle one while ignoring the bottom.
Layer 1 — Data collection and quality. This is where account, contact, and activity data is sourced, verified, and enriched. If a lead's email is wrong, every downstream dashboard inherits the error. Tools here include CRM activity capture, a bulk email finder for filling contact gaps, and an email verifier to strip dead addresses before they pollute reporting.
Layer 2 — The BI / analytics platform. This is the visualization and modeling brain: Tableau, Power BI, Looker, or a native CRM analytics module. It joins your sources, runs the models, and renders the dashboards.
Layer 3 — Activation. This pushes insight back to reps where they work — Slack alerts, CRM scorecards, automated task creation. Insight that nobody acts on is just decoration.
How do the major BI platforms compare?#
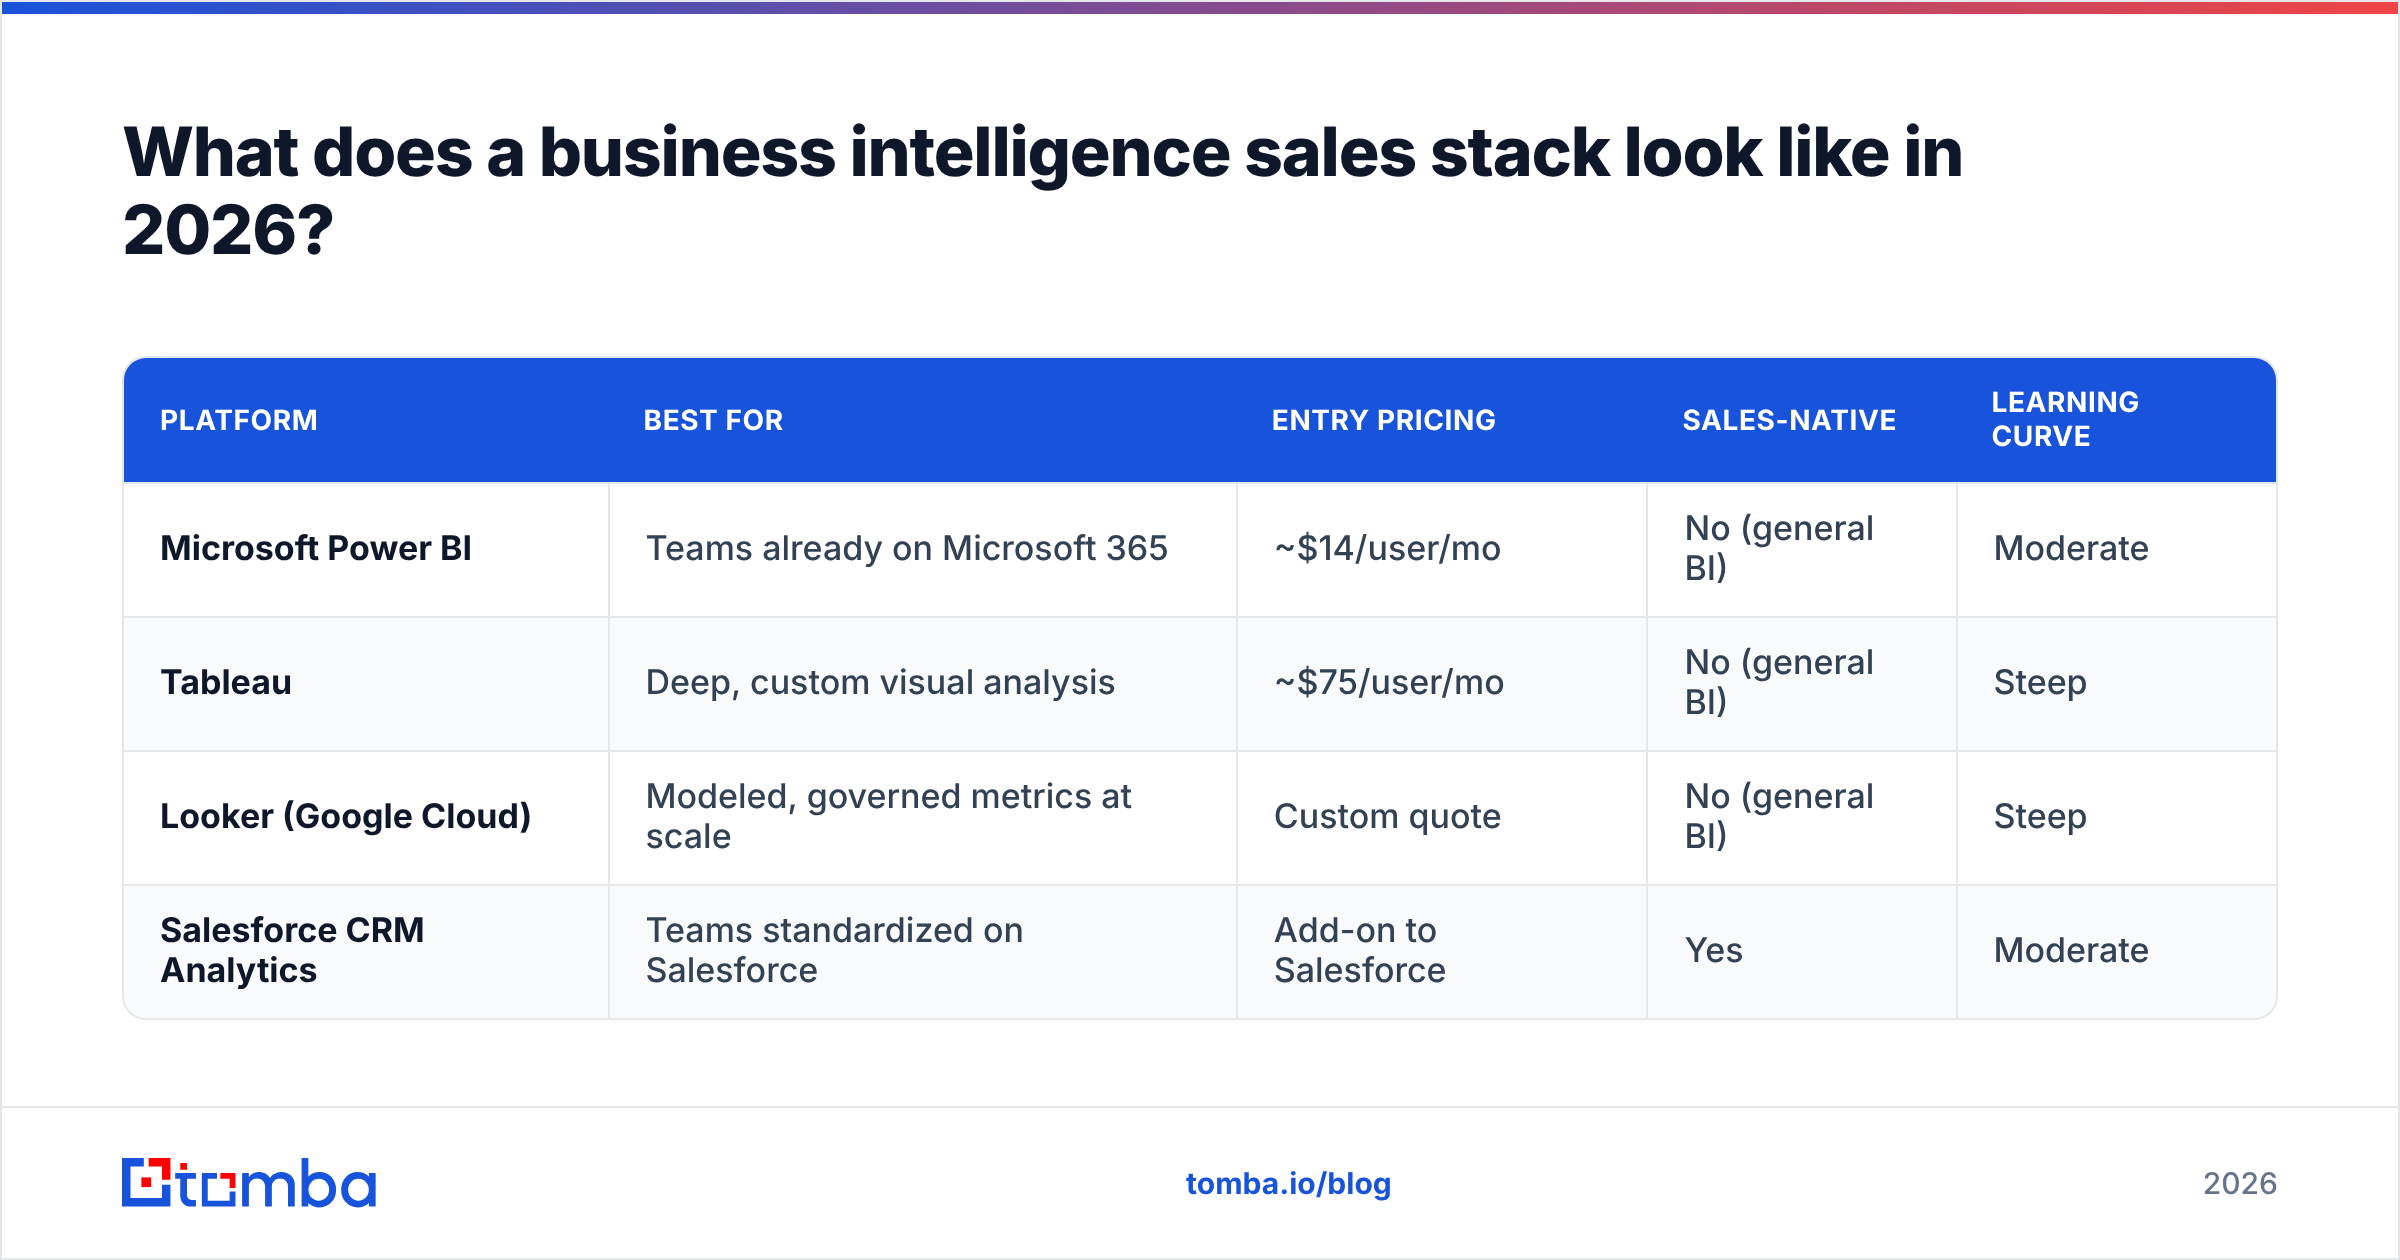
The platform layer is crowded, so here is a concrete comparison of the four options most B2B sales teams evaluate. Prices are entry-level and change often — confirm on each vendor's site.
| Platform | Best for | Entry pricing | Sales-native | Learning curve |
|---|---|---|---|---|
| Microsoft Power BI | Teams already on Microsoft 365 | ~$14/user/mo | No (general BI) | Moderate |
| Tableau | Deep, custom visual analysis | ~$75/user/mo | No (general BI) | Steep |
| Looker (Google Cloud) | Modeled, governed metrics at scale | Custom quote | No (general BI) | Steep |
| Salesforce CRM Analytics | Teams standardized on Salesforce | Add-on to Salesforce | Yes | Moderate |
The takeaway: there is no single winner. If your data already lives in Salesforce, the native analytics layer removes integration pain. If you want the most flexible visualizations and have an analyst to drive them, Tableau is hard to beat. If you live in spreadsheets and Microsoft tooling, Power BI is the cheapest on-ramp. What every option shares is total dependence on the quality of Layer 1.
How do you measure sales performance with BI?#
Start with metrics that change behavior, not vanity tiles. A dashboard with 40 charts is a dashboard nobody reads. Pick a small set, make each one tied to a decision, and only then expand.
The metrics worth instrumenting first:
- Win rate by segment — exposes which deals are worth your reps' time. Pairs directly with your definition of a marketing qualified lead.
- Pipeline coverage ratio — open pipeline divided by quota; tells you if the quarter is already lost.
- Sales cycle length — lengthening cycles are an early warning of friction or weak qualification.
- Activity-to-outcome correlation — which rep behaviors actually predict closed-won.
- Data completeness — the percentage of active records with a verified email and phone. This is the metric most teams skip, and it quietly caps every other number.
That last one matters more than it looks. If 30% of your "engaged" accounts have no working contact method, your response-rate and conversion dashboards are computed on a fiction. Tracking response rate only makes sense when you know your contact data is real in the first place.
)
Does BI replace rep judgment, or support it?#
It supports it — and teams that forget this get burned. BI is a co-pilot, not the pilot. The model can tell you an account looks like a strong fit based on firmographics and engagement, but it cannot hear the hesitation in a champion's voice or know that the buyer's budget just got frozen.
The healthiest pattern is "data proposes, human disposes." BI surfaces a ranked list of accounts to prioritize, flags deals at risk, and recommends a next step. The rep applies context the data cannot see and makes the call. Over time, the rep's outcomes feed back into the model, and it gets sharper. Forrester's research on guided selling, summarized across its sales analytics coverage, consistently finds that adoption rises when BI augments the rep's existing workflow rather than replacing their judgment with a black box.
The failure mode is the opposite: a leadership team that treats the dashboard as gospel, ignores field reality, and over-corrects on a metric that was measuring noise. If your data completeness is low, your "insights" are noise wearing a suit.
How do you roll out business intelligence sales without it failing?#
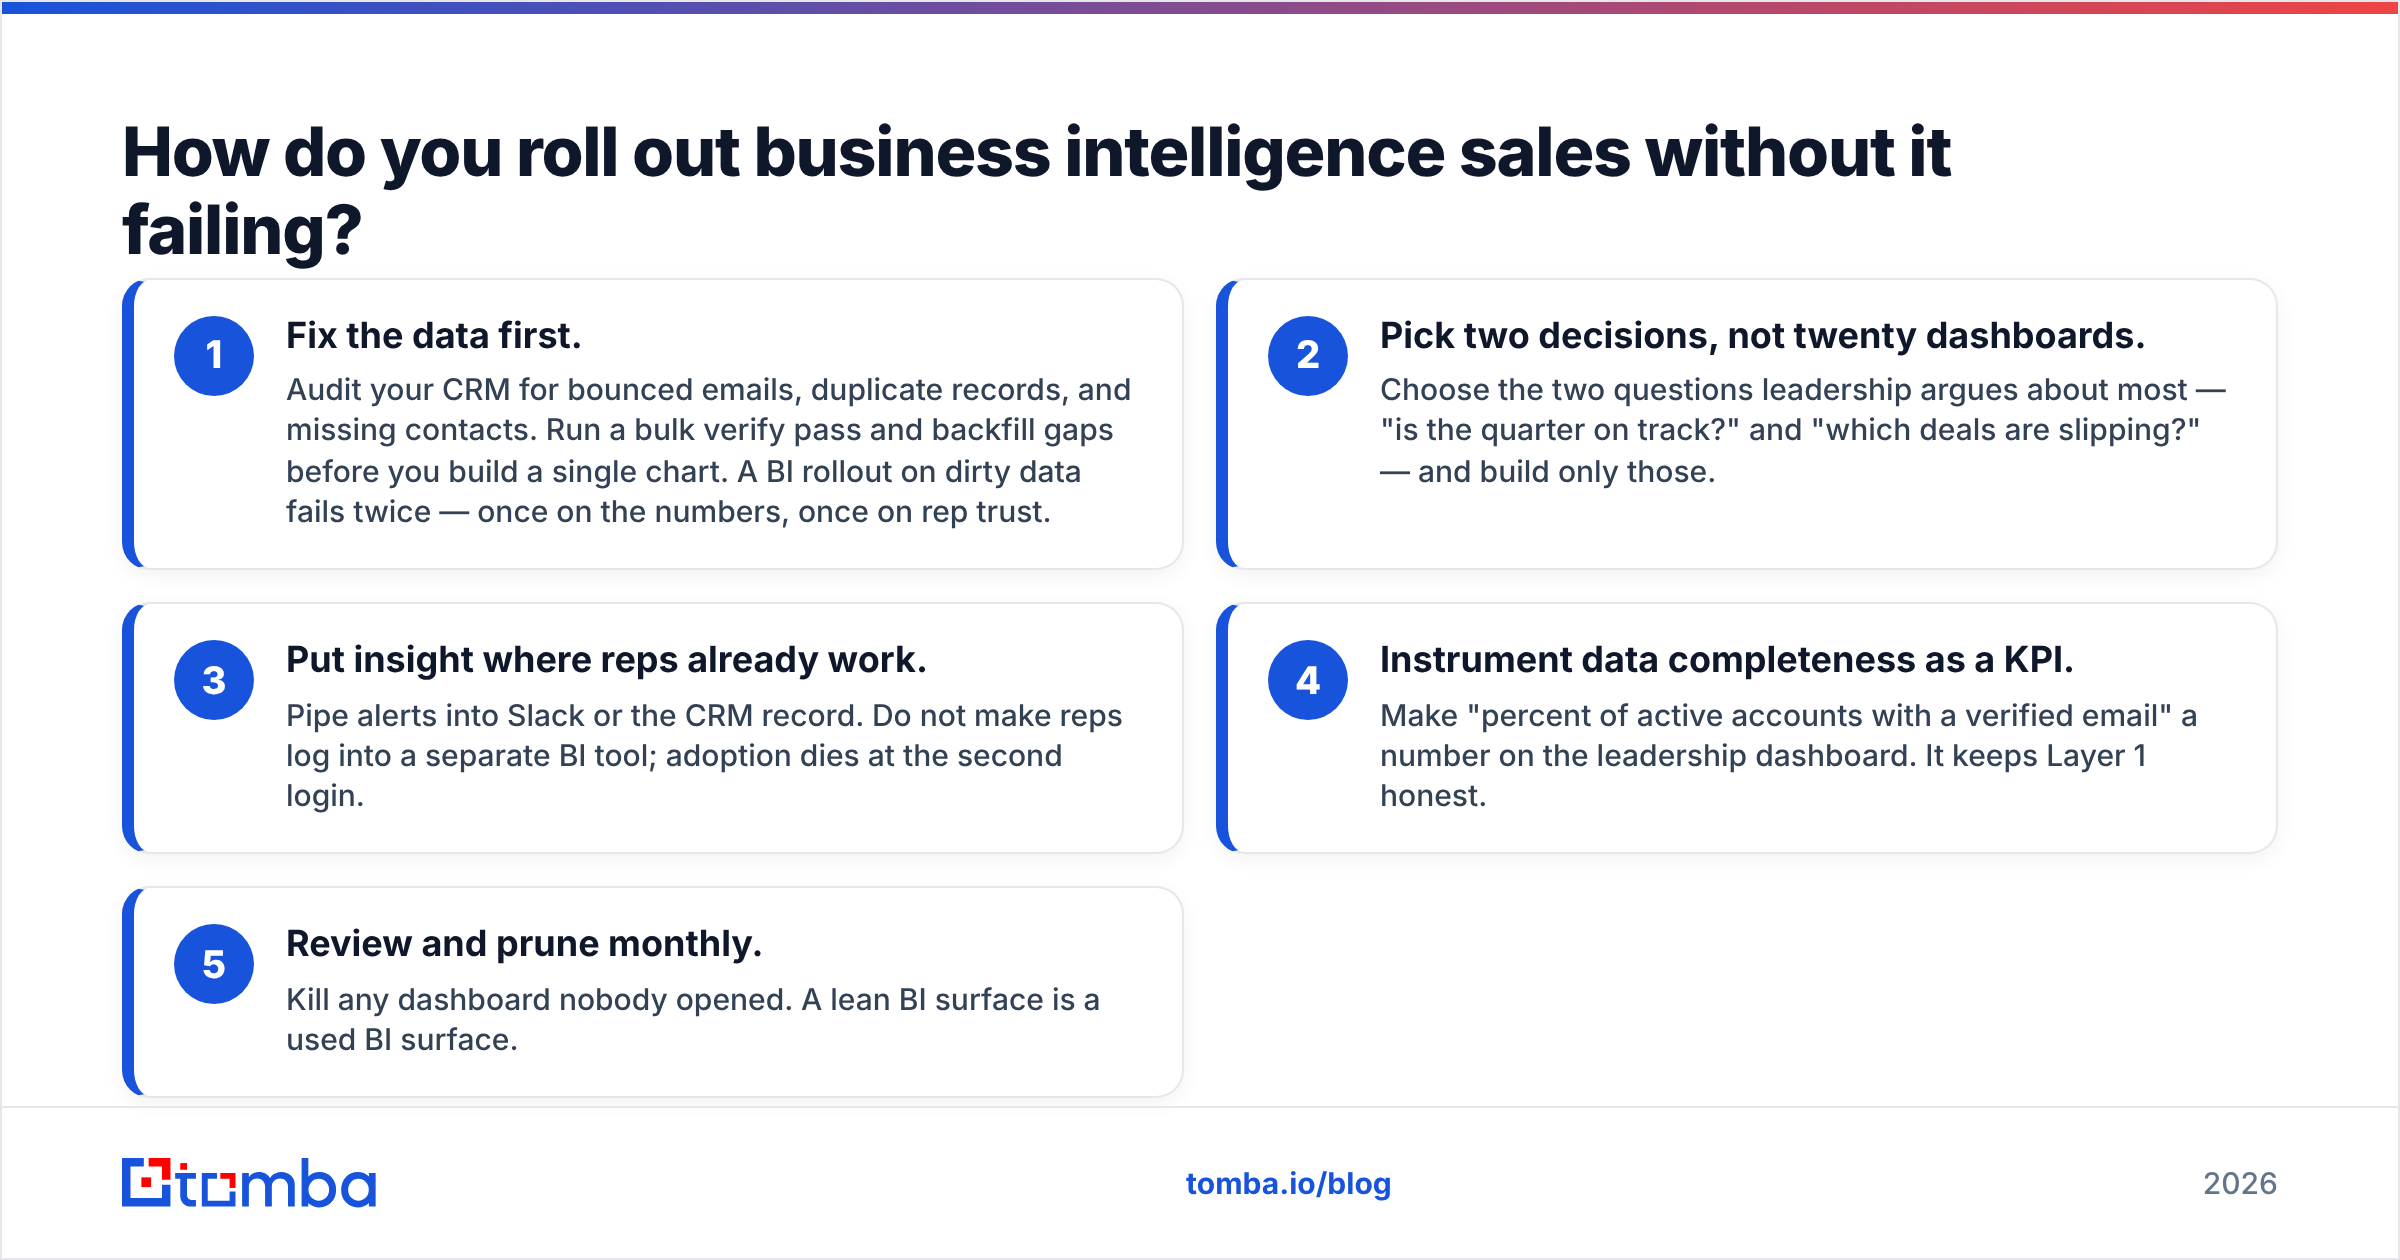
Most BI projects die from over-scoping. Here is a sequence that survives contact with a real sales floor.
- Fix the data first. Audit your CRM for bounced emails, duplicate records, and missing contacts. Run a bulk verify pass and backfill gaps before you build a single chart. A BI rollout on dirty data fails twice — once on the numbers, once on rep trust.
- Pick two decisions, not twenty dashboards. Choose the two questions leadership argues about most — "is the quarter on track?" and "which deals are slipping?" — and build only those.
- Put insight where reps already work. Pipe alerts into Slack or the CRM record. Do not make reps log into a separate BI tool; adoption dies at the second login.
- Instrument data completeness as a KPI. Make "percent of active accounts with a verified email" a number on the leadership dashboard. It keeps Layer 1 honest.
- Review and prune monthly. Kill any dashboard nobody opened. A lean BI surface is a used BI surface.
Notice that step one and step four are both about data quality, not analytics. That is deliberate. The cheapest way to make a BI investment pay off is to make sure the contacts feeding it are real — which is exactly where an email finder and verification layer earns its keep. You can compare plans on the Tomba pricing page to see how the data layer fits alongside whatever BI platform you choose.
What is the difference between BI tools and the data feeding them?#
This is the distinction that decides whether your investment works. BI tools — Tableau, Power BI, Looker — are renderers. They are extraordinarily good at joining, modeling, and visualizing whatever you give them. They are also completely indifferent to whether what you give them is true.
Your data layer is the source of truth. It decides whether a contact exists, whether an email will land, whether an account's firmographics are current. A beautiful Tableau dashboard built on a 60%-accurate contact list will confidently mislead you. A plain spreadsheet built on verified data will outperform it for decision-making every time.
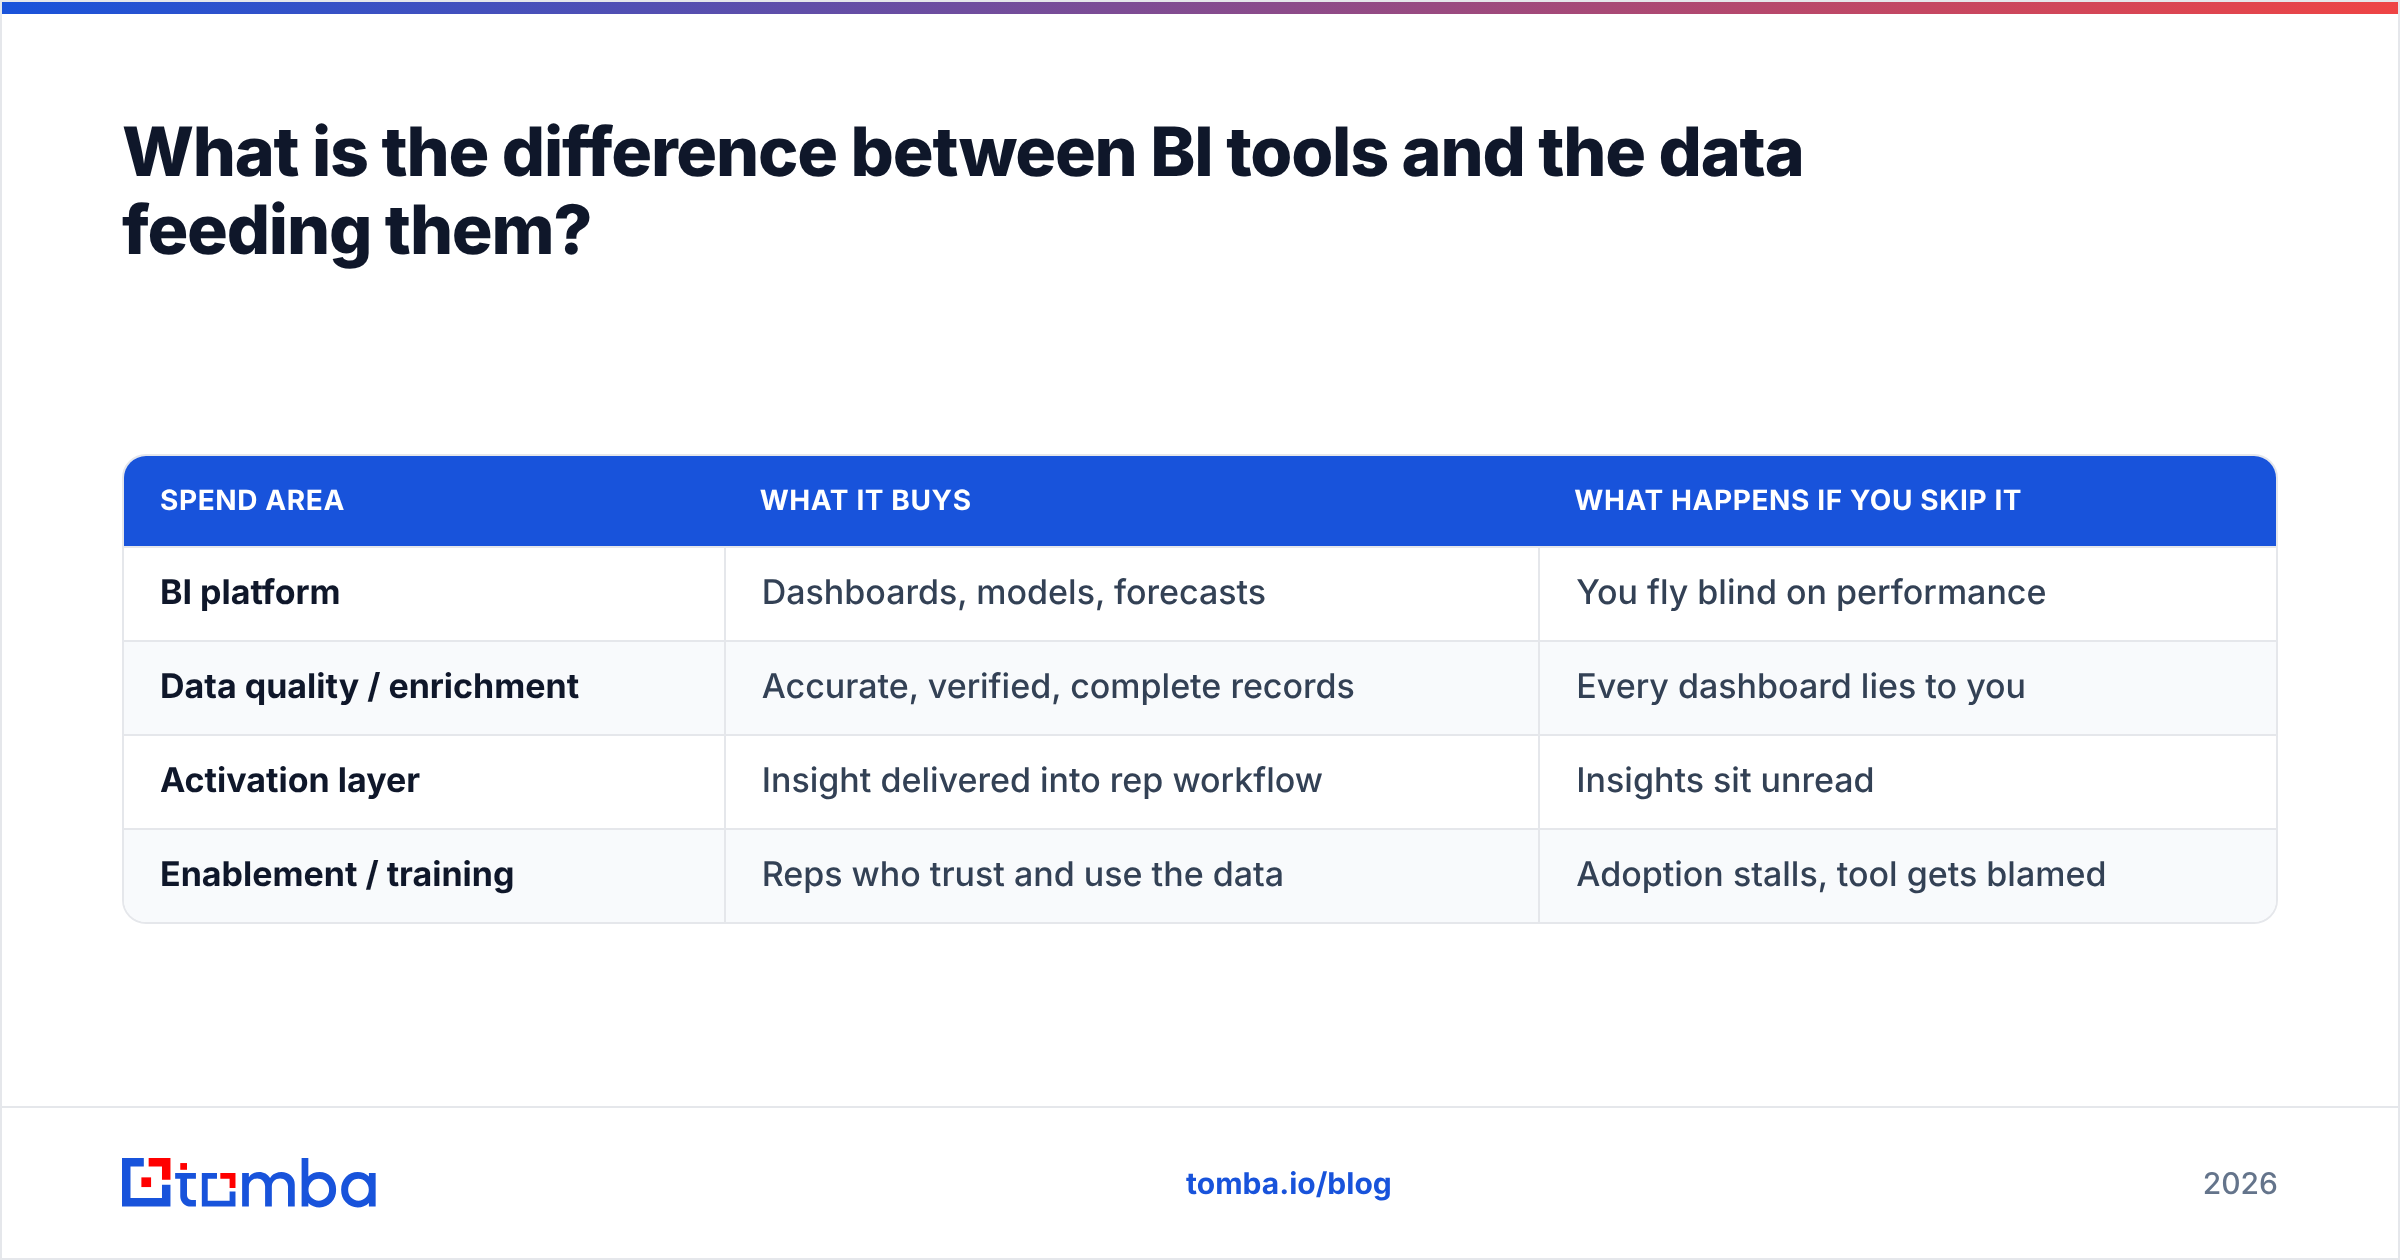
So when budgeting a business intelligence sales program, split the spend deliberately:
| Spend area | What it buys | What happens if you skip it |
|---|---|---|
| BI platform | Dashboards, models, forecasts | You fly blind on performance |
| Data quality / enrichment | Accurate, verified, complete records | Every dashboard lies to you |
| Activation layer | Insight delivered into rep workflow | Insights sit unread |
| Enablement / training | Reps who trust and use the data | Adoption stalls, tool gets blamed |
The teams that win in 2026 treat the data layer as a first-class line item, not an afterthought bolted on after the BI license is signed. You can review where contact data comes from on Tomba's data sources page to understand what "verified" actually means before you trust a number in a board deck.
Frequently asked questions#
Is business intelligence only for big sales teams? No. A five-person team running on a clean dataset and three good dashboards often out-decides a fifty-person team drowning in unverified records. BI scales down as well as up; the data quality requirement is constant at every size.
Do I need a data analyst to start? Not for the first phase. Native CRM analytics and Power BI templates get a small team to useful dashboards without a dedicated analyst. You bring in specialist analytics help when you outgrow the templates, not before.
What is the single most common reason BI sales projects fail? Bad input data. Reps stop trusting a dashboard the moment they catch it citing a bounced contact or a duplicate account, and once trust is gone the tool becomes shelfware.
Where Tomba fits in your BI stack#
Business intelligence sales lives or dies on the quality of the data underneath the dashboards. Before you point Tableau, Power BI, or your CRM's native analytics at your pipeline, make sure the contacts feeding those models are real. The Tomba Email Finder finds and verifies professional email addresses by domain, name, or company, so the records driving your forecasts, win-rate analysis, and territory decisions are accurate instead of optimistic. Start on the free tier with 25 searches a month, scale to the $49/mo Starter plan as your data needs grow, and give every dashboard you build a foundation it deserves. Clean data first — then let the BI do its job.
Ready to find emails that actually work?
Join 150,000+ professionals who stopped guessing and started sending. Free credits on signup — no credit card required.
Get the Tomba newsletter
Practical outbound tactics and product updates — once every two weeks.
About the author