CAC and LTV Meaning: The 2026 Guide to Unit Economics
CAC and LTV meaning, explained plainly: how to calculate each metric, what a healthy LTV:CAC ratio looks like in 2026, and how to lower CAC without slashing growth.

If you can't explain why your company spends money to win a customer and how much that customer is worth over time, you're flying blind. CAC and LTV are the two numbers that turn "we're growing" into "we're growing profitably." This guide breaks down the CAC and LTV meaning, the formulas, the benchmarks investors actually use in 2026, and the levers that move both.
TL;DR#
- CAC (Customer Acquisition Cost) is the total sales and marketing spend required to land one new customer.
- LTV (Lifetime Value) is the total gross profit a customer generates before they churn.
- The LTV:CAC ratio is the single most-watched unit-economics metric — aim for 3:1 or higher in B2B SaaS.
- A CAC payback period under 12 months keeps cash flow healthy; under 6 months is elite.
- The fastest way to fix a broken ratio is usually to lower CAC with cleaner data and better targeting, not to chase more LTV with discounts.
What is the CAC and LTV meaning in plain terms?#
Think of your business like a vending machine. CAC is the coin you put in — everything you spend to attract, qualify, and close a buyer. LTV is everything that machine pays back over the life of that relationship. If you keep feeding in dollars and getting back less than you put in, the machine is broken no matter how busy it looks.
Technically, CAC (Customer Acquisition Cost) is the fully loaded cost of acquiring a new customer over a period — ad spend, salaries, tooling, commissions, and overhead allocated to sales and marketing. LTV (Lifetime Value, sometimes CLV or CLTV) is the predicted gross margin a customer contributes across their entire tenure with you.
Neither number means much alone. A $900 CAC sounds scary until you learn each customer is worth $14,000. A $40 CAC sounds amazing until you learn customers churn in two months at a $30 margin. The relationship between the two is where the truth lives.
How do you calculate CAC?#
The basic formula is deliberately simple:
CAC = Total sales & marketing spend ÷ New customers acquired
If you spent $50,000 on sales and marketing in a quarter and signed 100 new customers, your CAC is $500.
The mistakes happen in what you include. A defensible CAC counts:
- Paid media and ad spend — Google, LinkedIn, retargeting, sponsorships.
- Salaries and commissions — the loaded cost of SDRs, AEs, and marketers, not just base pay.
- Tooling and software — your CRM, sequencing platform, data and enrichment subscriptions.
- Content and creative — agencies, freelancers, design, production.
- Overhead allocation — the slice of rent, management, and benefits attributable to go-to-market.
Leaving out salaries is the most common way teams flatter their CAC. A blended CAC that ignores headcount can understate the real number by 3–5x.

How do you calculate LTV?#
The standard B2B formula is:
LTV = (Average revenue per account × Gross margin %) ÷ Customer churn rate
Walk through it: say a customer pays $200/month ($2,400/year), your gross margin is 80%, and your annual churn is 20%. Annual gross profit per customer is $1,920. Divide by 0.20 churn and you get an LTV of $9,600.
The two inputs people get wrong:
- Use gross margin, not revenue. Revenue-based LTV overstates value because it ignores the cost of serving the customer. A customer paying you $10,000 who costs $4,000 to support is worth $6,000 in margin terms.
- Churn is the denominator that hurts. Small changes in churn swing LTV dramatically. Cutting churn from 20% to 10% doubles the LTV in the example above — from $9,600 to $19,200.
For newer companies without years of churn history, a conservative approach is to cap the projected lifetime at 3–5 years rather than assuming customers stay forever. Wikipedia's customer lifetime value entry covers the discounted-cash-flow variants if you want to get precise.
What is a good LTV:CAC ratio in 2026?#
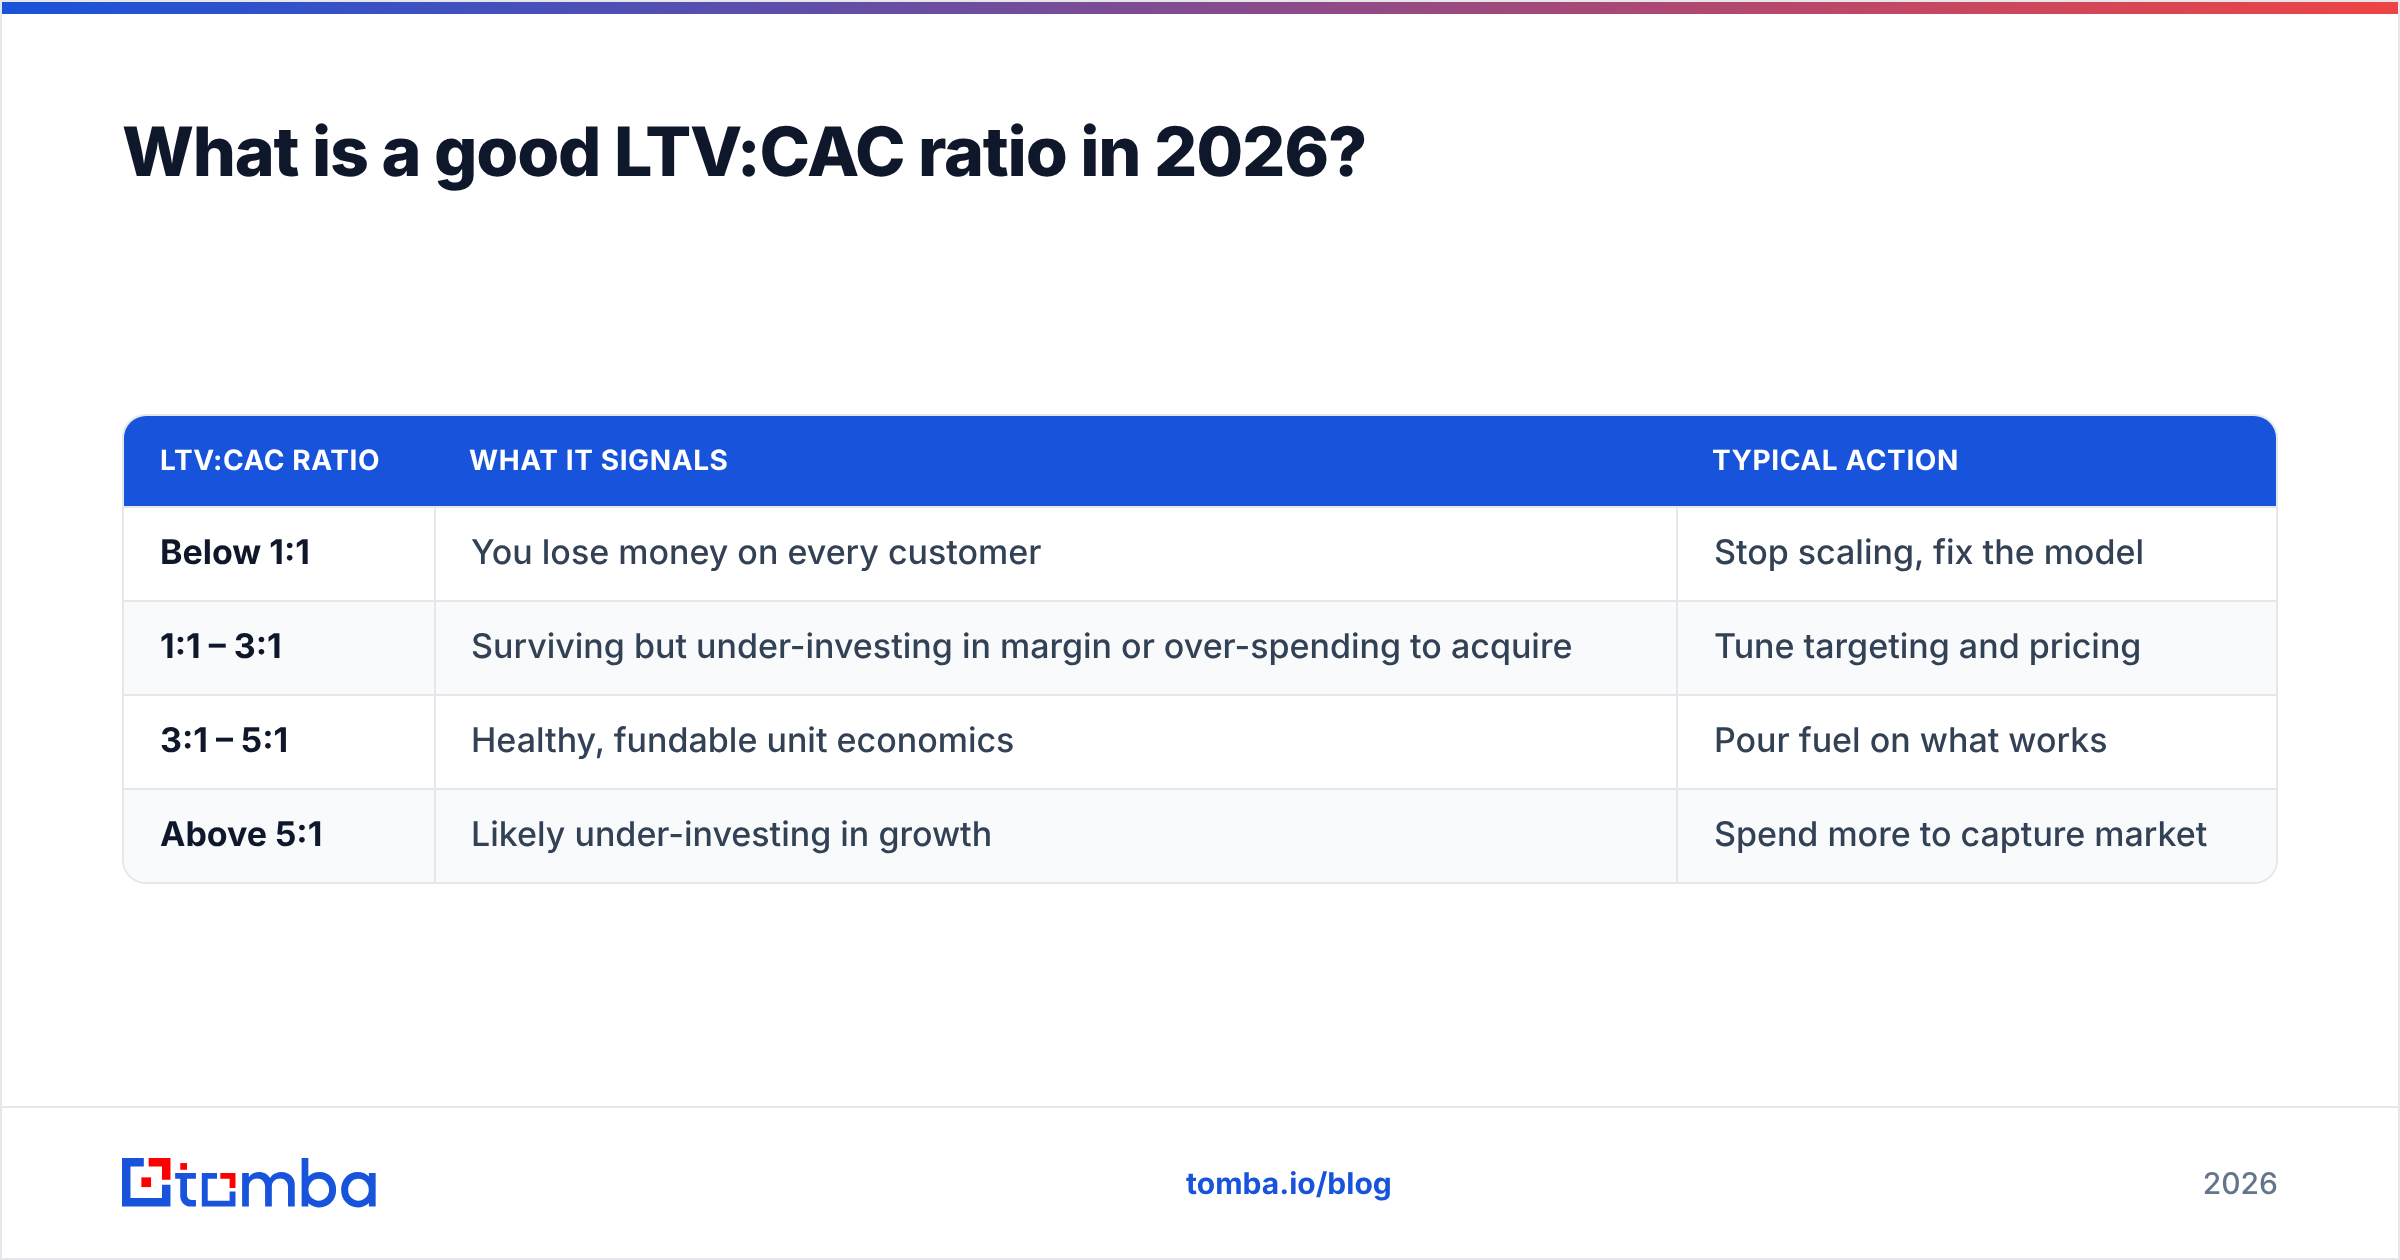
The benchmark is 3:1 — every dollar of acquisition cost should return at least three dollars of lifetime value. This rule of thumb has held up across SaaS for over a decade and remains the figure most investors and operators reference.
Here's how to read where you land:
| LTV:CAC ratio | What it signals | Typical action |
|---|---|---|
| Below 1:1 | You lose money on every customer | Stop scaling, fix the model |
| 1:1 – 3:1 | Surviving but under-investing in margin or over-spending to acquire | Tune targeting and pricing |
| 3:1 – 5:1 | Healthy, fundable unit economics | Pour fuel on what works |
| Above 5:1 | Likely under-investing in growth | Spend more to capture market |
A ratio that's too high isn't automatically a win. If you're sitting at 8:1, you're probably leaving growth on the table — you could afford to acquire far more customers and still stay profitable. The goal is balanced, not maximized.
What is CAC payback period and why does it matter more than ever?#
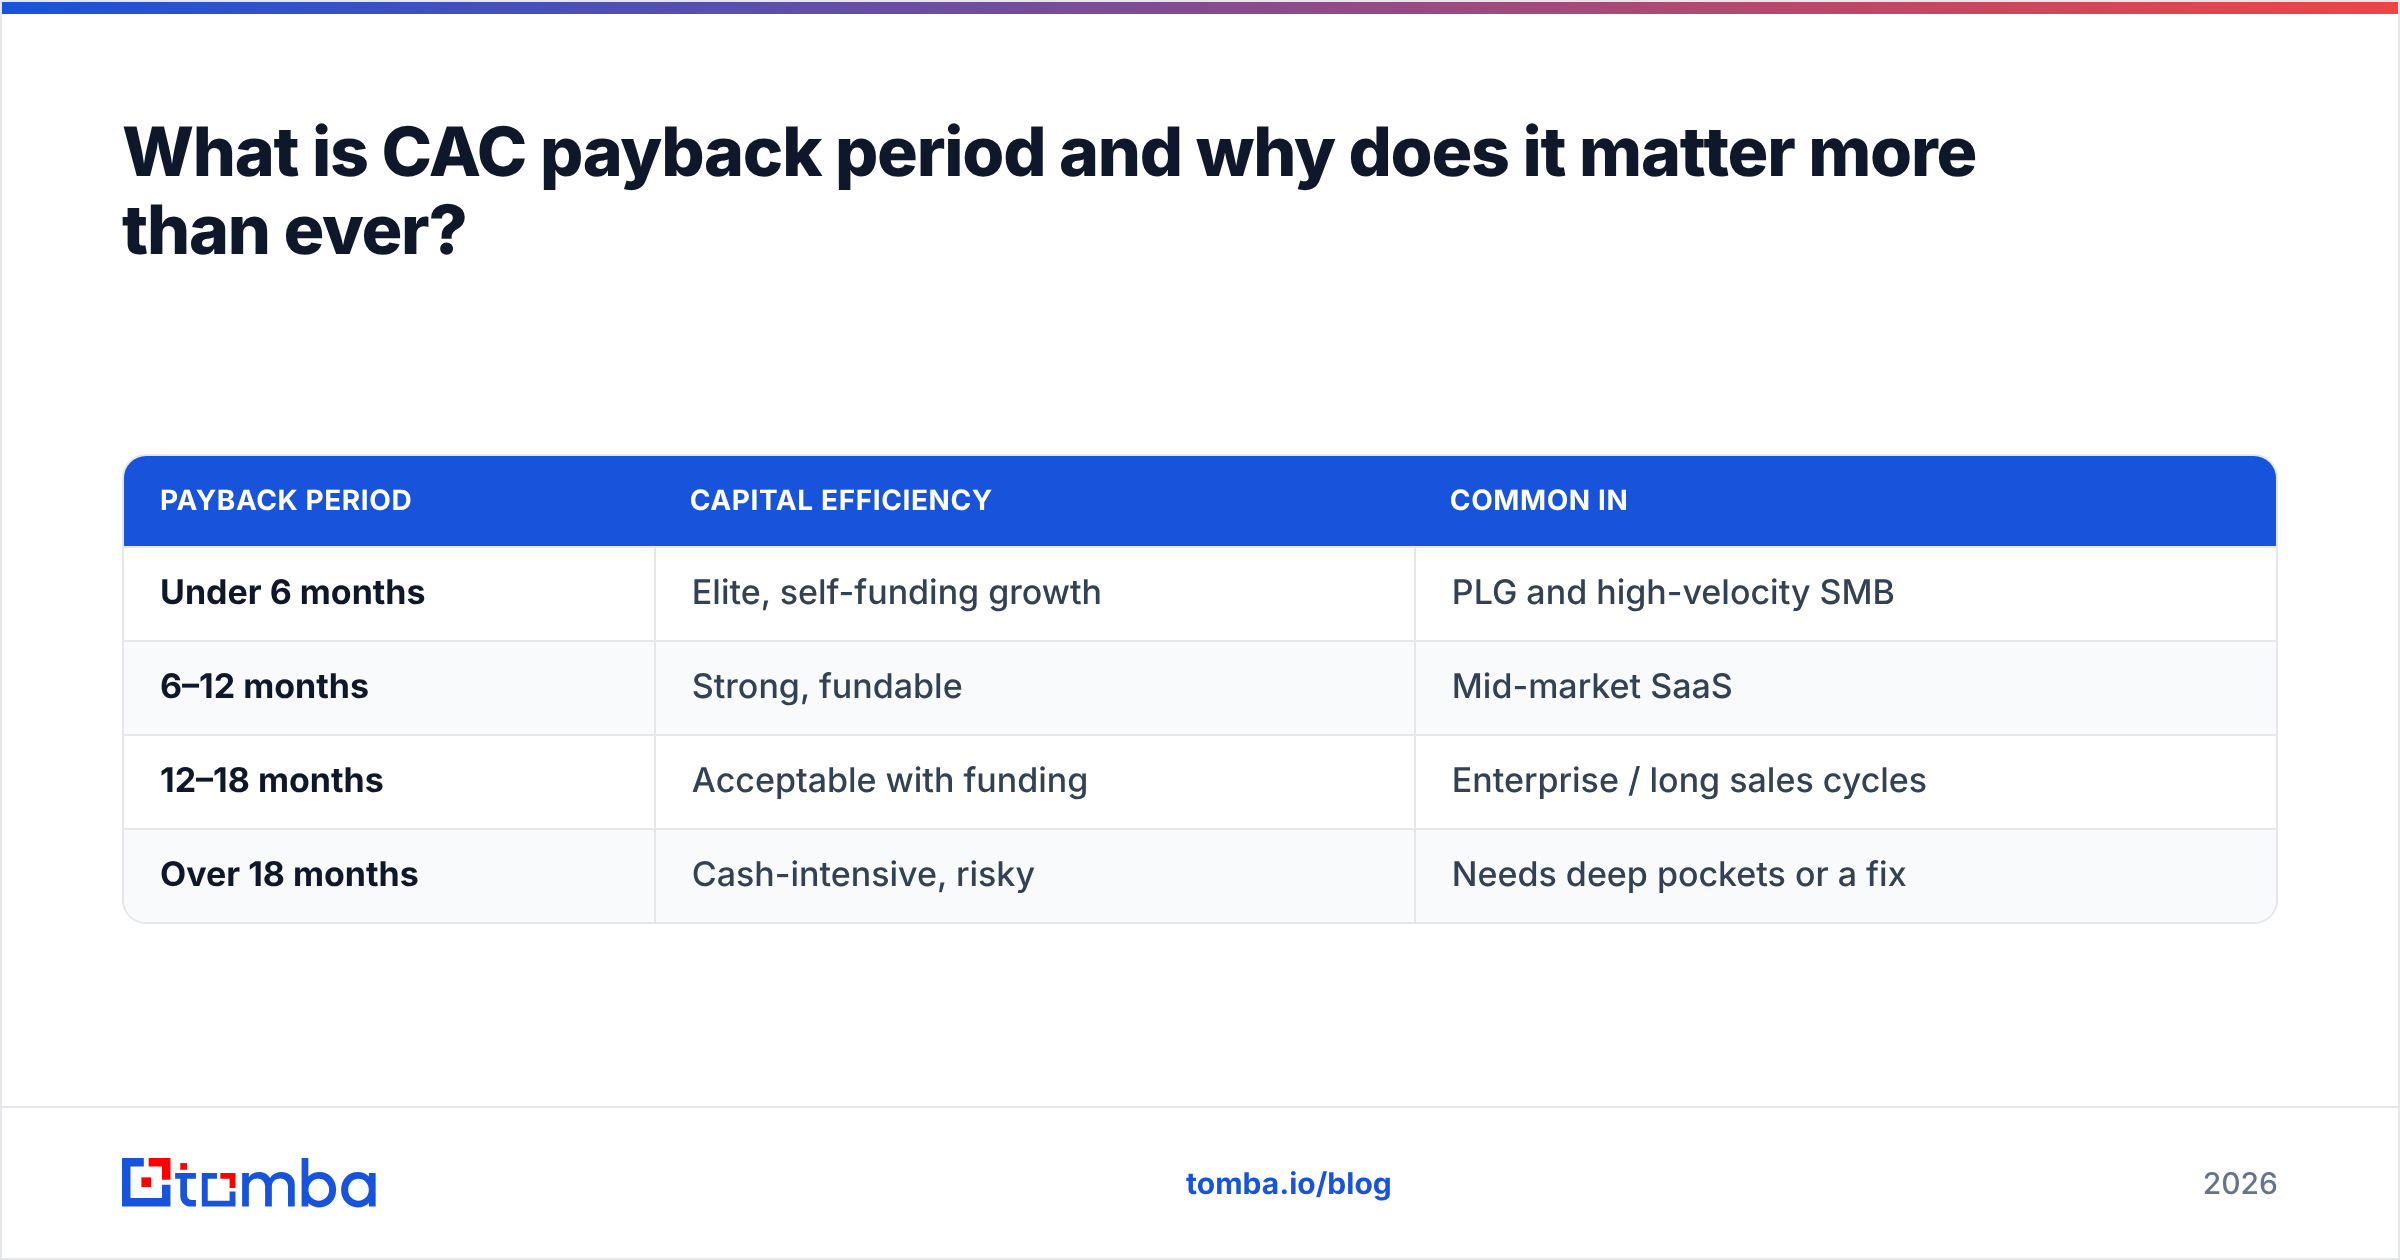
CAC payback period answers a cash-flow question the ratio can't: how many months until a customer pays back what you spent to acquire them?
CAC payback = CAC ÷ (Monthly revenue per customer × Gross margin %)
With a $500 CAC, $200 monthly revenue, and 80% margin, you recover your cost in roughly 3.1 months. In 2026's tighter capital environment, payback period has arguably overtaken raw LTV:CAC as the metric boards obsess over, because it directly governs how much cash you burn to grow.
| Payback period | Capital efficiency | Common in |
|---|---|---|
| Under 6 months | Elite, self-funding growth | PLG and high-velocity SMB |
| 6–12 months | Strong, fundable | Mid-market SaaS |
| 12–18 months | Acceptable with funding | Enterprise / long sales cycles |
| Over 18 months | Cash-intensive, risky | Needs deep pockets or a fix |
The shorter your payback, the faster you can recycle revenue into the next cohort of customers without raising more money. HubSpot's research on SaaS metrics and the broader operator community both treat sub-12-month payback as the line between "efficient" and "needs work."
Why is CAC usually the easier number to fix?#
Conclusion first: most teams should attack CAC before LTV, because CAC responds faster and you control it directly. LTV improvements — reducing churn, expanding accounts, raising prices — take quarters to show up. CAC can move in weeks once you fix targeting and data quality.
The biggest hidden CAC inflator is wasted outreach. When your sales team works from stale lists, guessed email addresses, and unverified contacts, three things happen:
- Reps burn hours on bounced emails and dead numbers instead of live conversations.
- Your sending domain reputation degrades, which quietly tanks email deliverability for the prospects who are real.
- Your cost per booked meeting climbs because the denominator — actual connections — keeps shrinking.
Cleaner data attacks all three at once. If you verify contacts before you ever hit send, you spend the same on tooling but convert a far higher share of your list, and your effective CAC drops without touching ad budgets or headcount.

How does better prospecting data lower CAC?#
Every wasted touch is CAC you'll never recover. Here's where data quality compounds in your favor:
- Higher connect rates. Verified emails and direct dials mean more conversations per hour of rep time. A phone finder that surfaces accurate mobile numbers can lift connect rates well above the industry's dismal cold-call average.
- Protected sender reputation. Running addresses through an email verifier before outreach keeps bounce rates low, which protects deliverability for your whole pipeline.
- Faster list building. Pulling role-based contacts with a domain search is dramatically cheaper than buying bloated, half-dead databases.
- Less rework. Data enrichment fills the gaps in your CRM so reps aren't manually researching every account, freeing hours back into selling.
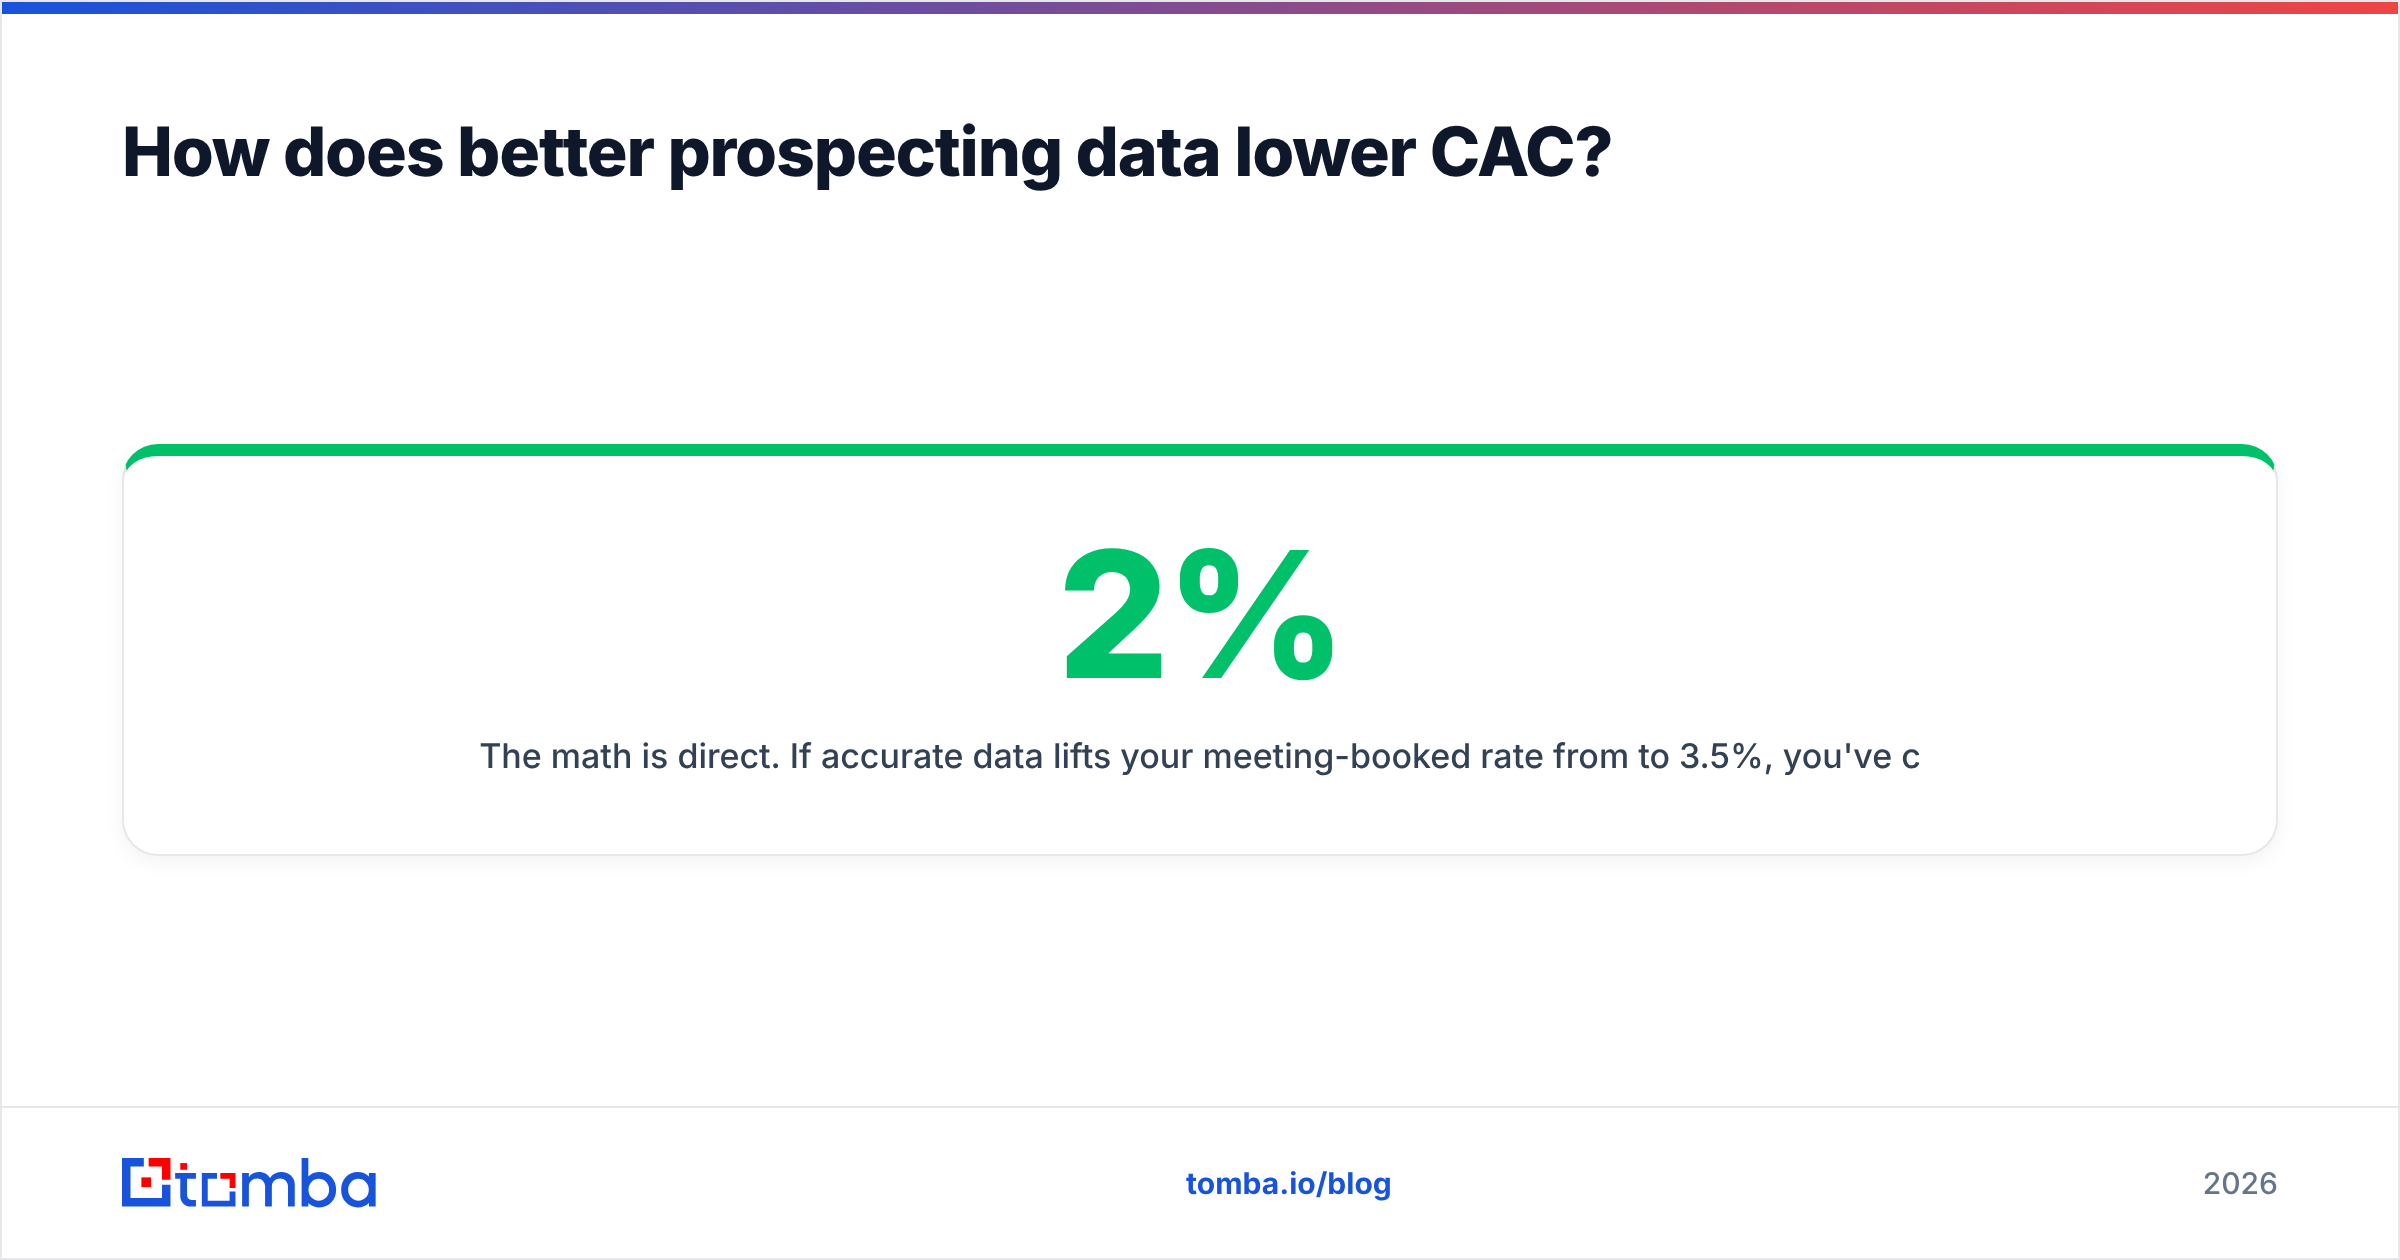
The math is direct. If accurate data lifts your meeting-booked rate from 2% to 3.5%, you've cut the cost of every meeting by roughly 40% — and meetings are where CAC is actually spent.
CAC and LTV across business models: how do benchmarks differ?#
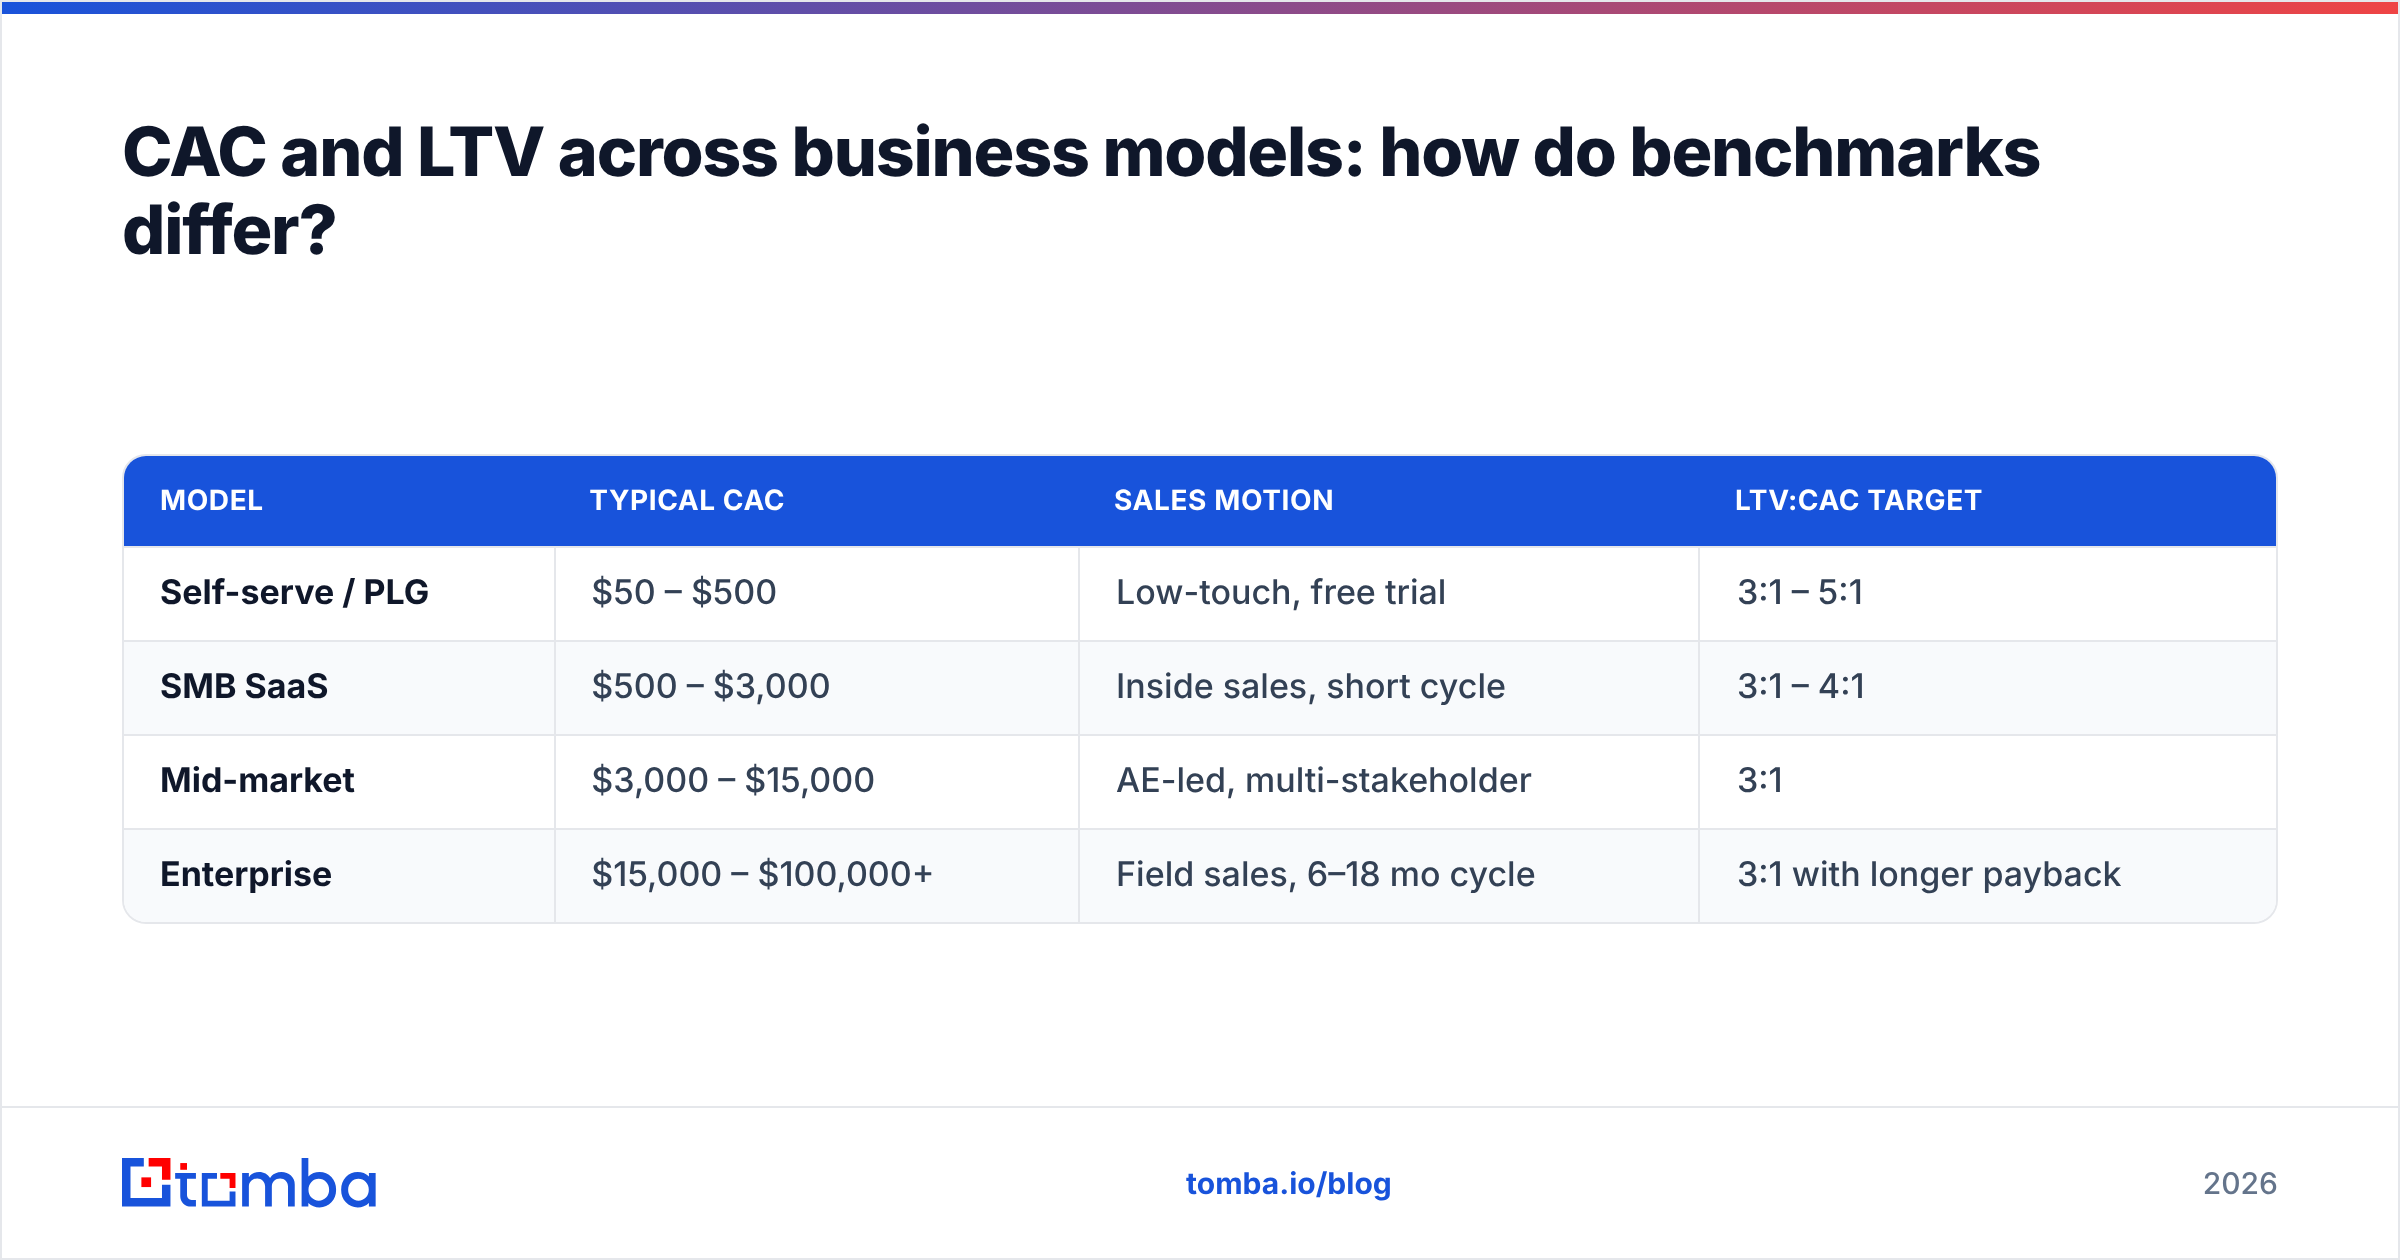
The "good" numbers shift depending on who you sell to. Use these as directional, not gospel:
| Model | Typical CAC | Sales motion | LTV:CAC target |
|---|---|---|---|
| Self-serve / PLG | $50 – $500 | Low-touch, free trial | 3:1 – 5:1 |
| SMB SaaS | $500 – $3,000 | Inside sales, short cycle | 3:1 – 4:1 |
| Mid-market | $3,000 – $15,000 | AE-led, multi-stakeholder | 3:1 |
| Enterprise | $15,000 – $100,000+ | Field sales, 6–18 mo cycle | 3:1 with longer payback |
Enterprise tolerates a higher CAC because LTV is enormous and contracts are sticky. PLG demands a low CAC because each customer is worth less individually. The ratio target stays roughly constant; the absolute dollars do not.
What are the most common CAC and LTV mistakes?#
- Blending paid and organic. Report a separate paid CAC and blended CAC. Hiding paid spend inside a blended number masks channels that are quietly unprofitable.
- Ignoring time lag. Spend in Q1 often closes deals in Q2. Match cohorts to the period they were acquired, not the period you spent.
- Counting revenue as LTV. Always use gross margin. This is the single most frequent inflation error.
- Assuming infinite lifetimes. Cap projections at a realistic horizon for early-stage companies.
- Optimizing the ratio in isolation. A great LTV:CAC with an 18-month payback can still starve you of cash. Watch both.
How do you build a CAC and LTV dashboard?#
You don't need a data team to start. Track these five inputs monthly and the rest is arithmetic:
- Total S&M spend (fully loaded, including salaries).
- New customers acquired in the period.
- Average revenue per account (monthly or annual, stay consistent).
- Gross margin %.
- Churn rate (monthly or annual — match your ARPA period).
Feed those into the formulas above and you have CAC, LTV, the ratio, and payback. Connecting your CRM to a clean enrichment source keeps inputs 3 and 5 accurate, since stale account data corrupts both ARPA and churn calculations. For a deeper framework on operationalizing these metrics across teams, revenue operations is the discipline that owns the dashboard end to end.
Review it as a trend, not a snapshot. A single month's CAC spike during a campaign launch is noise; three rising months is a signal.
Frequently asked questions#
Is LTV the same as revenue? No. LTV uses gross margin, so it reflects profit, not top-line revenue. Using revenue overstates customer value.
What's a bad LTV:CAC ratio? Anything below 1:1 means you lose money per customer. Between 1:1 and 3:1 you're under-earning. The 3:1 benchmark is the healthy floor.
How often should I recalculate CAC? Monthly for fast-moving teams, quarterly at minimum. Recalculate immediately after any major change in spend, pricing, or sales headcount.
Does lowering CAC hurt growth? Not if you lower it by improving efficiency — better targeting, cleaner data, higher connect rates. It only hurts growth if you simply cut spend without fixing conversion.
Bring your CAC down with cleaner data#
The cheapest lever on your CAC isn't your ad budget — it's the quality of the contacts your team works every day. Stop paying reps to chase bounced emails and dead numbers. The Tomba Email Finder surfaces verified professional emails by name, company, or domain, so every outreach touch lands on a real person. Pair it with the built-in email verifier to protect your sender reputation, and start free with 25 searches a month — see Tomba pricing when you're ready to scale. Lower the cost of every conversation, and your LTV:CAC ratio fixes itself.
// get started
Find, verify and enrich your first contacts today
Start on the free plan with 25 searches a month, then scale when your team is ready.
Free plan · No credit card required · GDPR & CCPA
// about the author