CAC LTV Ratio in 2026: The B2B SaaS Benchmark Guide
Learn what a healthy CAC LTV ratio looks like in 2026, how to calculate it, the benchmarks that matter, and the levers that move it fastest.
The CAC LTV ratio is the single number that tells you whether your growth engine makes money or burns it. Get it right and every dollar of marketing spend compounds. Get it wrong and you scale yourself into a cash crisis. This guide breaks down how to calculate it, what counts as healthy in 2026, and the levers that move it fastest.
TL;DR#
- CAC LTV ratio compares the lifetime value of a customer (LTV) to the cost of acquiring them (CAC). The healthy benchmark for B2B SaaS is 3:1 or higher.
- A ratio of 1:1 means you lose money; 5:1 or above often means you are under-investing in growth and leaving market share on the table.
- CAC payback period (months to recover acquisition cost) matters as much as the raw ratio — aim for under 12 months.
- The fastest way to improve the ratio is rarely cutting ad spend; it is tightening targeting, raising data accuracy, and reducing churn.
- Bad contact data quietly inflates CAC. Verified, accurate prospect data is one of the cheapest levers you control.
What is the CAC LTV ratio?#
The CAC LTV ratio is the relationship between two numbers: how much a customer is worth over their lifetime (LTV, sometimes written LTV:CAC or CLV:CAC) and how much you spent to win them (CAC). Think of it like a vending machine — you want to know how many dollars come out for every dollar you put in. A 3:1 ratio means each customer returns three dollars in lifetime value for every dollar of acquisition cost.
This ratio is the heartbeat of revenue operations. It connects marketing spend, sales efficiency, pricing, and retention into one figure that a CFO, a board, and a growth team can all argue about productively. When investors evaluate a SaaS business, the LTV:CAC ratio is usually one of the first three numbers they ask for.
Two definitions you need before going further:
- Customer Acquisition Cost (CAC) — total sales and marketing spend over a period divided by the number of new customers acquired in that period.
- Lifetime Value (LTV) — the total gross-margin revenue you expect from an average customer before they churn.

How do you calculate CAC and LTV?#
Start with CAC. The formula is deliberately simple, but the inputs are where teams cheat:
CAC = (Total Sales + Marketing Spend) / New Customers Acquired
Include salaries, commissions, ad spend, tooling, and agency fees — not just media budget. If you only count ad spend, your CAC will look artificially low and your ratio artificially healthy.
LTV takes two steps. First find average customer lifetime, then multiply by gross-margin revenue:
LTV = (Average Revenue per Account × Gross Margin %) / Customer Churn Rate
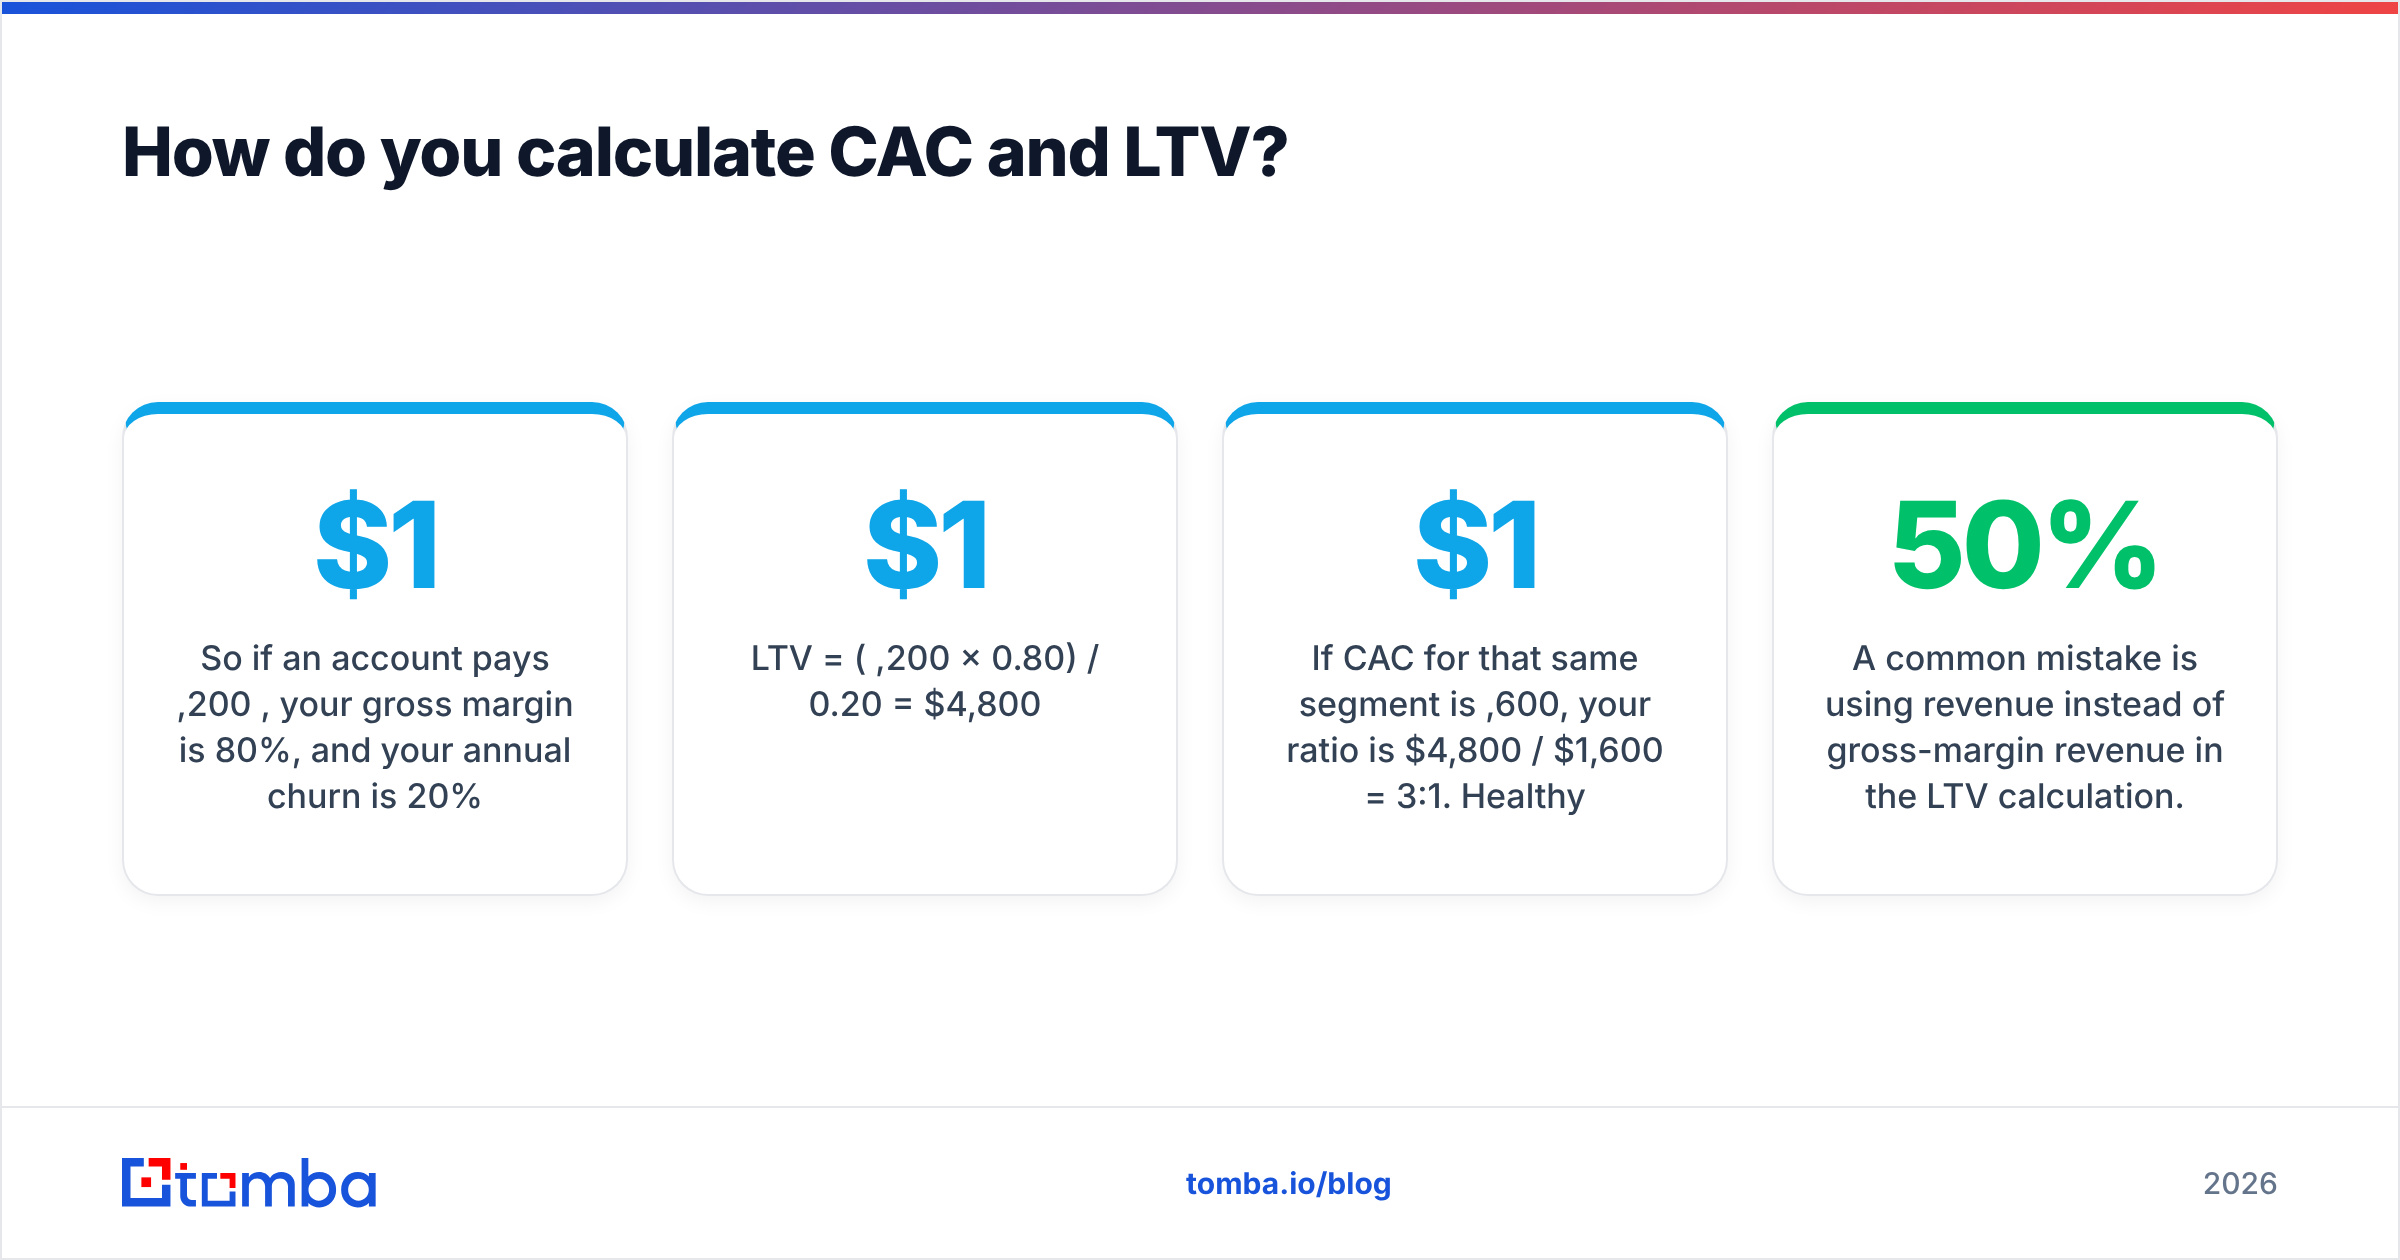
So if an account pays $1,200/year, your gross margin is 80%, and your annual churn is 20%:
LTV = ($1,200 × 0.80) / 0.20 = $4,800
If CAC for that same segment is $1,600, your ratio is $4,800 / $1,600 = 3:1. Healthy.
A common mistake is using revenue instead of gross-margin revenue in the LTV calculation. A business with 50% margins and one with 90% margins can show identical revenue LTV but wildly different real economics. Always margin-adjust.
What is a good CAC LTV ratio in 2026?#
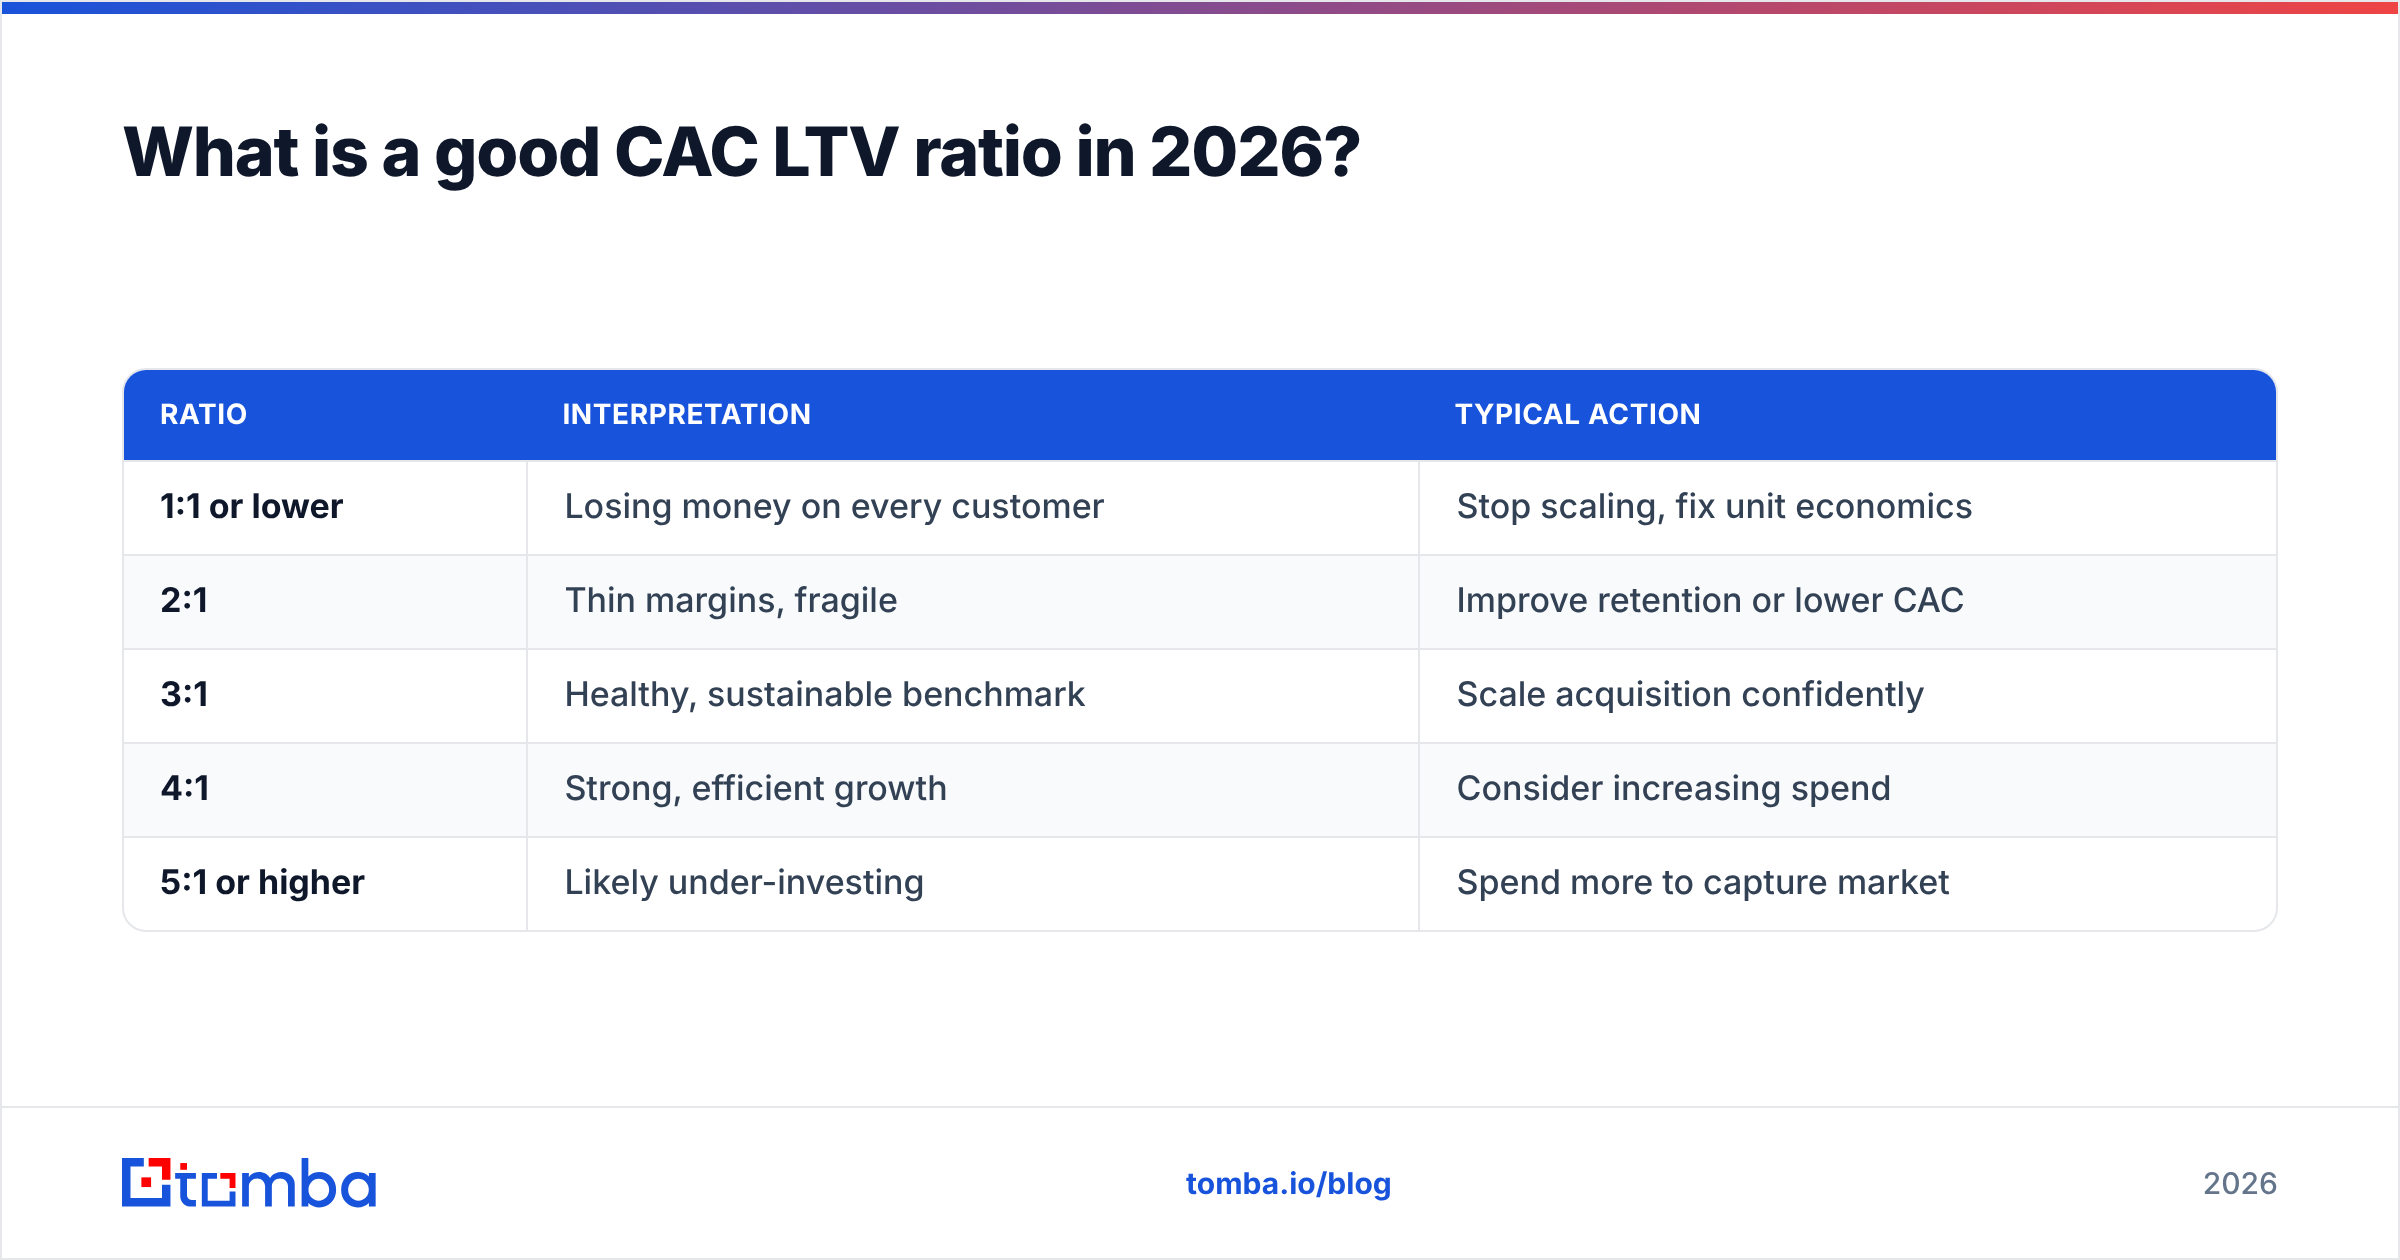
The short answer: aim for 3:1. The longer answer depends on your stage, motion, and capital position. Here is how the benchmarks break down across common B2B SaaS scenarios.
| Ratio | Interpretation | Typical action |
|---|---|---|
| 1:1 or lower | Losing money on every customer | Stop scaling, fix unit economics |
| 2:1 | Thin margins, fragile | Improve retention or lower CAC |
| 3:1 | Healthy, sustainable benchmark | Scale acquisition confidently |
| 4:1 | Strong, efficient growth | Consider increasing spend |
| 5:1 or higher | Likely under-investing | Spend more to capture market |
The counterintuitive insight is that a very high ratio is not automatically good. A 7:1 ratio often signals that you are too conservative with growth spend and a faster-moving competitor will take the market you could have owned. The goal is efficient growth, not maximum frugality.
Stage matters too. Seed-stage companies frequently run below 3:1 while they learn their motion — that is acceptable if payback is improving quarter over quarter. By Series B, investors expect 3:1 with a payback period under 12 months.
CAC payback period: the ratio's twin#
The LTV:CAC ratio hides timing. Two companies can both show 3:1, but one recovers its CAC in 6 months and the other in 30. The first can reinvest cash three times faster. That is why CAC payback period sits next to the ratio on every serious RevOps dashboard.
CAC Payback = CAC / (Monthly Recurring Revenue per Customer × Gross Margin %)
Under 12 months is the standard target for B2B SaaS. Under 6 months is exceptional. Above 18 months, you are financing growth with cash you may not have.
Why does bad data quietly wreck your ratio?#
Here is the part most ratio guides skip: your CAC is inflated by waste you cannot see on a dashboard. Bounced emails, wrong contacts, and duplicate records all cost real sales and marketing dollars that land in the CAC numerator while producing zero customers in the denominator.
Walk through the math. If 30% of your prospect list has invalid or outdated email addresses, then nearly a third of your outbound effort — SDR time, sequence sends, tooling cost — is spent reaching no one. That spend still counts toward CAC. Clean the list and your effective CAC drops without changing a single thing about your strategy.

This is why data quality is a unit-economics lever, not just an ops chore. Teams that invest in email verification and data enrichment routinely cut wasted touches and lift reply rates, which compresses CAC from both directions. According to research compiled by HubSpot, data decays at roughly 22–30% per year as people change jobs — so a list that was clean last year is leaking money today.
A few concrete sources of hidden CAC inflation:
- Bounced sends burn sender reputation, which lowers email deliverability and forces you to send more to reach the same inbox count.
- Wrong-contact outreach wastes the most expensive resource you have: rep selling time.
- Duplicate records double-count spend against accounts you already own.
- Stale firmographics push offers to companies that no longer fit your ICP.
How do you improve the CAC LTV ratio?#
You can move the ratio from either side of the fraction. Most teams reflexively try to cut CAC, but the highest-leverage moves often live on the LTV side, where small retention gains compound. Here are the levers ranked by typical impact.
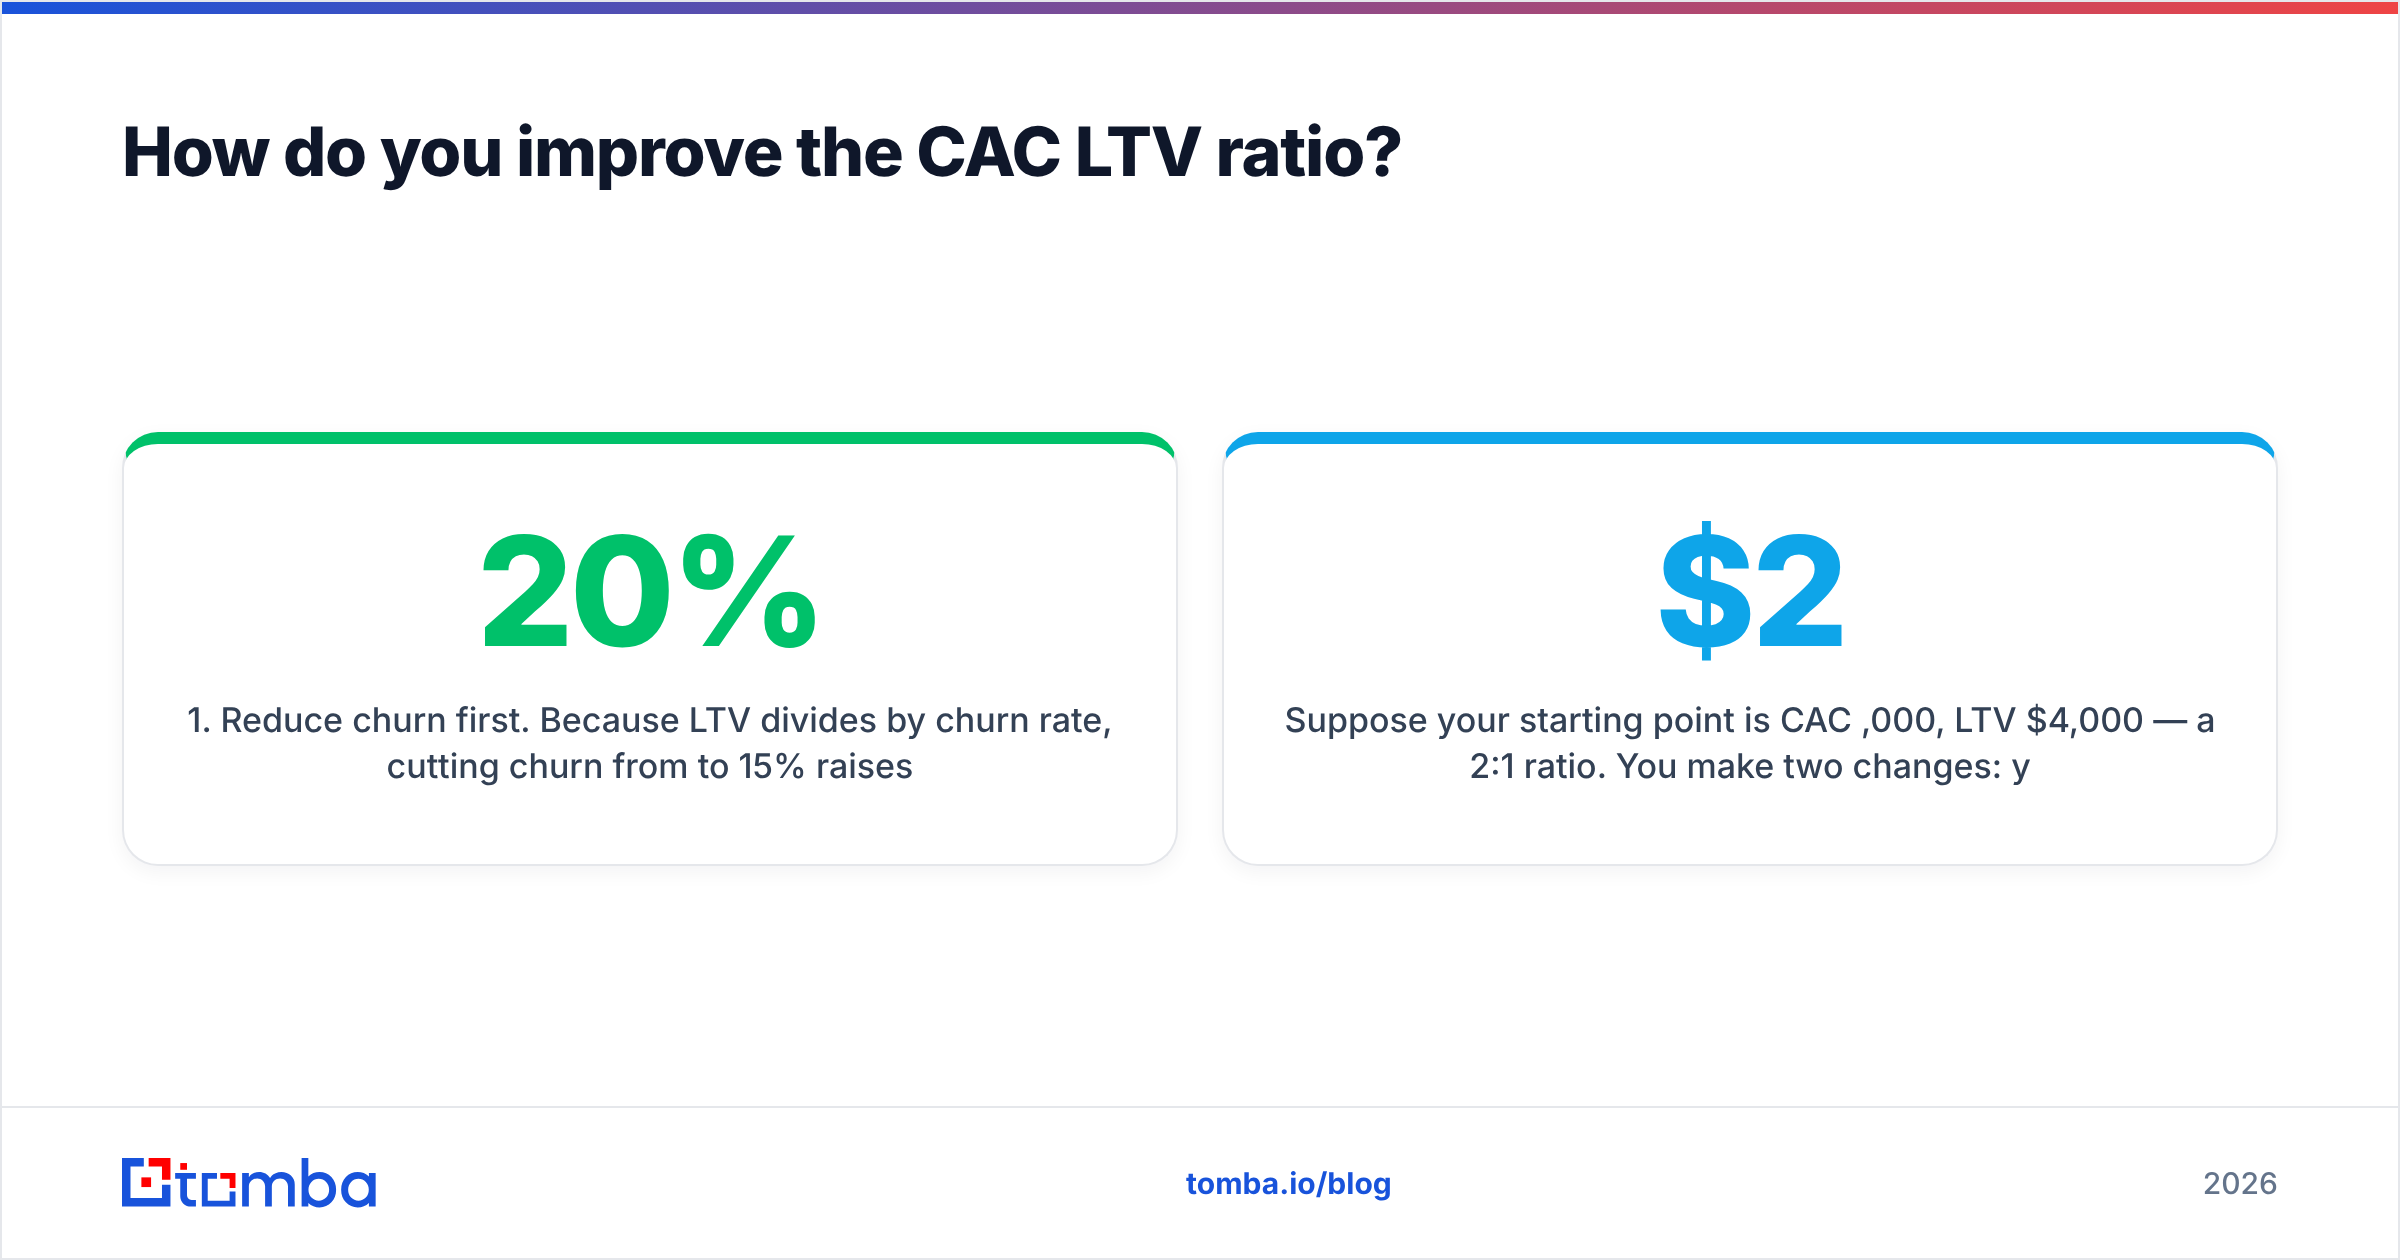
- Reduce churn first. Because LTV divides by churn rate, cutting churn from 20% to 15% raises LTV by a third — no new customers required. Onboarding, customer success, and product stickiness are ratio levers.
- Tighten ICP targeting. Spending the same budget on better-fit prospects raises conversion and lowers effective CAC. Precise domain search and accurate contact data make targeting sharper.
- Raise data accuracy. As covered above, verified contacts shrink wasted spend directly. This is often the fastest win because it requires no headcount.
- Expand revenue per account. Upsells, cross-sells, and tiered pricing lift the LTV numerator. Land-and-expand motions are ratio multipliers.
- Shorten the sales cycle. Faster deals mean lower fully-loaded CAC per customer and faster payback.
- Improve conversion at each funnel stage. Better messaging, social proof, and follow-up cadence convert more of the traffic you already pay for.
A worked example#
Suppose your starting point is CAC $2,000, LTV $4,000 — a 2:1 ratio. You make two changes: you cut churn from 25% to 20% (raising LTV to $5,000), and you clean your prospect data so 25% fewer touches are wasted (lowering CAC to $1,600). New ratio: $5,000 / $1,600 = 3.1:1. You moved from fragile to healthy without buying more leads or hiring a single rep.
CAC LTV ratio vs. other growth metrics#
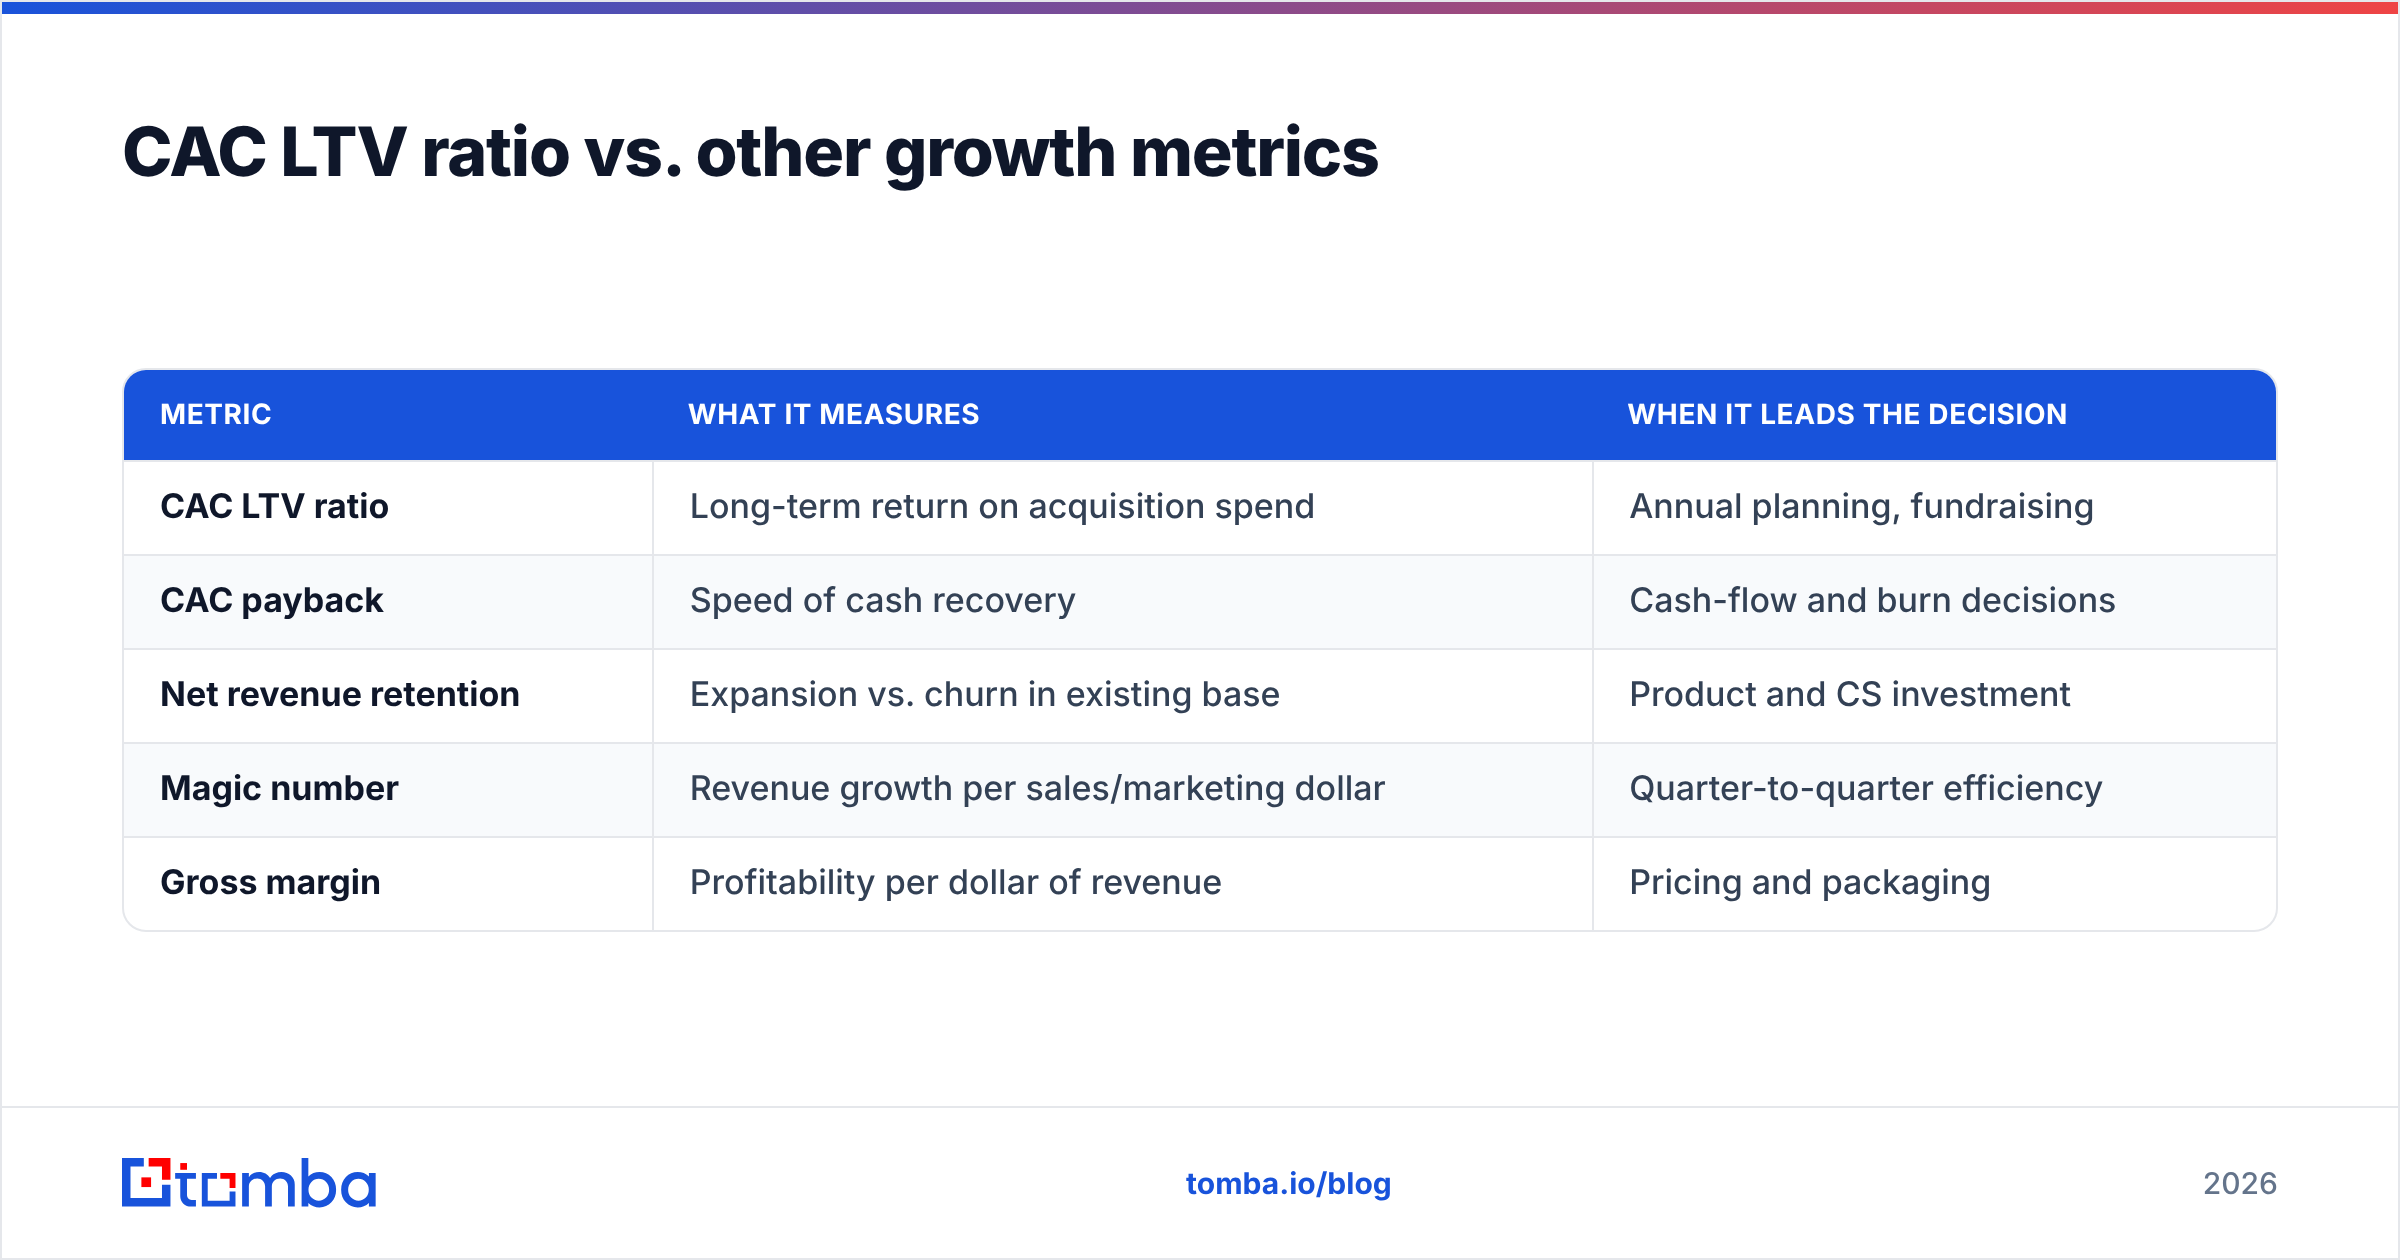
The ratio does not live alone. Here is how it relates to the other numbers on a GTM dashboard, and when each one should drive a decision.
| Metric | What it measures | When it leads the decision |
|---|---|---|
| CAC LTV ratio | Long-term return on acquisition spend | Annual planning, fundraising |
| CAC payback | Speed of cash recovery | Cash-flow and burn decisions |
| Net revenue retention | Expansion vs. churn in existing base | Product and CS investment |
| Magic number | Revenue growth per sales/marketing dollar | Quarter-to-quarter efficiency |
| Gross margin | Profitability per dollar of revenue | Pricing and packaging |
The ratio is the strategic north star; payback is the cash-flow guardrail; net revenue retention is the early warning system. A team that tracks only one of these is flying with half its instruments. Tools like G2 publish category benchmarks you can use to sanity-check where your numbers sit relative to peers.
How often should you measure it?#
Quarterly for board reporting, but monthly for your own steering. The inputs — spend, new customers, churn — all move month to month, and a ratio you only check at quarter-end can hide two bad months behind one good one. Build it into your RevOps cadence the way you would sales automation reporting: automated, refreshed, and visible to the whole revenue team.
Segment the ratio, too. A blended company-wide number can mask a channel that is bleeding money and one that is printing it. Calculate CAC LTV by channel, by segment, and by ICP tier. The averages lie; the segments tell the truth.
Common mistakes that distort the ratio#
- Counting revenue, not gross margin, in LTV — inflates the ratio for low-margin businesses.
- Excluding salaries from CAC — understates true acquisition cost.
- Using a blended ratio only — hides unprofitable channels.
- Ignoring payback period — a healthy ratio with 30-month payback can still sink a company on cash.
- Treating data quality as free — wasted outreach is real CAC you can recover.
The bottom line#
The CAC LTV ratio rewards two disciplines: efficient acquisition and durable retention. Aim for 3:1 with a payback under 12 months, measure it by segment monthly, and remember that the cheapest improvement usually comes from spending your existing budget on better, cleaner, more accurate prospect data rather than buying more of it.
That last point is where most teams have unclaimed upside. Every bounced send and wrong number is CAC with no customer attached. If you want to cut the waste at the source, start your outreach with verified, accurate contacts: the Tomba Email Finder helps you reach the right people the first time, and pairing it with built-in email verification keeps your CAC lean and your ratio healthy. Check the Tomba pricing plans — starting free with 25 searches a month, then $49/mo — and put your acquisition spend toward prospects who actually exist.
Ready to find emails that actually work?
Join 150,000+ professionals who stopped guessing and started sending. Free credits on signup — no credit card required.
Get the Tomba newsletter
Practical outbound tactics and product updates — once every two weeks.
About the author