CAC Ratio in 2026: How to Calculate and Benchmark It
Your CAC ratio tells you whether growth is paying for itself. Here's how to calculate it, what a healthy number looks like in 2026, and how to fix a bad one.
TL;DR
- The CAC ratio measures how much revenue you get back for every dollar spent acquiring a customer. The two versions that matter are the LTV:CAC ratio and the CAC payback period.
- A healthy SaaS LTV:CAC ratio sits around 3:1. CAC payback should land under 12 months for SMB and under 18-24 months for enterprise.
- A ratio above 5:1 usually means you are under-investing in growth, not winning. Below 1:1 means you lose money on every deal.
- The fastest lever most teams ignore: lowering CAC by fixing data quality and targeting, not just cutting ad spend.
- Track it by segment and cohort. A blended company-wide number hides the channels that are quietly bleeding cash.
What is the CAC ratio?#
The CAC ratio is the relationship between what it costs to win a customer and what that customer is worth. Think of it like a vending machine: you put a dollar in (sales and marketing spend) and you want to know how many dollars come back out, and how long you wait for them. If you keep feeding a machine that returns less than you insert, you go broke no matter how fast you feed it.
In practice, "CAC ratio" is shorthand for one of two metrics:
- LTV:CAC ratio — lifetime value of a customer divided by the cost to acquire them. This answers is each customer profitable?
- CAC payback period — the number of months of gross margin it takes to earn back the acquisition cost. This answers how long until I get my money back?
Both are downstream of one number: Customer Acquisition Cost (CAC) itself. Get CAC wrong and every ratio built on top of it lies to you. That is why this guide spends real time on the inputs, not just the formulas.

How do you calculate CAC and the CAC ratio?#
Start with CAC, then build the ratios on top.
Customer Acquisition Cost = total sales and marketing spend in a period ÷ new customers acquired in that period.
Include everything that touches acquisition: ad spend, salaries and commissions for sales and marketing staff, tooling, agency fees, and content costs. The most common mistake is leaving out salaries, which makes CAC look artificially low and your ratio look artificially great.
Then layer on the two ratios:
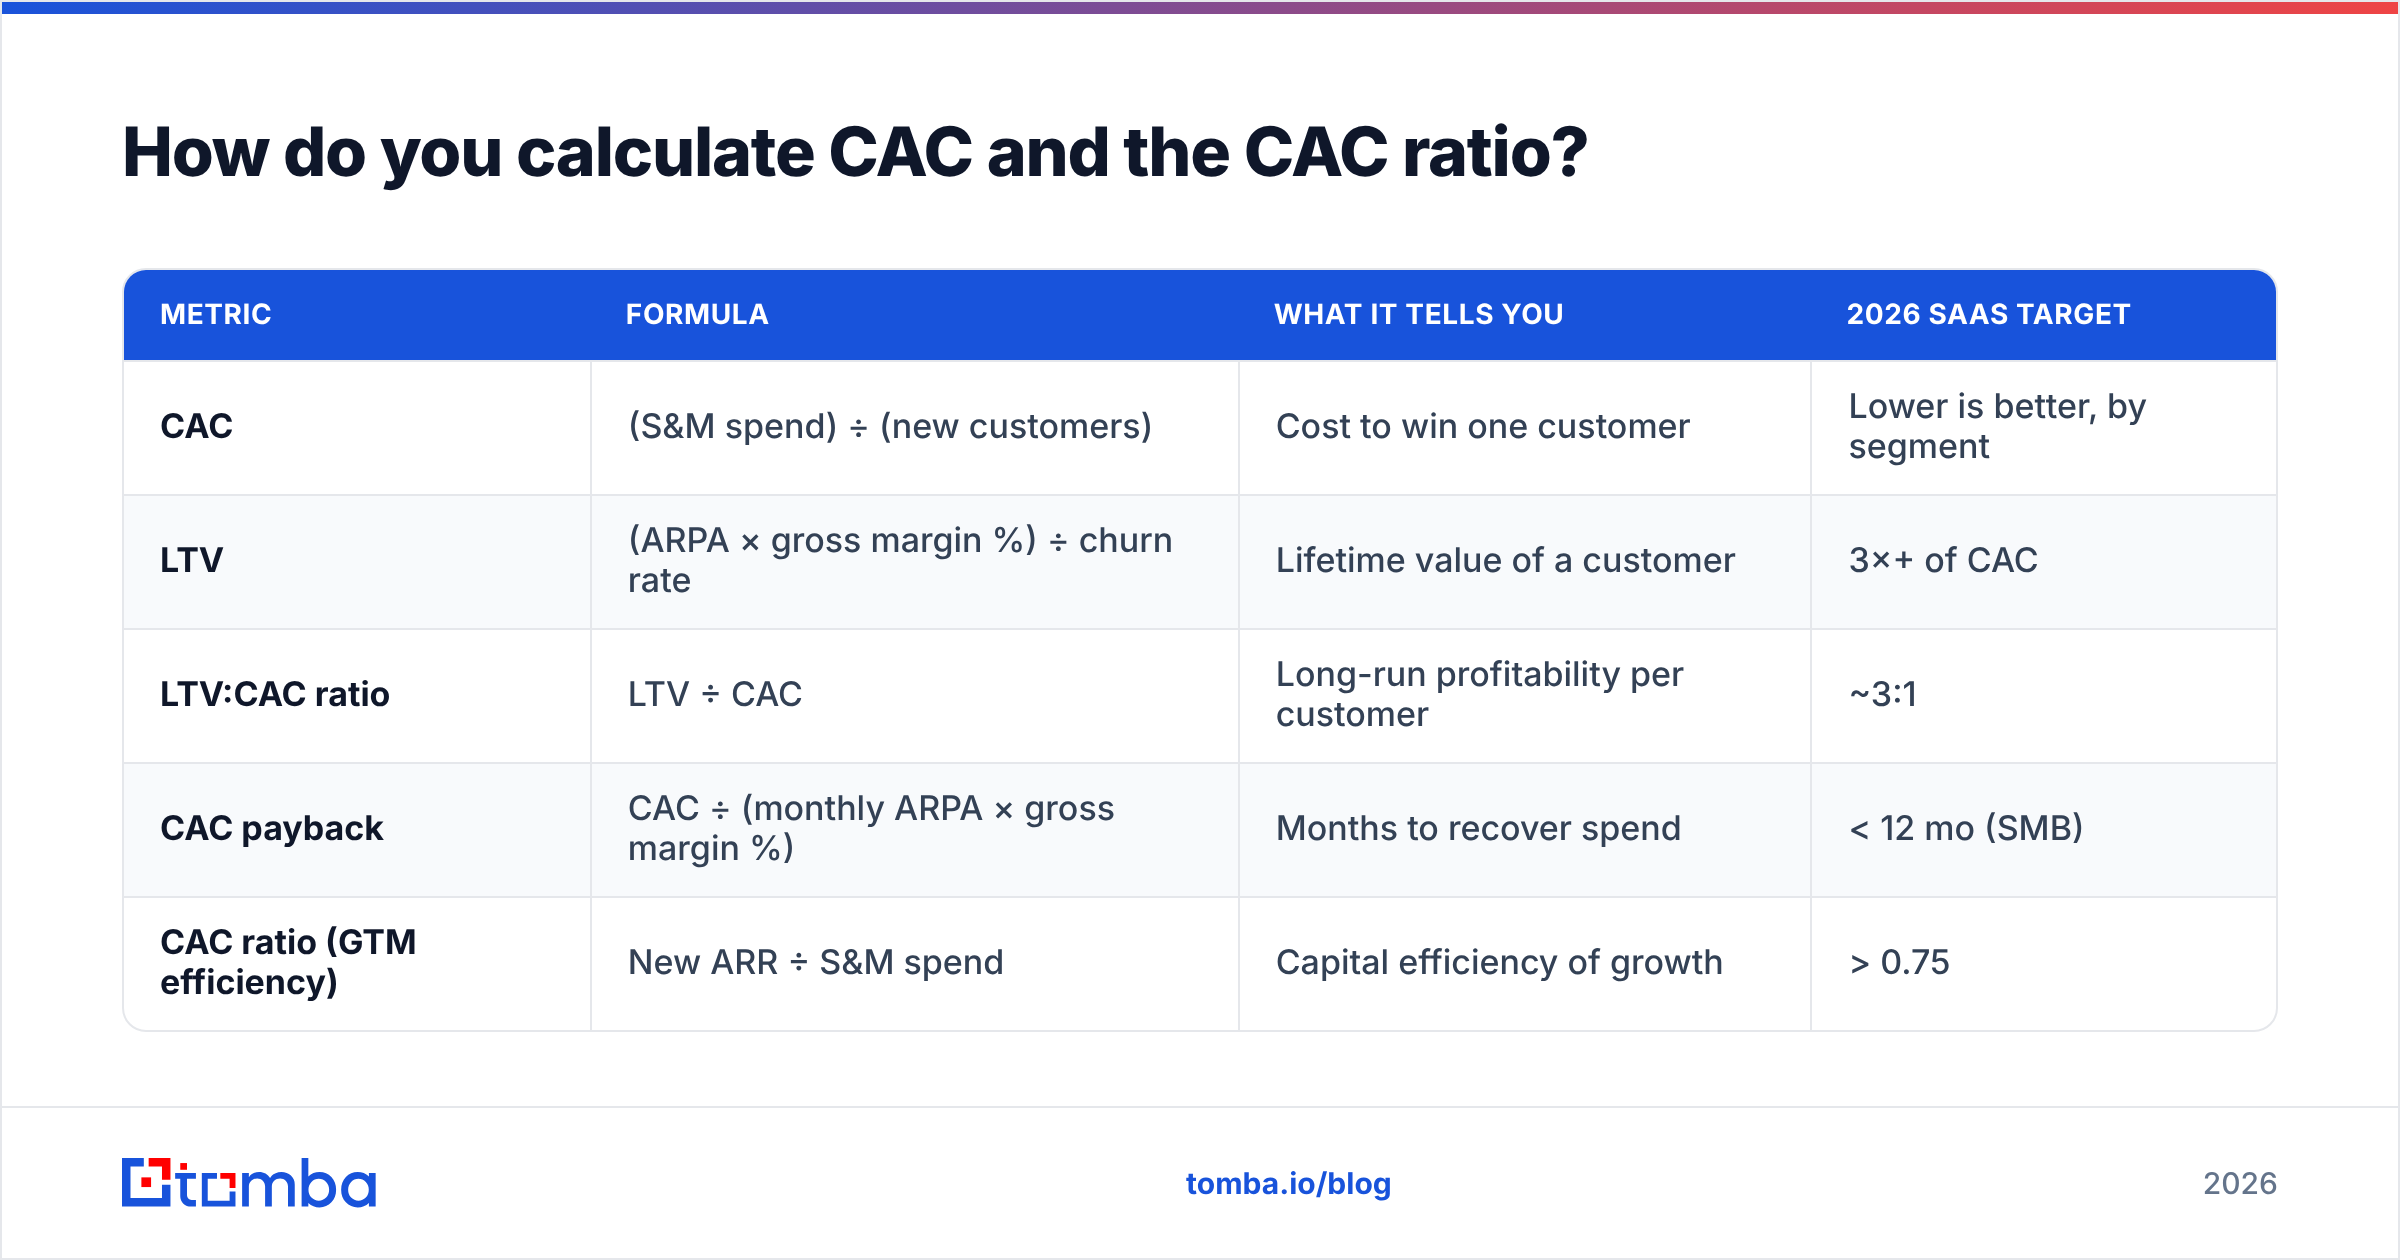
| Metric | Formula | What it tells you | 2026 SaaS target |
|---|---|---|---|
| CAC | (S&M spend) ÷ (new customers) | Cost to win one customer | Lower is better, by segment |
| LTV | (ARPA × gross margin %) ÷ churn rate | Lifetime value of a customer | 3×+ of CAC |
| LTV:CAC ratio | LTV ÷ CAC | Long-run profitability per customer | ~3:1 |
| CAC payback | CAC ÷ (monthly ARPA × gross margin %) | Months to recover spend | < 12 mo (SMB) |
| CAC ratio (GTM efficiency) | New ARR ÷ S&M spend | Capital efficiency of growth | > 0.75 |
A worked example. Say you spent $300,000 on sales and marketing last quarter and closed 100 new customers. Your CAC is $3,000. Each customer pays $200/month at an 80% gross margin, and your monthly churn is 2% (so average lifetime is 50 months).
- LTV = ($200 × 0.80) ÷ 0.02 = $8,000
- LTV:CAC = $8,000 ÷ $3,000 = 2.67:1
- CAC payback = $3,000 ÷ ($200 × 0.80) = 18.75 months
That 2.67:1 is slightly under the 3:1 benchmark, and an 18-month payback is on the slow side for an SMB motion. This company is growing, but its growth is only borderline efficient. The ratio just turned a vague worry ("are we spending too much?") into a specific, fixable gap.
What is a good CAC ratio in 2026?#
The conclusion first: aim for an LTV:CAC of 3:1 and a CAC payback under 12 months, then read the nuance below before you celebrate or panic.
Here is how to interpret the LTV:CAC ratio:
- Below 1:1 — you are burning money. Every customer costs more than they return. Stop scaling and fix the unit economics.
- 1:1 to 3:1 — workable but thin. You are growing, but margins are tight. Most of your effort should go to lowering CAC or raising retention.
- Around 3:1 — the healthy zone. You are recovering acquisition cost with room for overhead and profit. This is the number investors expect.
- 5:1 and above — you are likely under-investing. Counterintuitive, but a ratio this high usually means you could spend more on growth and still profit. You are leaving market share on the table.
CAC payback follows similar logic, but benchmarks shift by who you sell to:
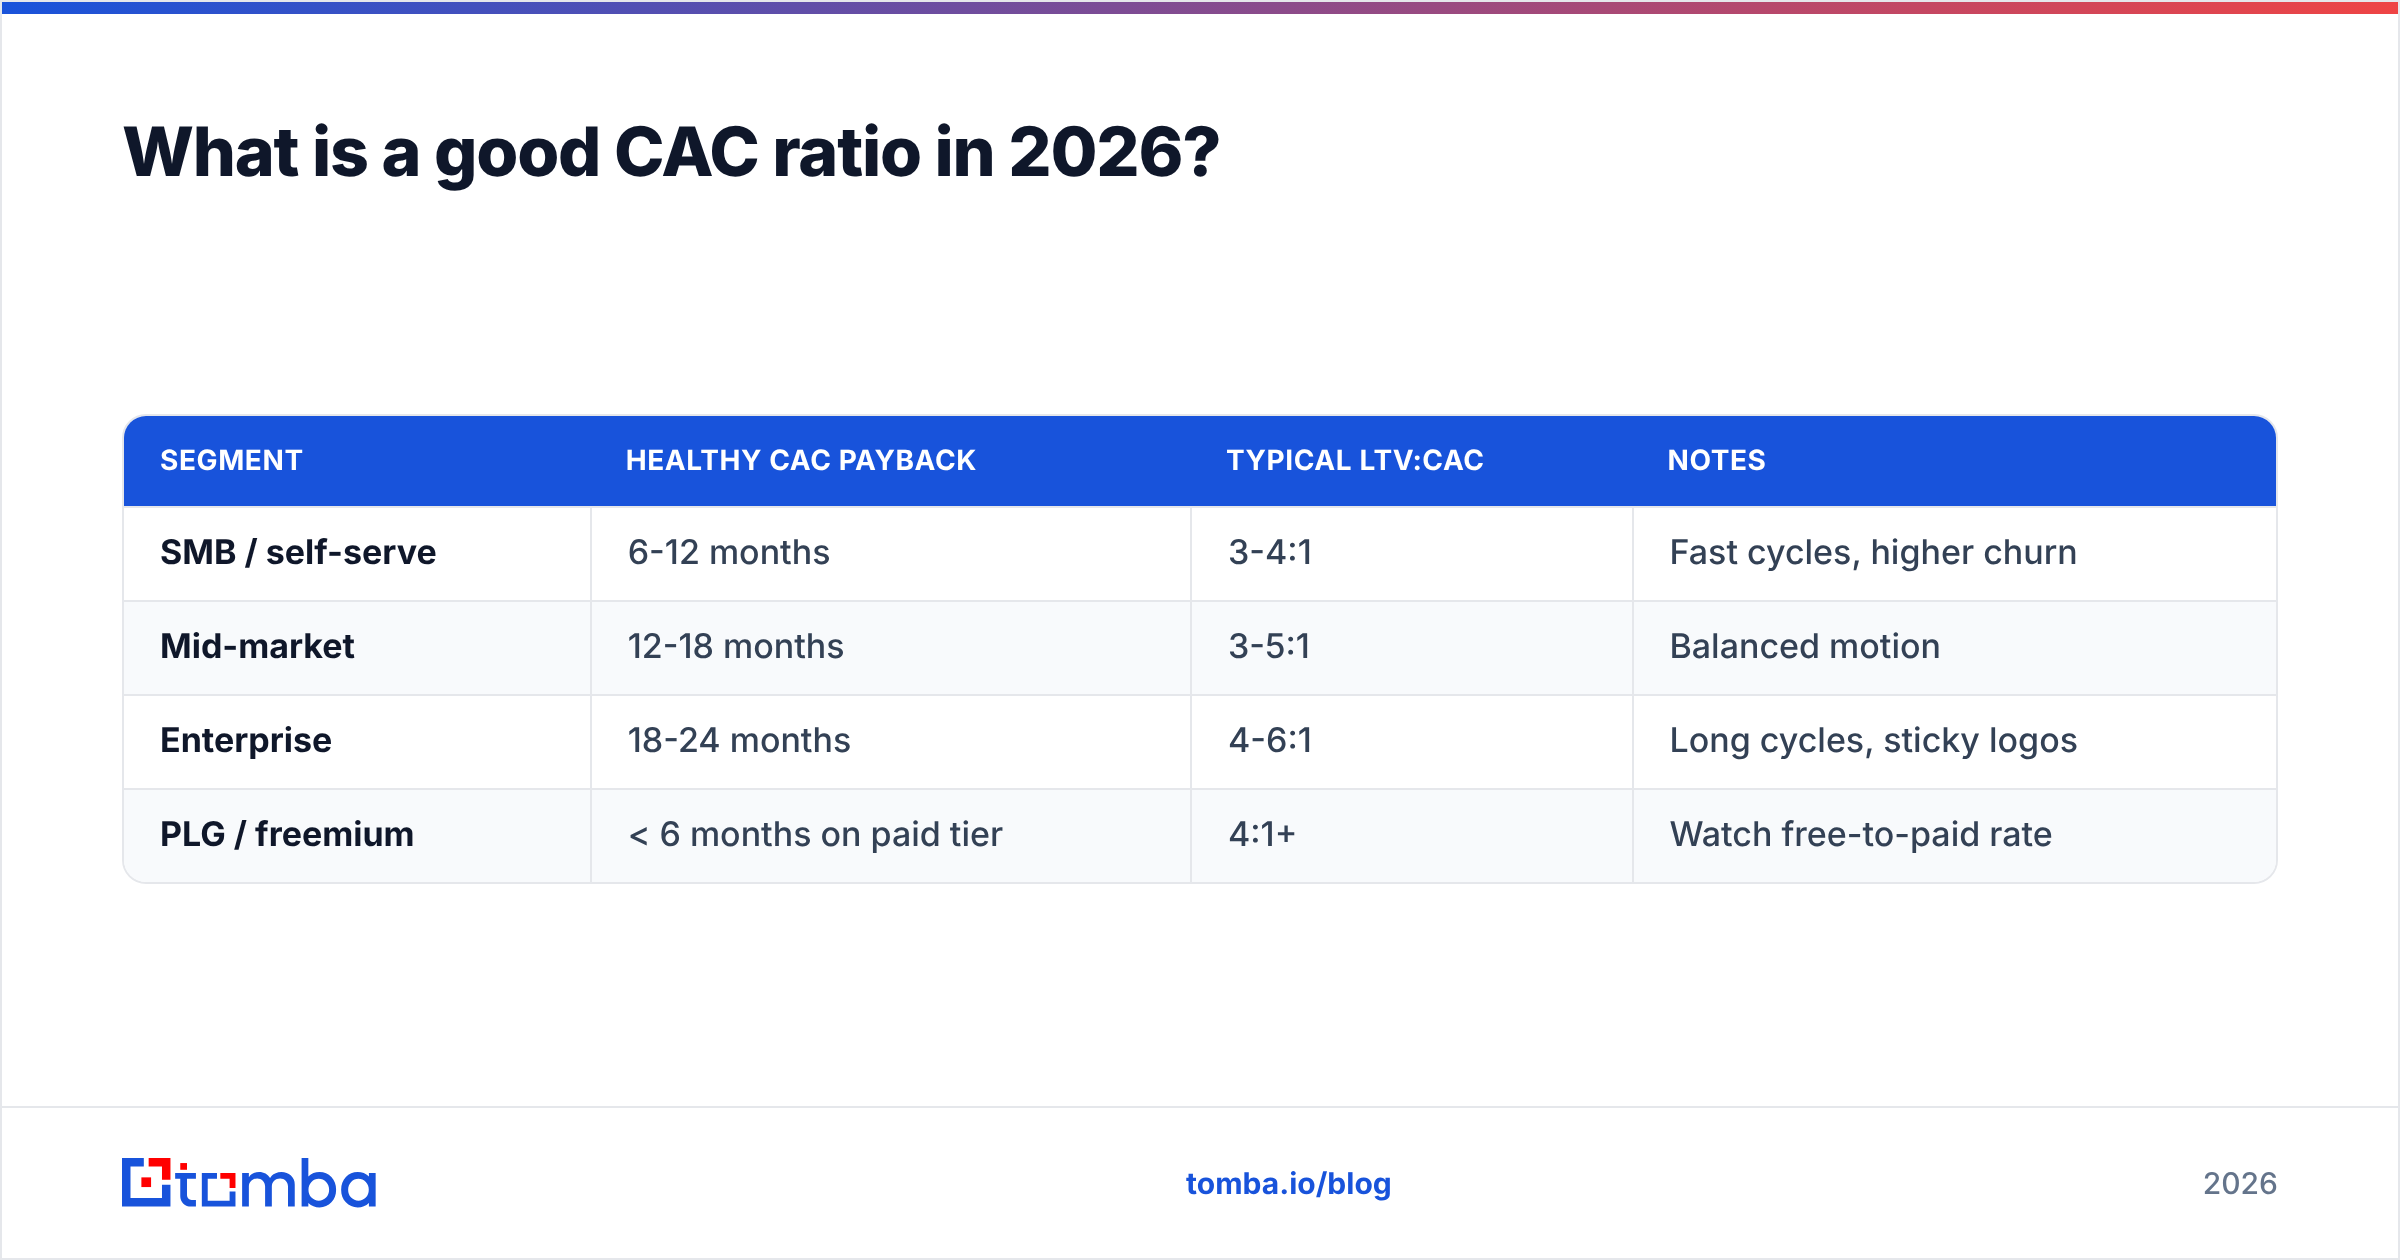
| Segment | Healthy CAC payback | Typical LTV:CAC | Notes |
|---|---|---|---|
| SMB / self-serve | 6-12 months | 3-4:1 | Fast cycles, higher churn |
| Mid-market | 12-18 months | 3-5:1 | Balanced motion |
| Enterprise | 18-24 months | 4-6:1 | Long cycles, sticky logos |
| PLG / freemium | < 6 months on paid tier | 4:1+ | Watch free-to-paid rate |
These ranges line up with what efficiency-focused investors and operators publish; for a deeper benchmark library, Bessemer's cloud metrics and category data on G2 are useful sanity checks against your own numbers.
Why is the CAC ratio so important for RevOps and GTM?#
Because it is the single number that tells you whether your growth engine is an asset or a liability. Revenue growth alone is vanity — you can buy unlimited revenue at a loss. The CAC ratio forces the question every board now asks: is this growth efficient?
In a revenue operations function, the CAC ratio is the connective tissue between marketing, sales, and finance. Marketing optimizes top-of-funnel cost. Sales optimizes conversion and deal size. Finance cares about payback and burn. The CAC ratio is where all three meet, which is exactly why it belongs on the RevOps dashboard and not buried in a finance spreadsheet nobody opens.
It also drives decisions you make every week:
- Budget allocation — pour spend into the channels with the best ratio, starve the ones bleeding cash.
- Pricing and packaging — a higher ARPA directly improves both LTV:CAC and payback.
- Hiring plans — if payback is creeping past 24 months, hiring more reps just deepens the hole.
- Fundraising — efficient CAC ratios command better valuations than raw growth in a tighter capital market.
How do you lower CAC and improve the ratio?#
You can improve the CAC ratio from two directions: raise the value of a customer (LTV) or lower the cost to acquire one (CAC). Most teams obsess over the first and ignore the cheapest wins in the second.
Lower CAC:
- Fix your targeting data first. A large share of wasted CAC comes from reps chasing wrong-fit or unreachable contacts. Bad email and phone data inflates CAC silently — you pay for the outreach, the tooling, and the rep's time, and get nothing back. Clean, verified contact data is the highest-leverage CAC fix most teams skip.
- Verify before you send. Bouncing emails wreck deliverability, which raises the cost of every future campaign. Running lists through an email verifier keeps your sender reputation intact and your cost-per-reply down.
- Tighten your ICP. Narrower targeting means higher conversion, which directly lowers CAC.
- Shift the channel mix toward lower-cost inbound and referral once you can attribute them.
Raise LTV:
- Reduce churn. A 1-point drop in monthly churn can move LTV more than any ad optimization.
- Expand accounts. Upsell and cross-sell raise ARPA without new acquisition cost.
- Improve onboarding so customers reach value before they can cancel.

The data-quality angle deserves emphasis because it compounds. When your prospect list is full of guesses, your reps waste hours on dead contacts, your sequences hit spam traps, and your CAC climbs across every channel at once. Sourcing accurate, verified contacts with a tool like Tomba's email finder attacks CAC at the root: more of your outreach reaches a real, in-market human, so the same spend produces more closed deals. Pair that with data enrichment to prioritize the accounts most likely to convert, and you lower the denominator and raise the numerator at the same time.
What mistakes distort the CAC ratio?#
Even careful teams get burned by these:
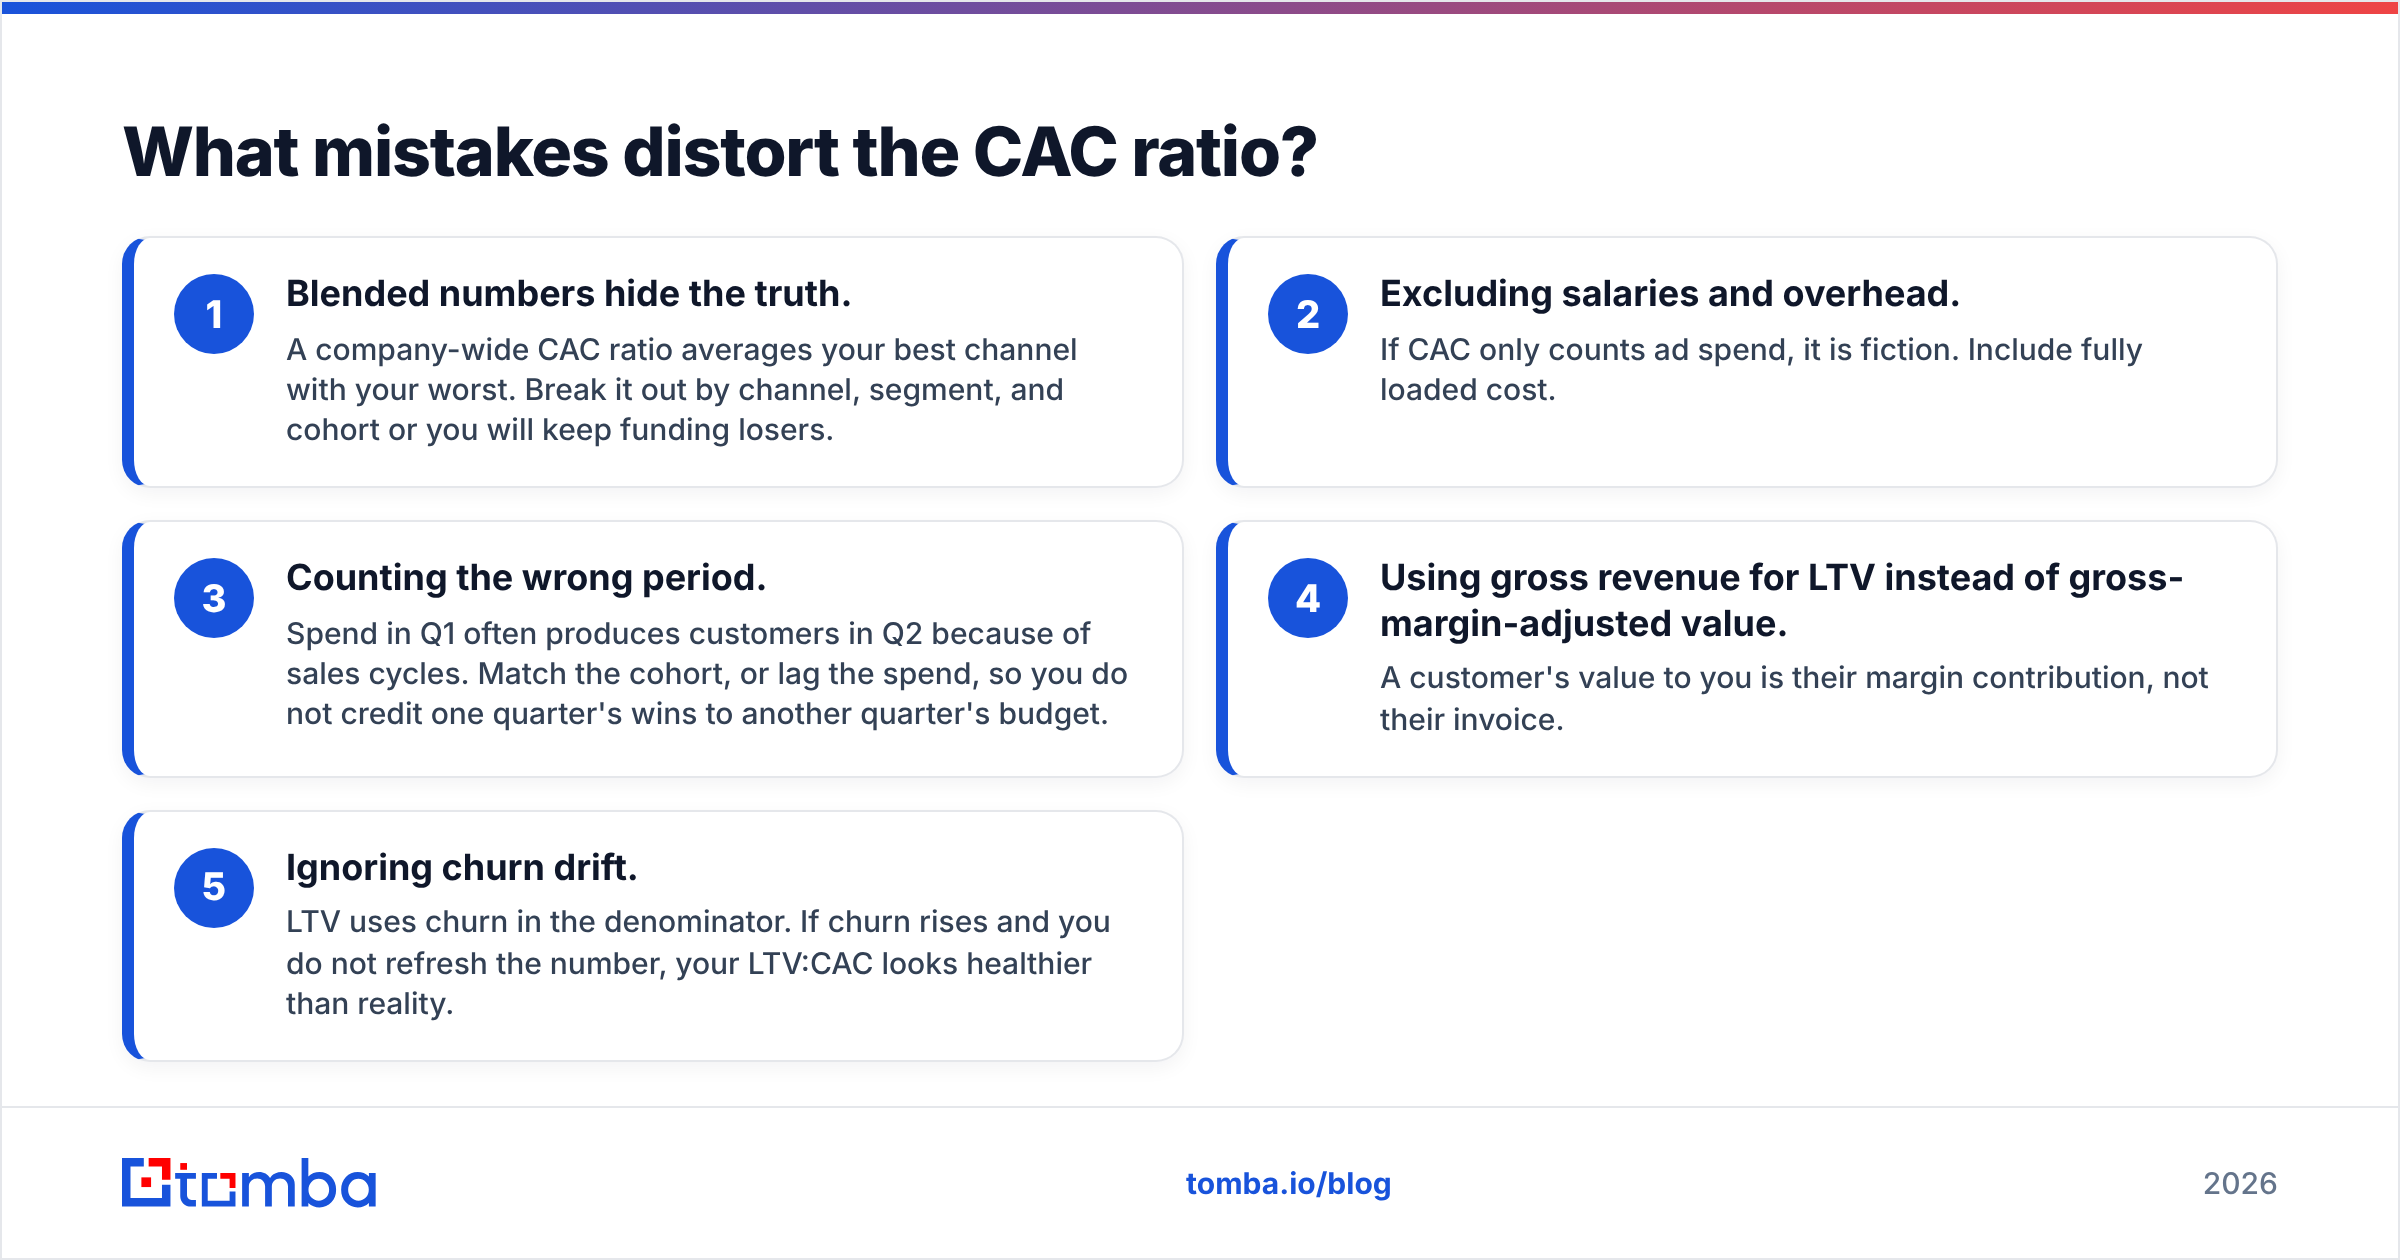
- Blended numbers hide the truth. A company-wide CAC ratio averages your best channel with your worst. Break it out by channel, segment, and cohort or you will keep funding losers.
- Excluding salaries and overhead. If CAC only counts ad spend, it is fiction. Include fully loaded cost.
- Counting the wrong period. Spend in Q1 often produces customers in Q2 because of sales cycles. Match the cohort, or lag the spend, so you do not credit one quarter's wins to another quarter's budget.
- Using gross revenue for LTV instead of gross-margin-adjusted value. A customer's value to you is their margin contribution, not their invoice.
- Ignoring churn drift. LTV uses churn in the denominator. If churn rises and you do not refresh the number, your LTV:CAC looks healthier than reality.
A reliable ratio depends on reliable inputs. That sounds obvious, but the most common root cause of a distorted CAC ratio is dirty CRM data — duplicate accounts, wrong contact counts, and untracked spend. Tightening the data feeding the formula matters more than the formula itself.
How does the CAC ratio fit with other GTM metrics?#
The CAC ratio is one gauge on the dashboard, not the whole cockpit. Read it alongside:
- Win rate — a low win rate often signals targeting problems that inflate CAC upstream.
- Magic Number — new ARR ÷ prior-quarter S&M spend; a sales-efficiency twin of the GTM CAC ratio.
- Net Revenue Retention — high NRR can carry a mediocre CAC ratio because existing customers expand cheaply.
- Burn multiple — net burn ÷ net new ARR; the company-level cousin of CAC efficiency.
The pattern: no single metric is sufficient. A 3:1 LTV:CAC with 130% NRR is a fundamentally different business than 3:1 with 85% NRR, even though the headline ratio matches. Always read CAC efficiency next to retention.
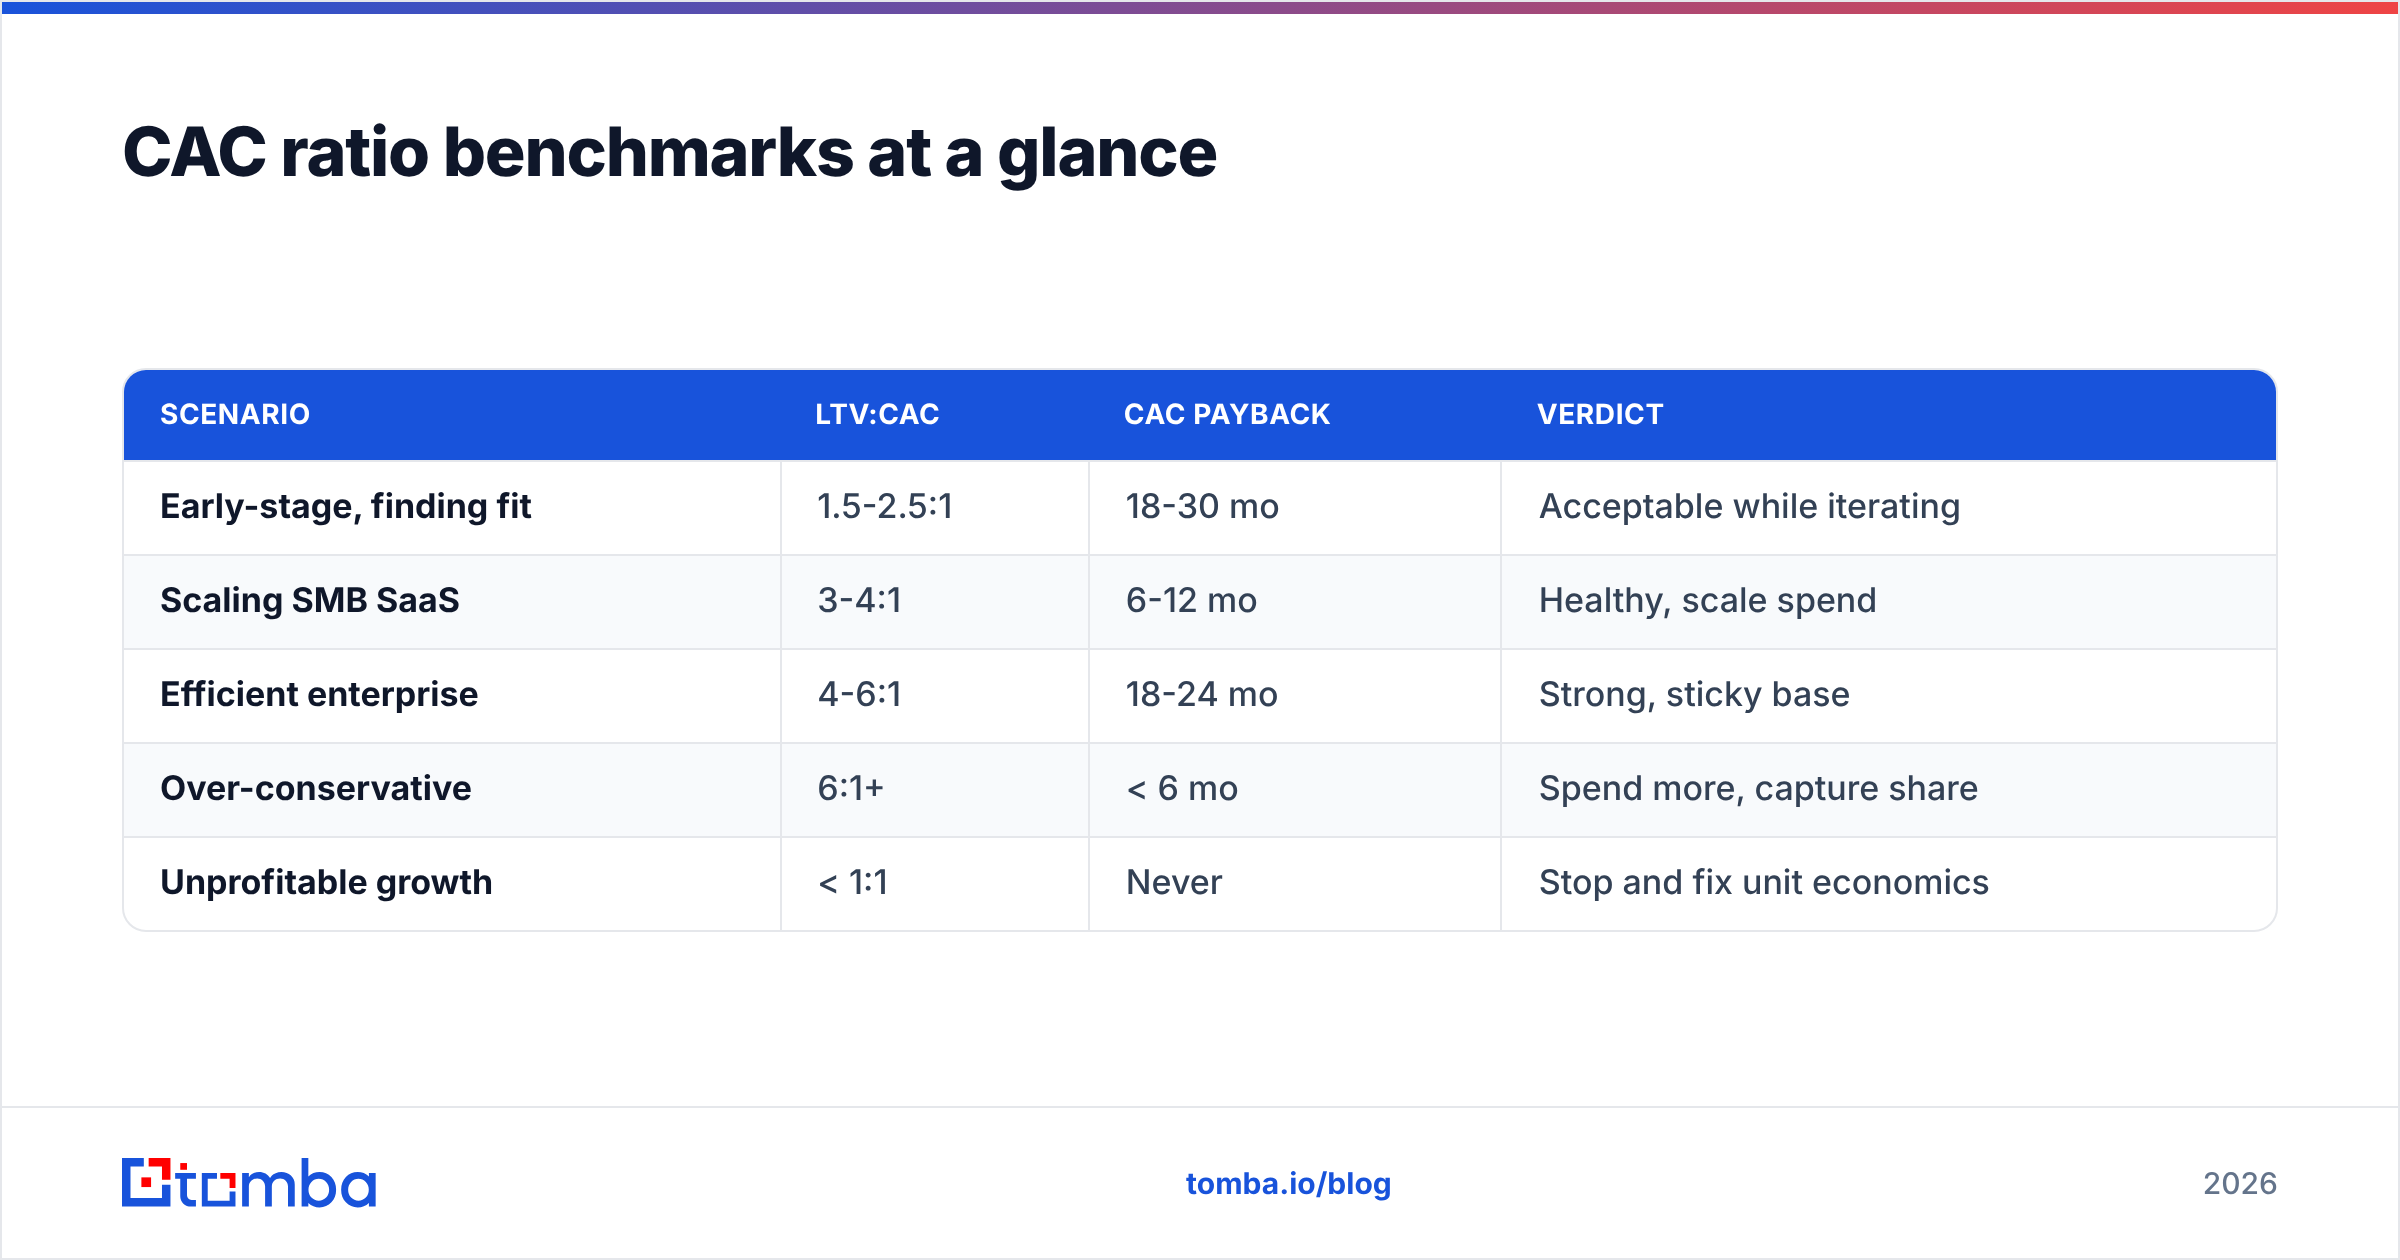
CAC ratio benchmarks at a glance#
| Scenario | LTV:CAC | CAC payback | Verdict |
|---|---|---|---|
| Early-stage, finding fit | 1.5-2.5:1 | 18-30 mo | Acceptable while iterating |
| Scaling SMB SaaS | 3-4:1 | 6-12 mo | Healthy, scale spend |
| Efficient enterprise | 4-6:1 | 18-24 mo | Strong, sticky base |
| Over-conservative | 6:1+ | < 6 mo | Spend more, capture share |
| Unprofitable growth | < 1:1 | Never | Stop and fix unit economics |
Use this as a directional guide, not gospel. Your model, margin, and motion shift the targets. The discipline that matters is measuring consistently and acting on the trend, quarter over quarter.
Conclusion: make every acquisition dollar count#
The CAC ratio is where growth meets reality. A 3:1 LTV:CAC and a sub-12-month payback mean your engine funds itself; the wrong numbers mean you are renting revenue you cannot keep. The leverage points are clear — tighten targeting, verify your data, cut churn, and never trust a blended number.
The cheapest win is almost always the same: stop wasting spend on contacts that do not exist or do not fit. If you want to lower CAC at the source, start by feeding your funnel cleaner, more accurate prospects. Tomba's Email Finder finds and verifies professional email addresses by name, domain, or company, so more of your outreach reaches real, in-market buyers — and every dollar of acquisition spend works harder. Pair it with verification and enrichment, and watch your CAC ratio move in the direction your board wants. Check the Tomba pricing plans to find the tier that fits your outbound volume.
// get started
Find, verify and enrich your first contacts today
Start on the free plan with 25 searches a month, then scale when your team is ready.
Free plan · No credit card required · GDPR & CCPA
// about the author