CAC in Sales: How to Calculate and Lower It in 2026
Customer acquisition cost decides whether your sales motion scales or quietly bleeds cash. Here is how to calculate CAC, benchmark it, and cut it in 2026.
TL;DR
- CAC (customer acquisition cost) is the fully loaded cost of sales and marketing divided by the number of new customers won in the same period. It is the single number that tells you whether growth is profitable or just expensive.
- A healthy B2B SaaS CAC is judged against payback period (under 12 months) and the LTV:CAC ratio (aim for 3:1 or better), not against an absolute dollar figure.
- The biggest hidden driver of CAC is wasted rep time — chasing bad-fit accounts, bouncing emails, and dialing dead numbers.
- You lower CAC by improving targeting, data quality, conversion rates, and retention — in roughly that order of leverage.
- Clean contact data is the cheapest CAC lever most teams ignore. Accurate emails and phone numbers mean fewer wasted touches per closed deal.
What does CAC mean in sales?#
CAC is what you spend to turn a stranger into a paying customer. Think of it like a fishing trip: it is not just the price of the fish you bring home, it is the boat fuel, the bait, the gear, and the hours you spent on the water — all divided by the number of fish in the cooler. If you spend $400 on the trip and catch four fish, each fish "cost" you $100, no matter what it sells for at the market.
In sales terms, customer acquisition cost rolls every go-to-market dollar into one figure: rep salaries and commissions, marketing spend, sales tools, the data and lead sources you buy, and the overhead that supports the revenue team. Divide that by net new customers and you have your CAC.
CAC matters because revenue alone lies to you. A team can post record bookings while quietly setting fire to cash on each deal. CAC is the metric that exposes that. It sits at the center of revenue operations precisely because it forces marketing, sales, and finance to agree on what growth actually costs.
How do you calculate CAC?#
The basic formula is deliberately simple:
CAC = (Total sales costs + Total marketing costs) ÷ Number of new customers acquired
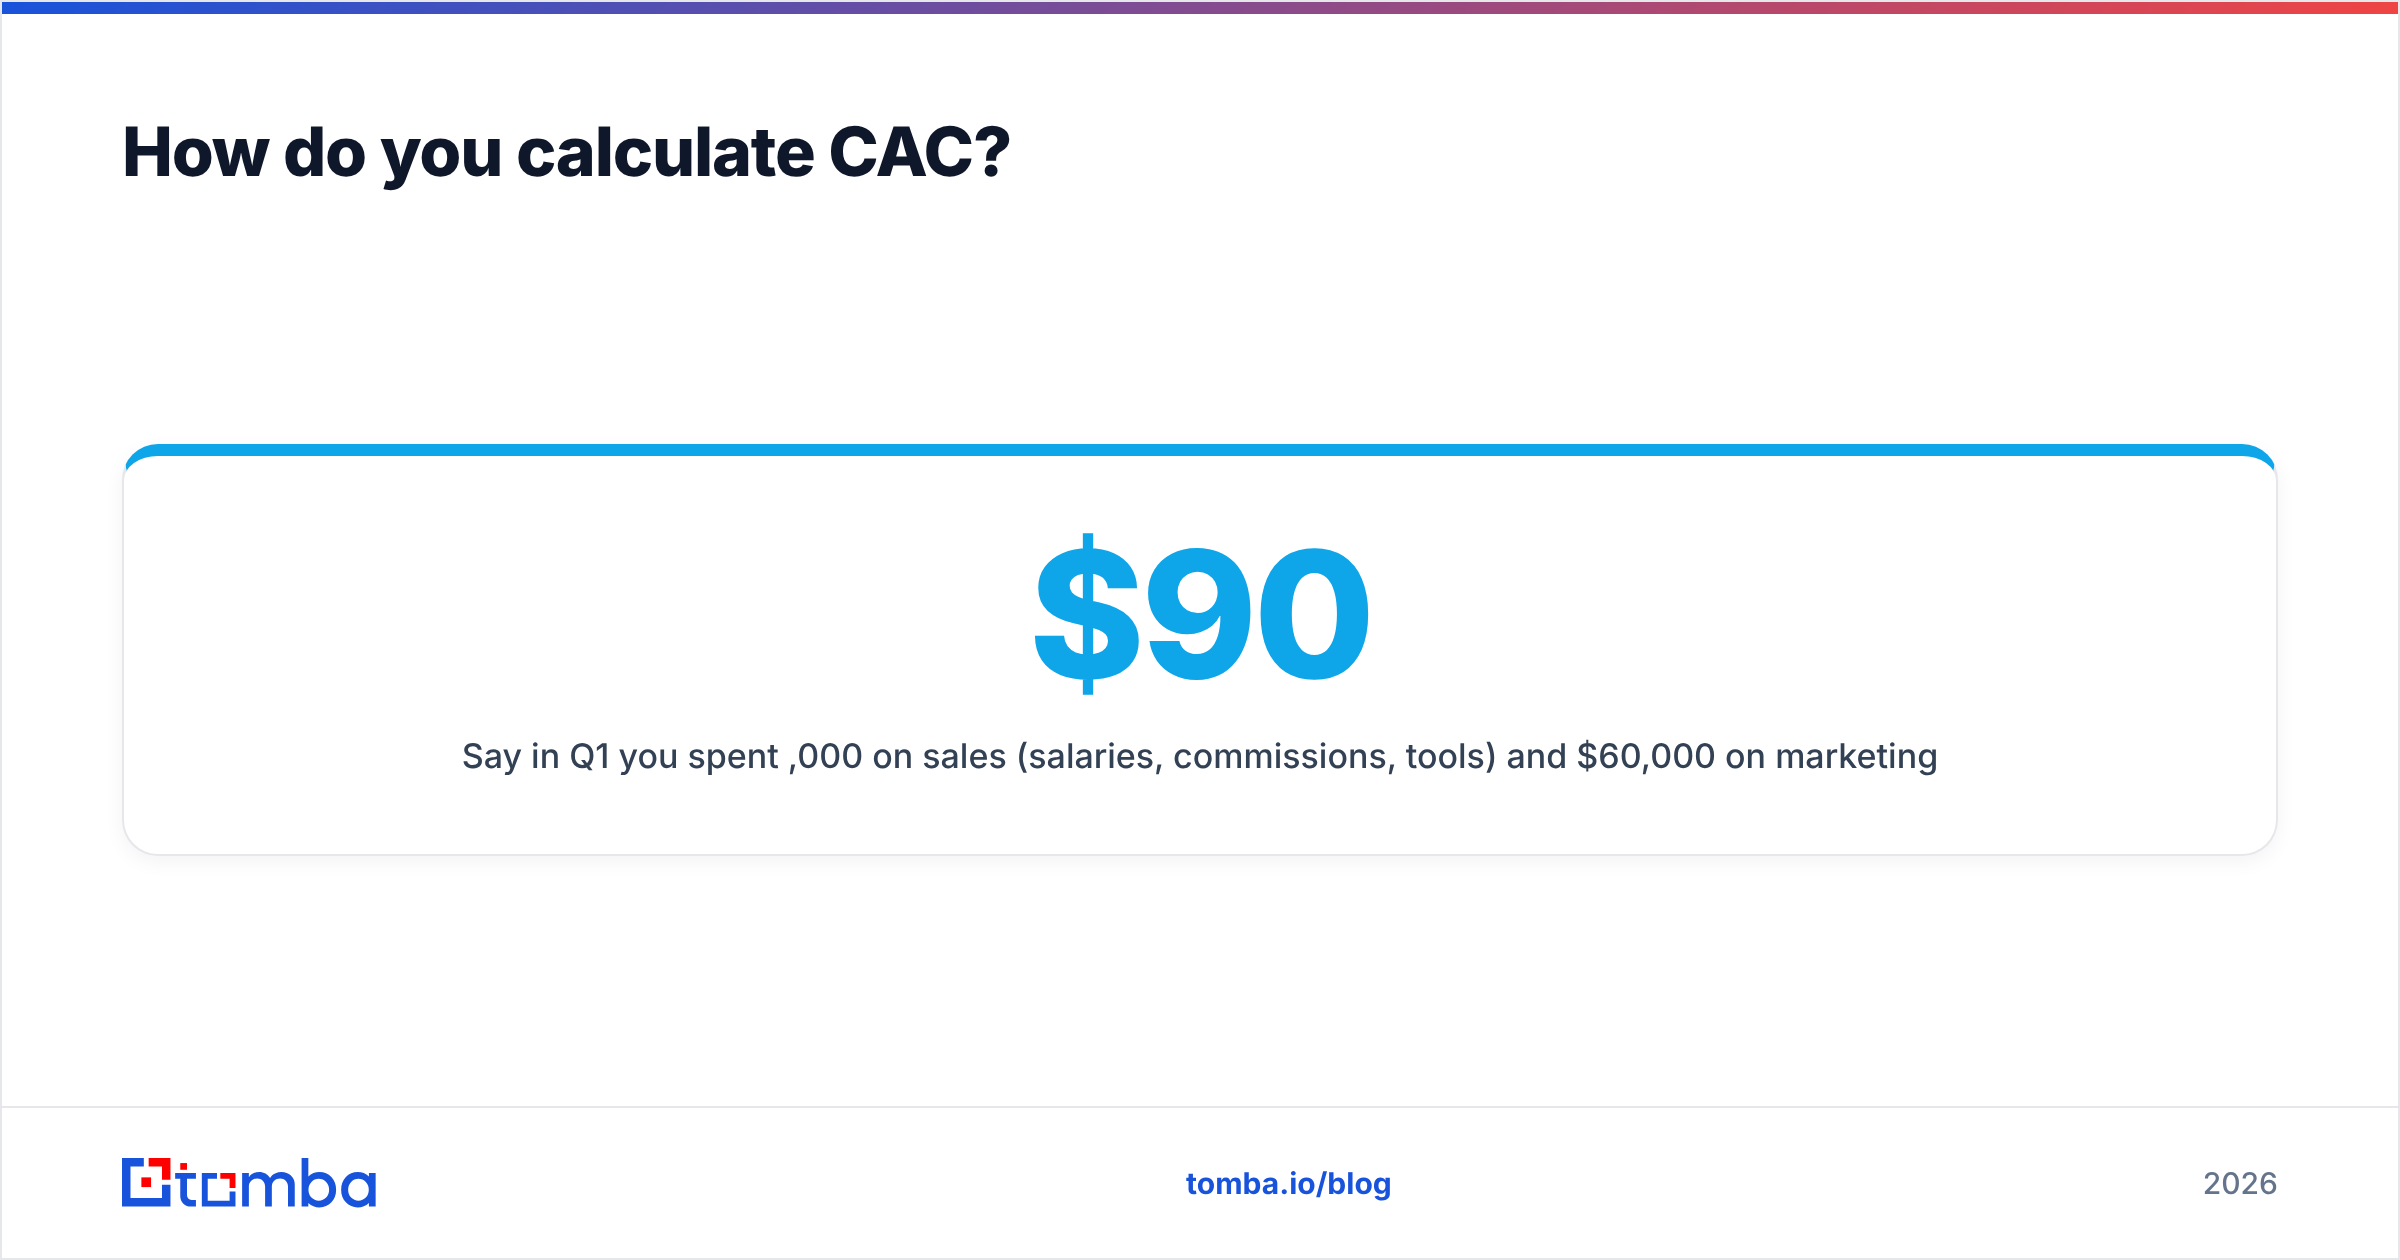
Say in Q1 you spent $90,000 on sales (salaries, commissions, tools) and $60,000 on marketing (ads, content, events), and you closed 50 new customers. Your CAC is ($90,000 + $60,000) ÷ 50 = $3,000 per customer.
That is the headline number. The mistakes happen in what you include. Use this checklist to keep the calculation honest:
- Fully loaded salaries — base pay, commission, benefits, and payroll tax for every SDR, AE, and marketer, not just base.
- Tooling and data — your CRM, sequencing platform, enrichment, data enrichment, and lead-gen subscriptions all count.
- Paid media and content — ad spend, agency retainers, sponsorships, and the cost of producing content.
- Overhead allocation — the slice of management, ops, and software that supports revenue work.
- Same time window — costs and customers must cover the same period, or the ratio is meaningless.
- New customers only — exclude expansion and renewal revenue; CAC measures acquisition, not growth of existing accounts.

For a sharper view, split blended CAC (all customers, all channels) from paid CAC (only customers from paid spend). Blended CAC flatters you because it includes free organic and referral wins. Paid CAC tells you what scaling actually costs, which is the number your CFO cares about.
What is a good CAC benchmark in 2026?#
There is no universal "good" CAC, because a $50/month product and a $50,000/year platform live in different worlds. Instead, judge CAC against two ratios.
The first is the LTV:CAC ratio — lifetime value divided by acquisition cost. A widely cited target is 3:1. Below 1:1 you lose money on every customer. Above 5:1 you may be under-investing in growth and leaving the market to competitors.
The second is CAC payback period — how many months of gross margin it takes to recoup CAC. For most B2B SaaS, under 12 months is healthy; under 6 is excellent. SaaS benchmarking from sources like OpenView and industry surveys aggregated on G2 consistently points to payback as the metric that predicts capital efficiency.
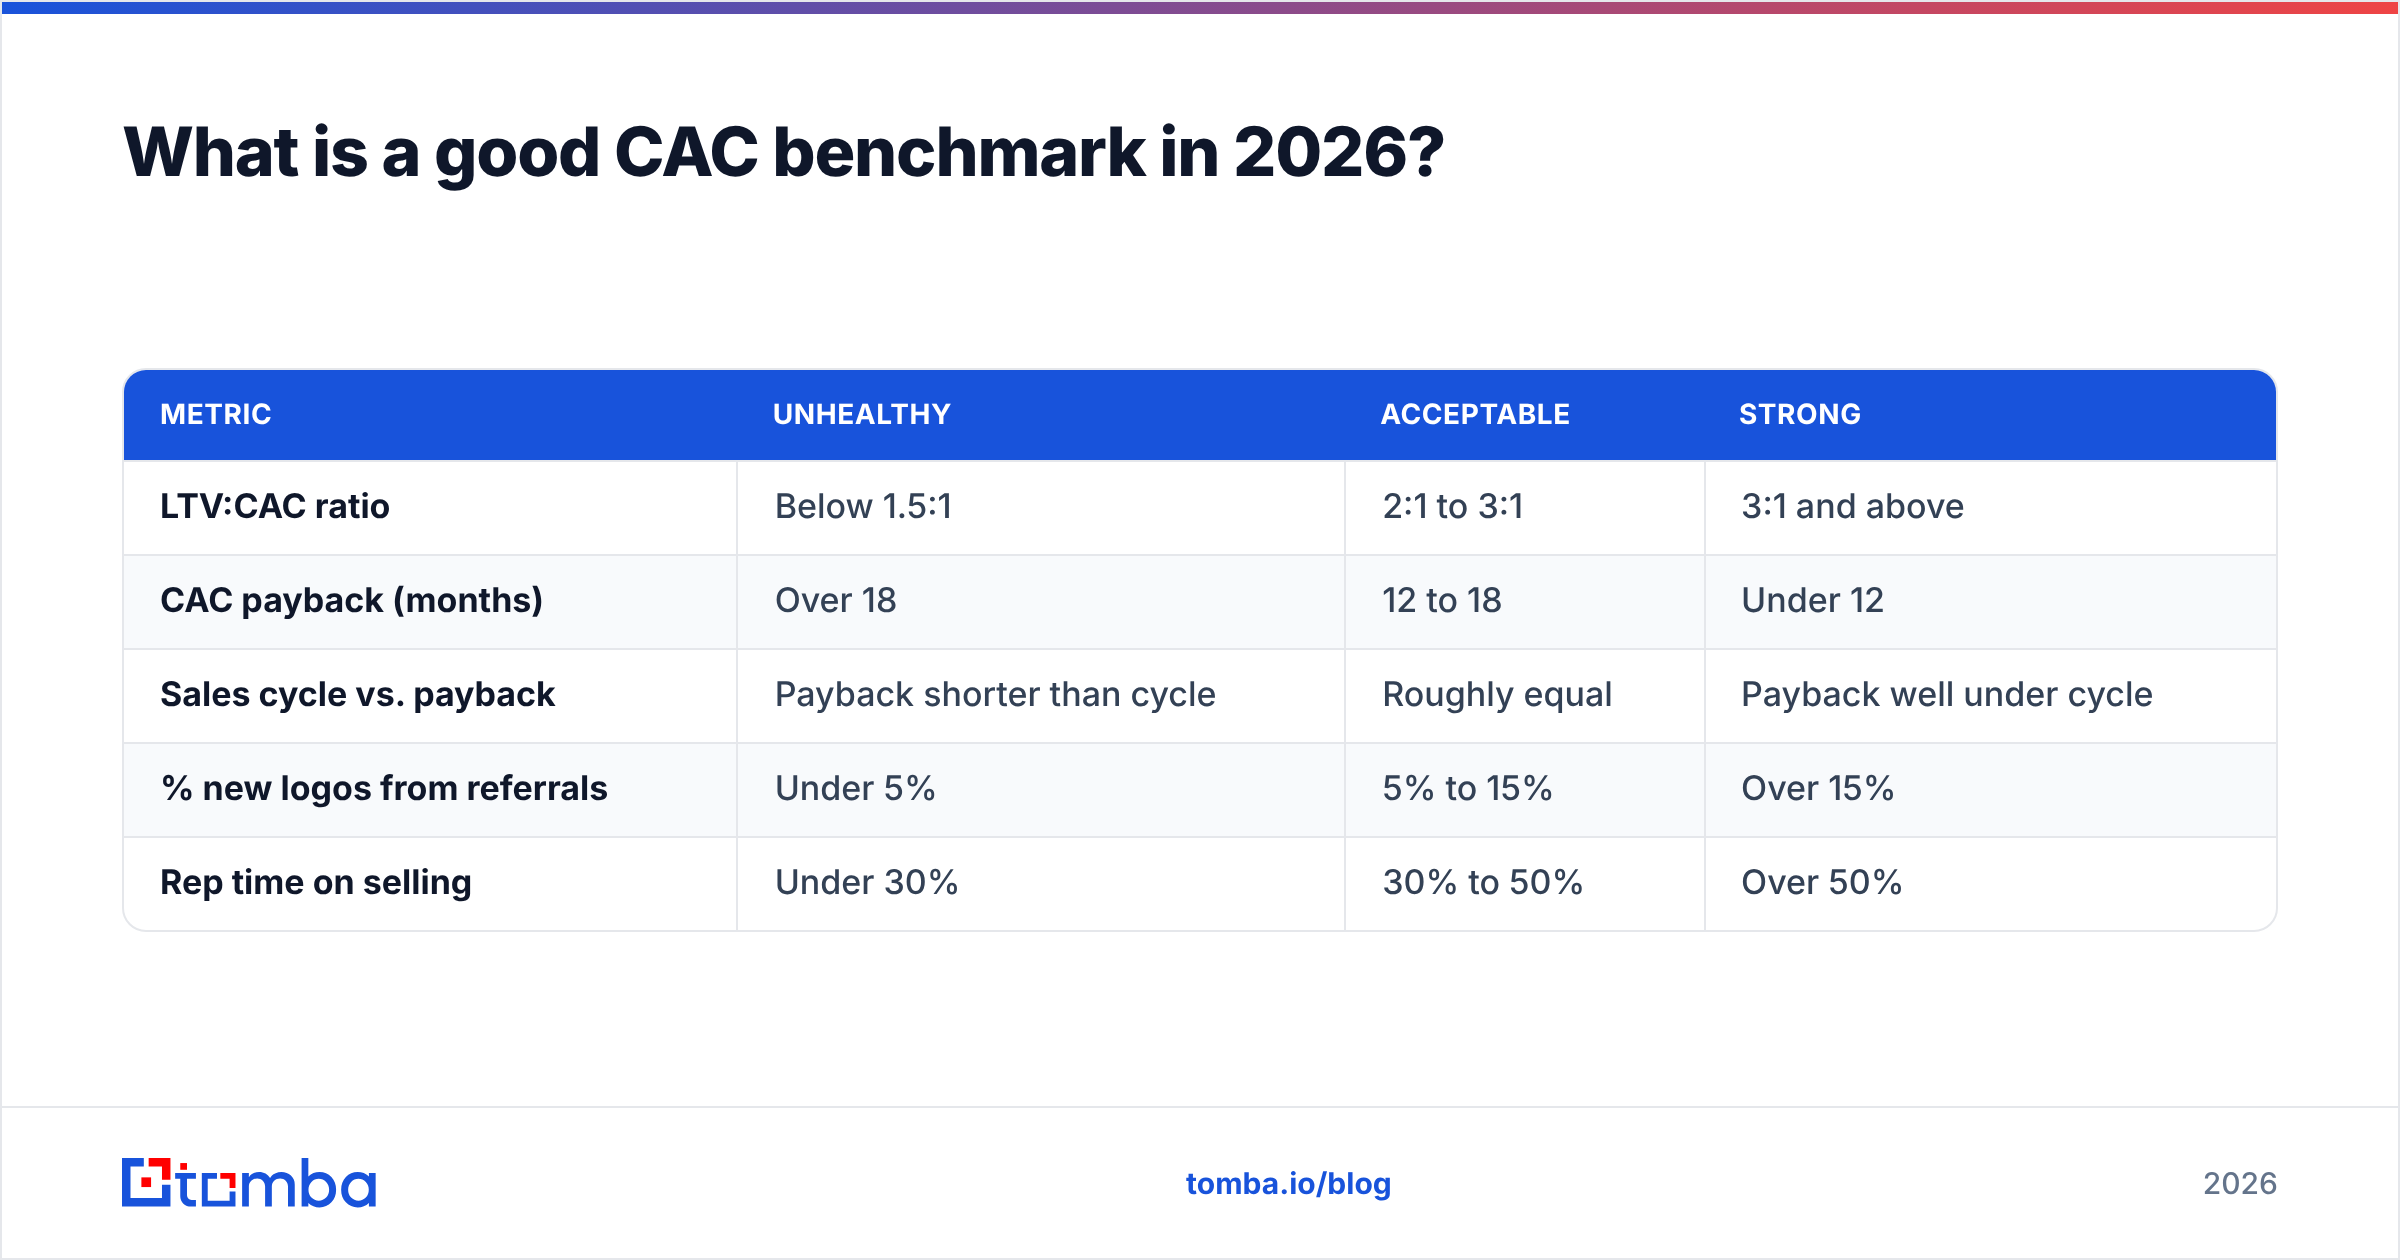
| Metric | Unhealthy | Acceptable | Strong |
|---|---|---|---|
| LTV:CAC ratio | Below 1.5:1 | 2:1 to 3:1 | 3:1 and above |
| CAC payback (months) | Over 18 | 12 to 18 | Under 12 |
| Sales cycle vs. payback | Payback shorter than cycle | Roughly equal | Payback well under cycle |
| % new logos from referrals | Under 5% | 5% to 15% | Over 15% |
| Rep time on selling | Under 30% | 30% to 50% | Over 50% |
Use the table as a diagnostic, not a scoreboard. If your LTV:CAC looks great but payback is 20 months, you are technically profitable but cash-starved — growth will stall the moment funding tightens.
Why is your CAC higher than it should be?#
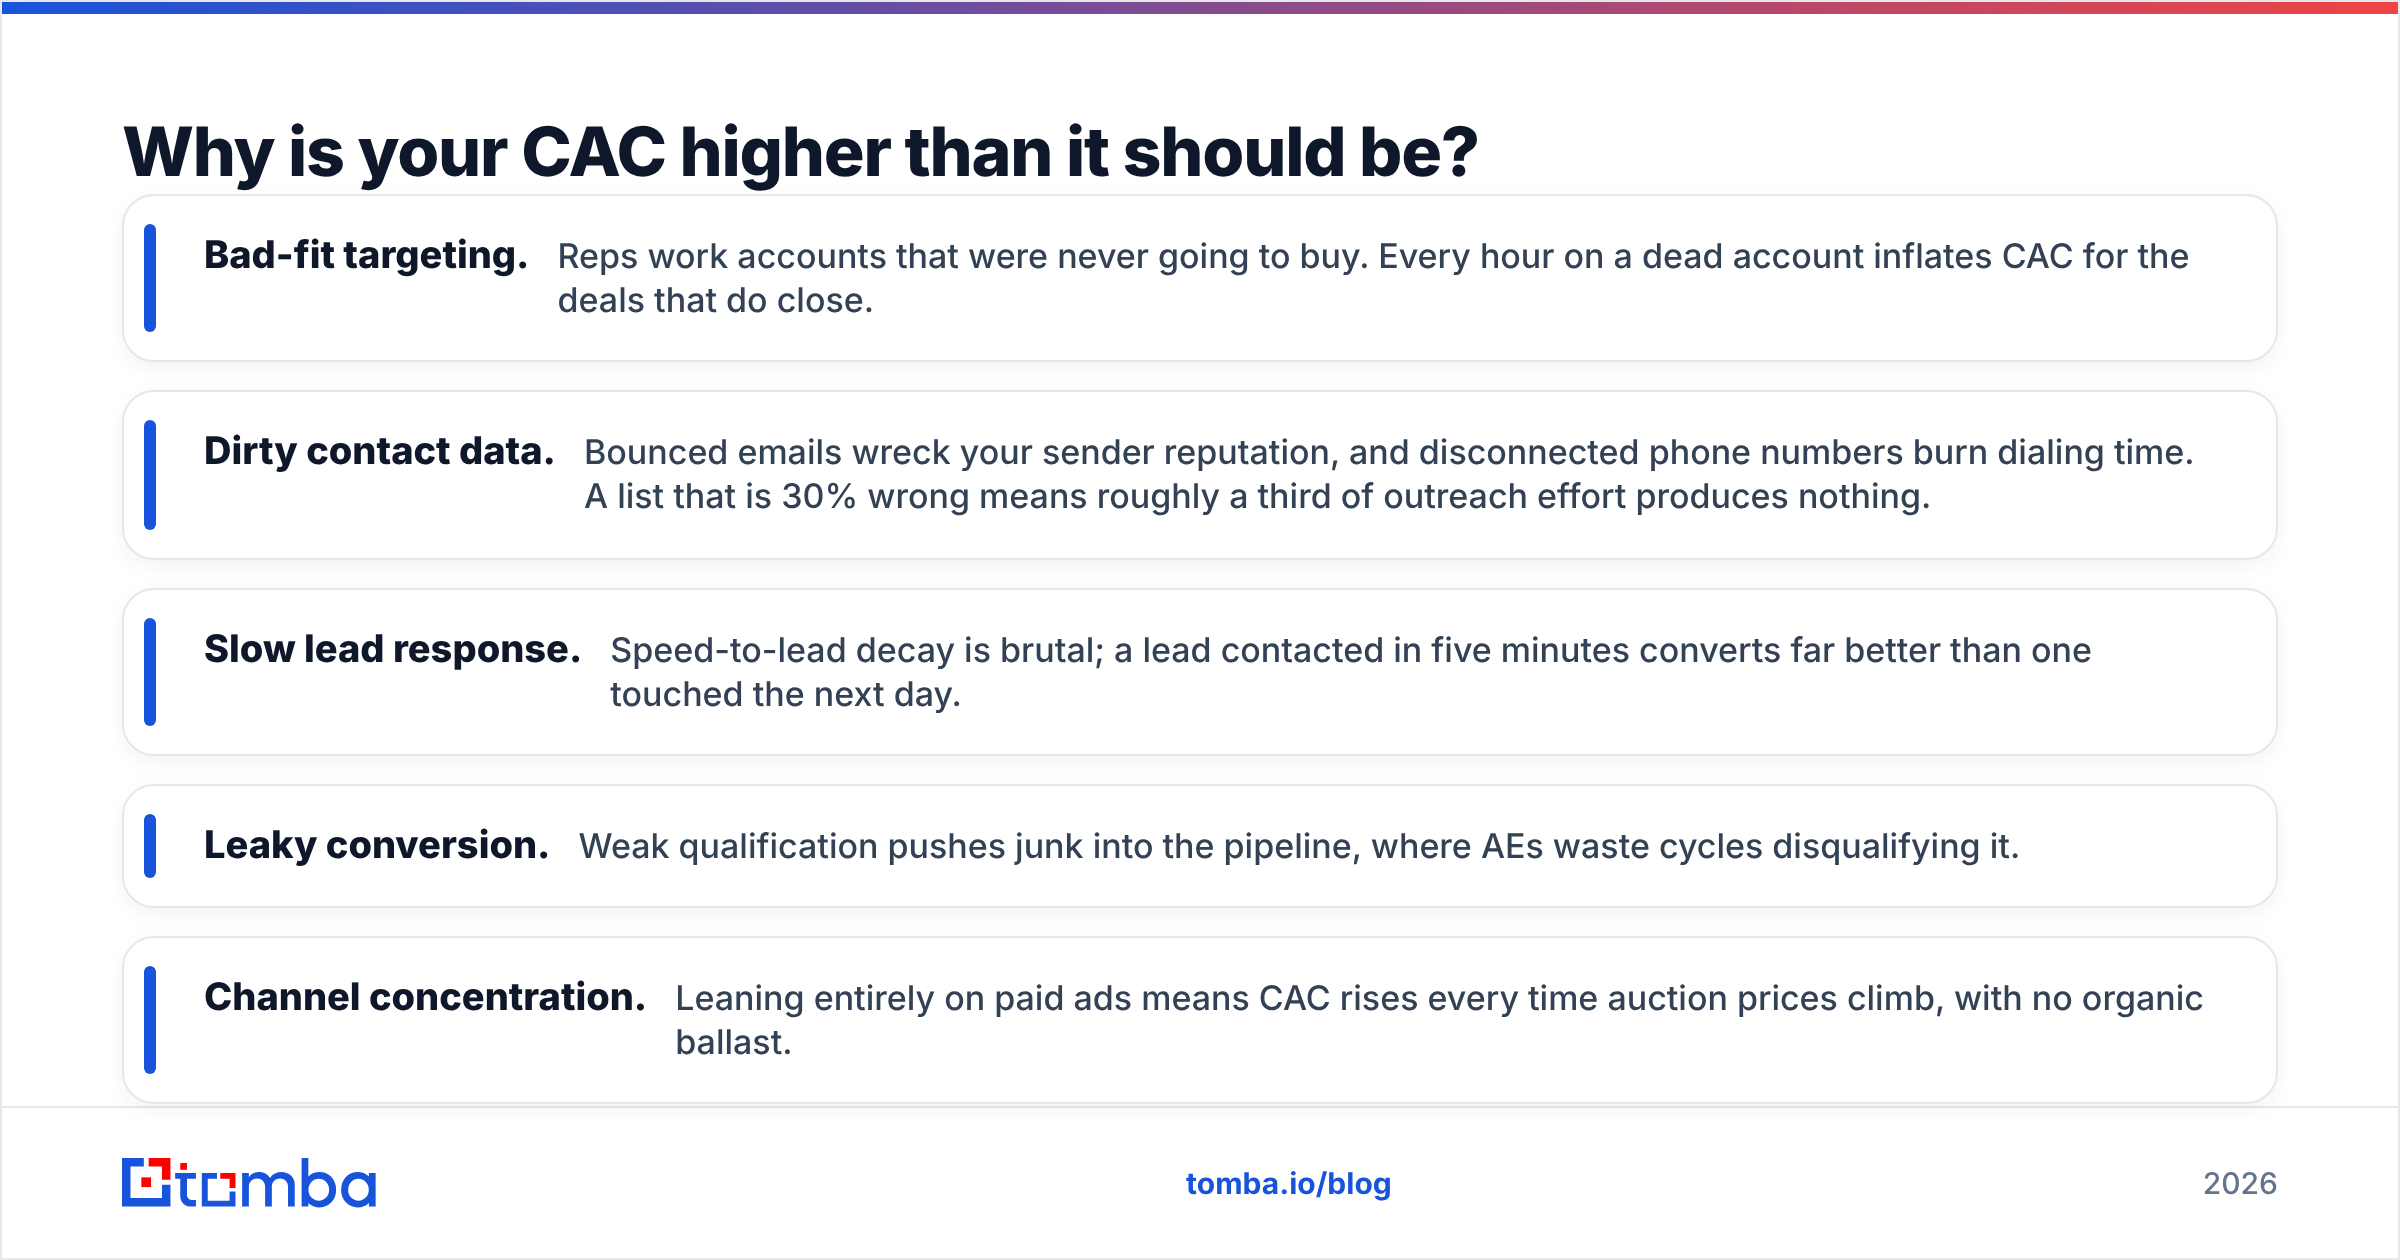
Most teams assume high CAC is a spend problem, so they cut budget. Usually it is an efficiency problem hiding inside the denominator. You are not winning enough customers per dollar, and the leaks are operational.
The most common culprits:
- Bad-fit targeting. Reps work accounts that were never going to buy. Every hour on a dead account inflates CAC for the deals that do close.
- Dirty contact data. Bounced emails wreck your sender reputation, and disconnected phone numbers burn dialing time. A list that is 30% wrong means roughly a third of outreach effort produces nothing.
- Slow lead response. Speed-to-lead decay is brutal; a lead contacted in five minutes converts far better than one touched the next day.
- Leaky conversion. Weak qualification pushes junk into the pipeline, where AEs waste cycles disqualifying it.
- Channel concentration. Leaning entirely on paid ads means CAC rises every time auction prices climb, with no organic ballast.
Here is the uncomfortable math on data quality. If your SDR sends 1,000 emails a month and 25% bounce or go to the wrong person, you have paid for 250 wasted sends, the warm-up risk they create, and the deals that never started because the right person was never reached. Multiply that across a team and data quality becomes one of the largest line items inside CAC that nobody puts on the CAC report.
How do you lower CAC in sales?#
Lowering CAC means moving one of two levers: spend less per attempt, or win more customers per attempt. The second lever has far more upside. Here are seven plays ordered by leverage.
1. Tighten your ICP before you spend a dollar. A precise ideal customer profile shrinks the universe you pay to reach. Fewer, better-fit accounts convert at higher rates, which is the fastest way to cut CAC without cutting budget.
2. Fix your contact data. This is the cheapest, highest-ROI lever for most teams. Verified emails and direct dials mean reps spend time talking to humans instead of guessing addresses. Run lists through an email verifier before any send, and source new contacts from a tool that reports real accuracy rather than a vendor that ships you a CSV and hopes.
3. Compress speed-to-lead. Automate routing so inbound leads hit a rep within minutes. Faster contact lifts conversion, and higher conversion divides your fixed costs across more customers.
4. Improve qualification. A tight lead scoring model keeps AEs off junk. Disqualifying earlier and cheaper protects your most expensive resource — closing-rep time.
5. Build a referral and organic base. Referred customers carry near-zero acquisition cost and usually retain better. Even a modest referral program shifts your blended CAC down over time.
6. Raise retention to protect LTV. CAC is half of a ratio. Cutting churn lifts LTV, which improves LTV:CAC even if acquisition cost stays flat. RevOps teams often find faster wins here than in the acquisition column.
7. Consolidate your tool stack. Overlapping point solutions quietly inflate the cost side. One platform that finds, verifies, and enriches contacts replaces three subscriptions and reduces the per-customer tooling load.
How does data quality change the CAC equation?#
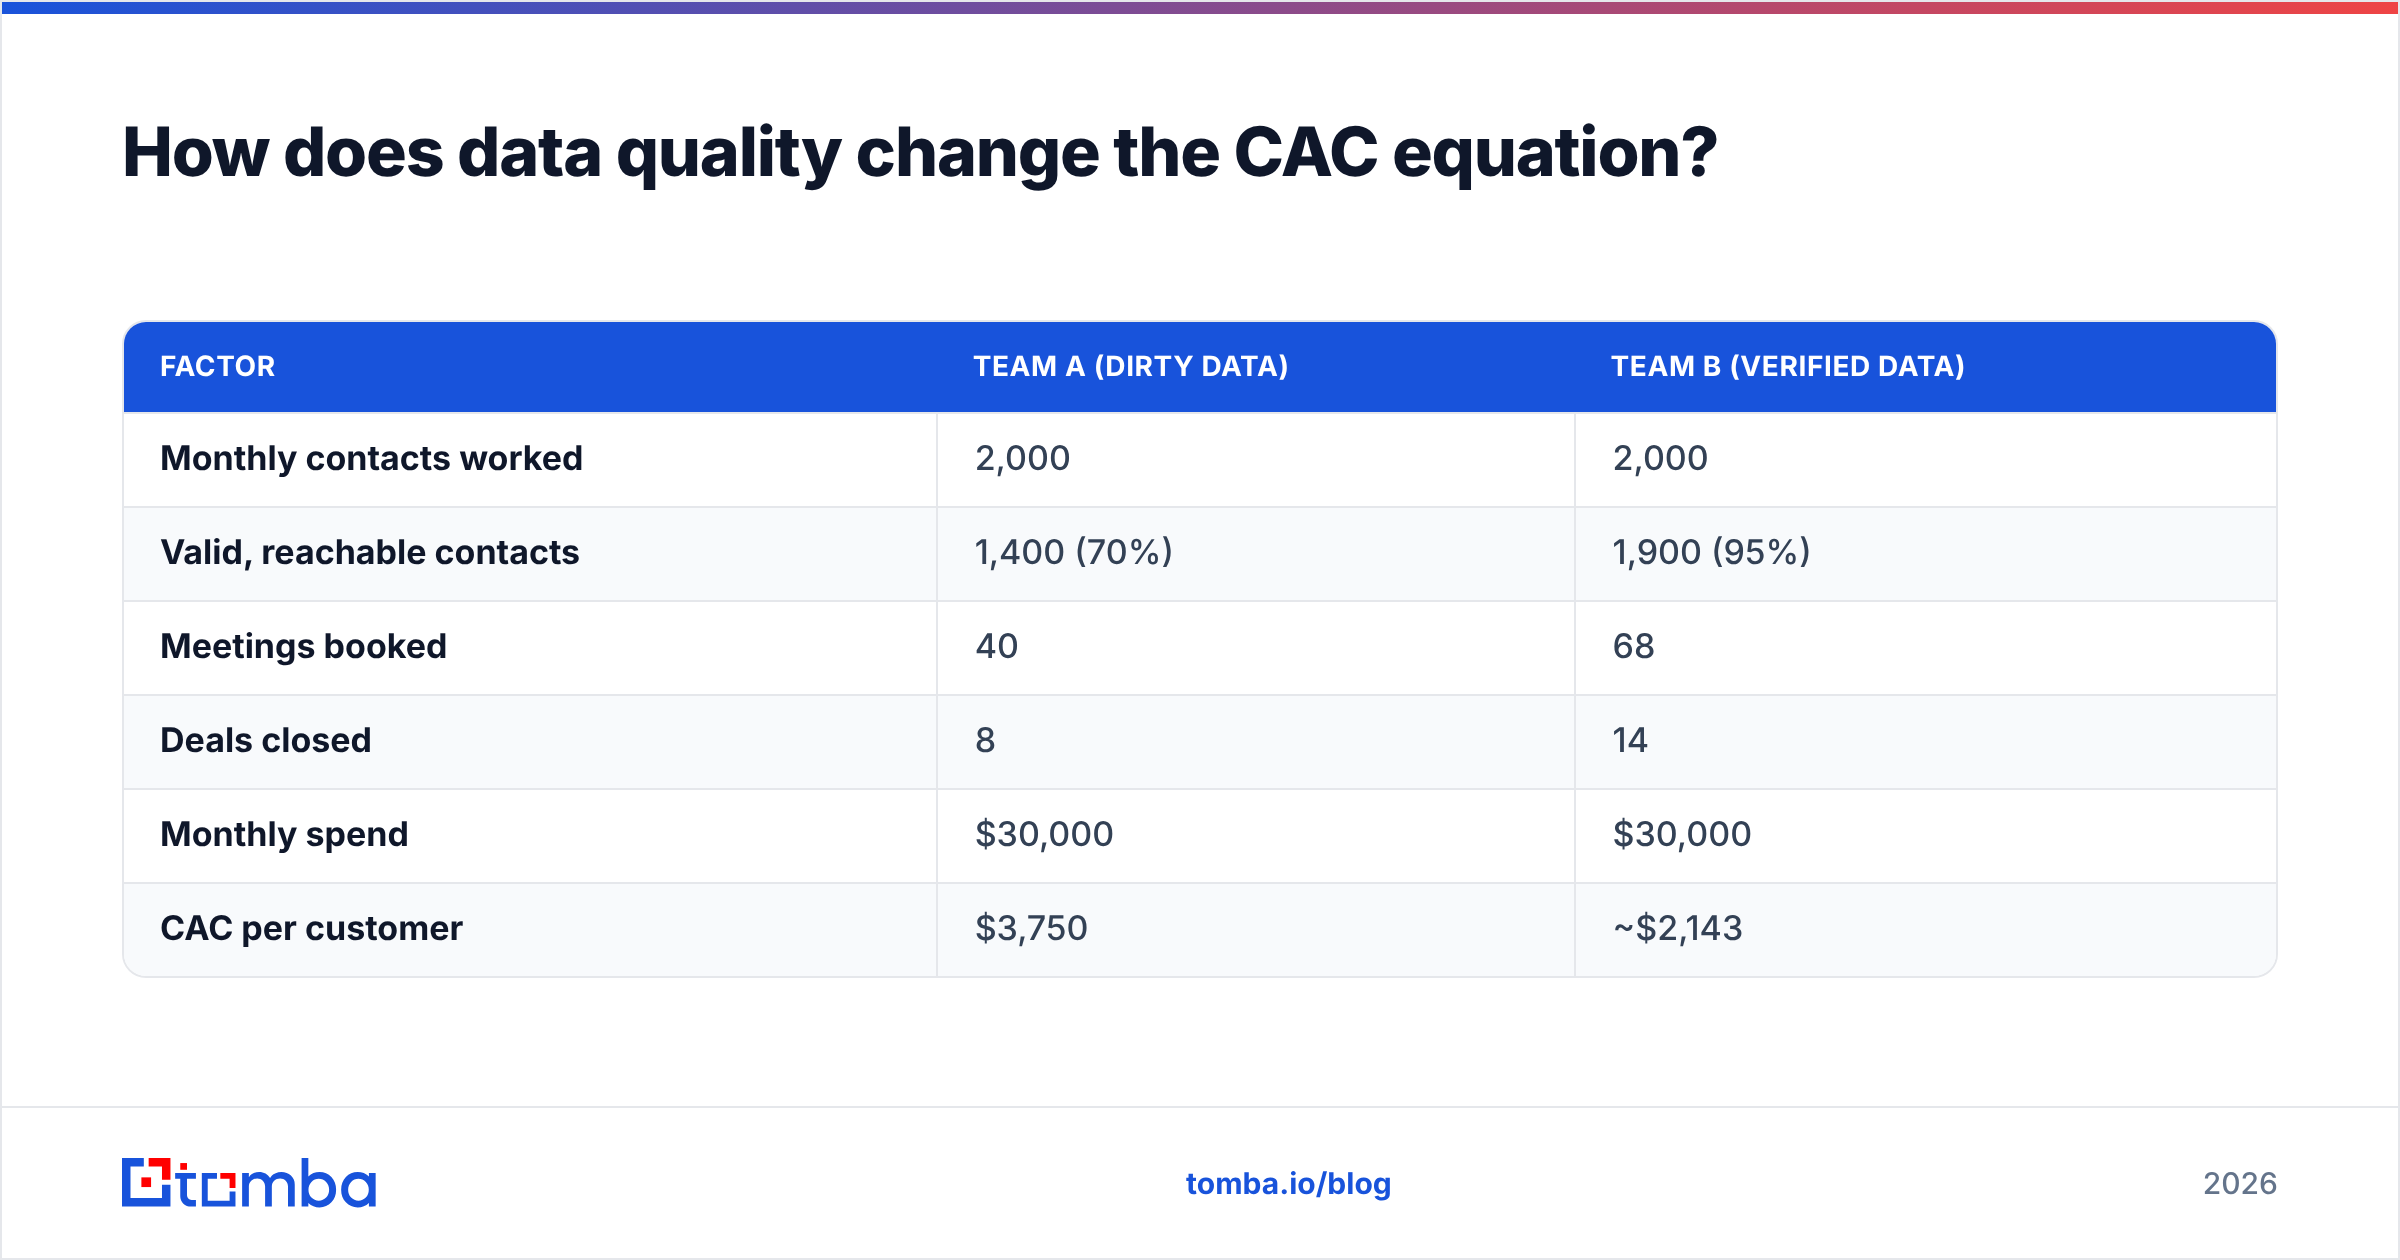
Walk through a concrete comparison. Two teams run identical outbound motions, same headcount, same monthly spend of $30,000. The only difference is contact data quality.
| Factor | Team A (dirty data) | Team B (verified data) |
|---|---|---|
| Monthly contacts worked | 2,000 | 2,000 |
| Valid, reachable contacts | 1,400 (70%) | 1,900 (95%) |
| Meetings booked | 40 | 68 |
| Deals closed | 8 | 14 |
| Monthly spend | $30,000 | $30,000 |
| CAC per customer | $3,750 | ~$2,143 |
Nothing changed except how many contacts were actually reachable. Better data raised the denominator, and CAC dropped by roughly 43% with zero extra spend. That is the leverage hiding in the part of CAC nobody itemizes.
This is also where the cost side and the win side meet. A bulk email finder that returns verified results means fewer sends wasted, less reputation damage, and more conversations started per hour of rep time. Pricing matters too — at predictable Tomba pricing tiers you can model data cost per closed deal instead of guessing, which is exactly the kind of input a clean CAC calculation needs.
How do CAC, LTV, and payback work together?#
Treat these three as a single dashboard, not separate metrics. CAC tells you the entry cost. LTV tells you the lifetime return. Payback tells you how fast you get your money back so you can reinvest. A business can survive a high CAC if LTV is high and payback is short; it cannot survive a low CAC if churn drags LTV down to nothing.
The practical workflow:
- Calculate paid CAC monthly so you can see trends, not just quarterly snapshots.
- Pair every CAC number with payback period in the same view.
- Segment CAC by channel and ICP tier to find your most efficient motion.
- Feed the winners more budget and starve the laggards — that reallocation alone often beats any single tactic.
For the underlying definitions and how finance teams frame these ratios, vendor resources like the HubSpot guide to customer acquisition cost are a solid neutral reference, and the broader concept is well documented on Wikipedia's customer acquisition cost entry.
Frequently asked questions#
Is CAC the same as cost per lead? No. Cost per lead measures the price of generating a contact; CAC measures the price of a closed customer. CAC always includes the conversion losses between lead and signed deal, which is why it is far higher than CPL.
Should CAC include customer success costs? For pure acquisition CAC, no — those costs belong to retention and LTV. Keep onboarding and CS out of CAC so you do not double-count them.
How often should I recalculate CAC? Monthly for paid CAC, quarterly for blended. Frequent measurement catches rising channel costs before they become a trend.
Can outbound ever have lower CAC than inbound? Yes, when targeting and data are tight. Precise outbound to verified, high-fit contacts can beat broad inbound that attracts poor-fit traffic.
Putting it into practice#
The fastest CAC win available to most teams is not a new ad strategy or a pricing change — it is making sure every contact your reps work is real, reachable, and worth their time. Wasted touches are pure CAC inflation, and they are entirely fixable. Start by sourcing and verifying your contacts with the Tomba Email Finder: find professional emails by domain, name, or company, verify them before you send, and feed your pipeline contacts that convert instead of bounce. Lower wasted effort, higher win rate, lower CAC — in that order. Spin up the free tier, run your next target list through it, and watch your cost-per-closed-deal drop.
// get started
Find, verify and enrich your first contacts today
Start on the free plan with 25 searches a month, then scale when your team is ready.
Free plan · No credit card required · GDPR & CCPA
// about the author