CAC to LTV Ratio in 2026: The Complete Benchmark Guide
Your CAC to LTV ratio decides whether growth funds itself or quietly bleeds cash. Here is how to calculate it, benchmark it, and fix it in 2026.
Every SaaS dashboard tracks revenue, but revenue alone never tells you whether growth is healthy or hemorrhaging. The CAC to LTV ratio does. It is the single number that answers the question every board eventually asks: for every dollar you spend acquiring a customer, how many dollars do you get back?
This guide breaks down how to calculate the ratio correctly, what a healthy 2026 benchmark actually looks like, and the concrete levers — better data, tighter targeting, longer retention — that move it in your favor.
TL;DR#
- The CAC to LTV ratio compares the lifetime value of a customer (LTV) to the cost of acquiring them (CAC). It is usually written as LTV:CAC, e.g. 3:1.
- 3:1 is the widely cited healthy benchmark for B2B SaaS. Below 1:1 you lose money on every customer; above 5:1 you are probably under-investing in growth.
- The most common mistake is dirty inputs — inflated LTV, undercounted CAC, and bad lead data that quietly drags acquisition costs up.
- You improve the ratio two ways: raise LTV (retention, expansion, pricing) or lower CAC (targeting, conversion, data quality).
- Clean prospect data is an underrated lever. Bouncing emails and wrong-fit leads inflate CAC before a rep ever sends a message.
What is the CAC to LTV ratio?#
The CAC to LTV ratio measures how much value a customer generates over their lifetime relative to what you paid to win them. Think of it like a vending machine: if you put in one dollar and three dollars fall out, you keep feeding the machine. If one dollar gets you ninety cents back, you walk away. The ratio tells you which machine you are running.
Two inputs drive everything:
- Customer Acquisition Cost (CAC) — total sales and marketing spend divided by the number of new customers won in the same period. Include ad spend, salaries, tooling, commissions, and overhead. Leaving costs out is the fastest way to lie to yourself.
- Lifetime Value (LTV) — the total gross profit a customer produces before they churn. For subscription businesses, a common formula is
(Average Revenue per Account × Gross Margin %) ÷ Churn Rate.
Once you have both, the ratio is simply LTV ÷ CAC. An LTV of $9,000 against a CAC of $3,000 gives you a 3:1 ratio. For a deeper grounding on how this fits the broader operating model, see the discipline of revenue operations, which exists largely to keep metrics like this honest across sales, marketing, and finance.

How do you calculate CAC and LTV correctly?#
Most teams do not get the ratio wrong because the division is hard. They get it wrong because the inputs are sloppy. Here is the structured breakdown of what belongs in each number.
- Fully-loaded CAC. Add every cost tied to acquisition: paid media, content production, SDR and AE salaries, sales tooling, data subscriptions, and the portion of overhead that supports go-to-market. A "blended" CAC that only counts ad spend will look great and mean nothing.
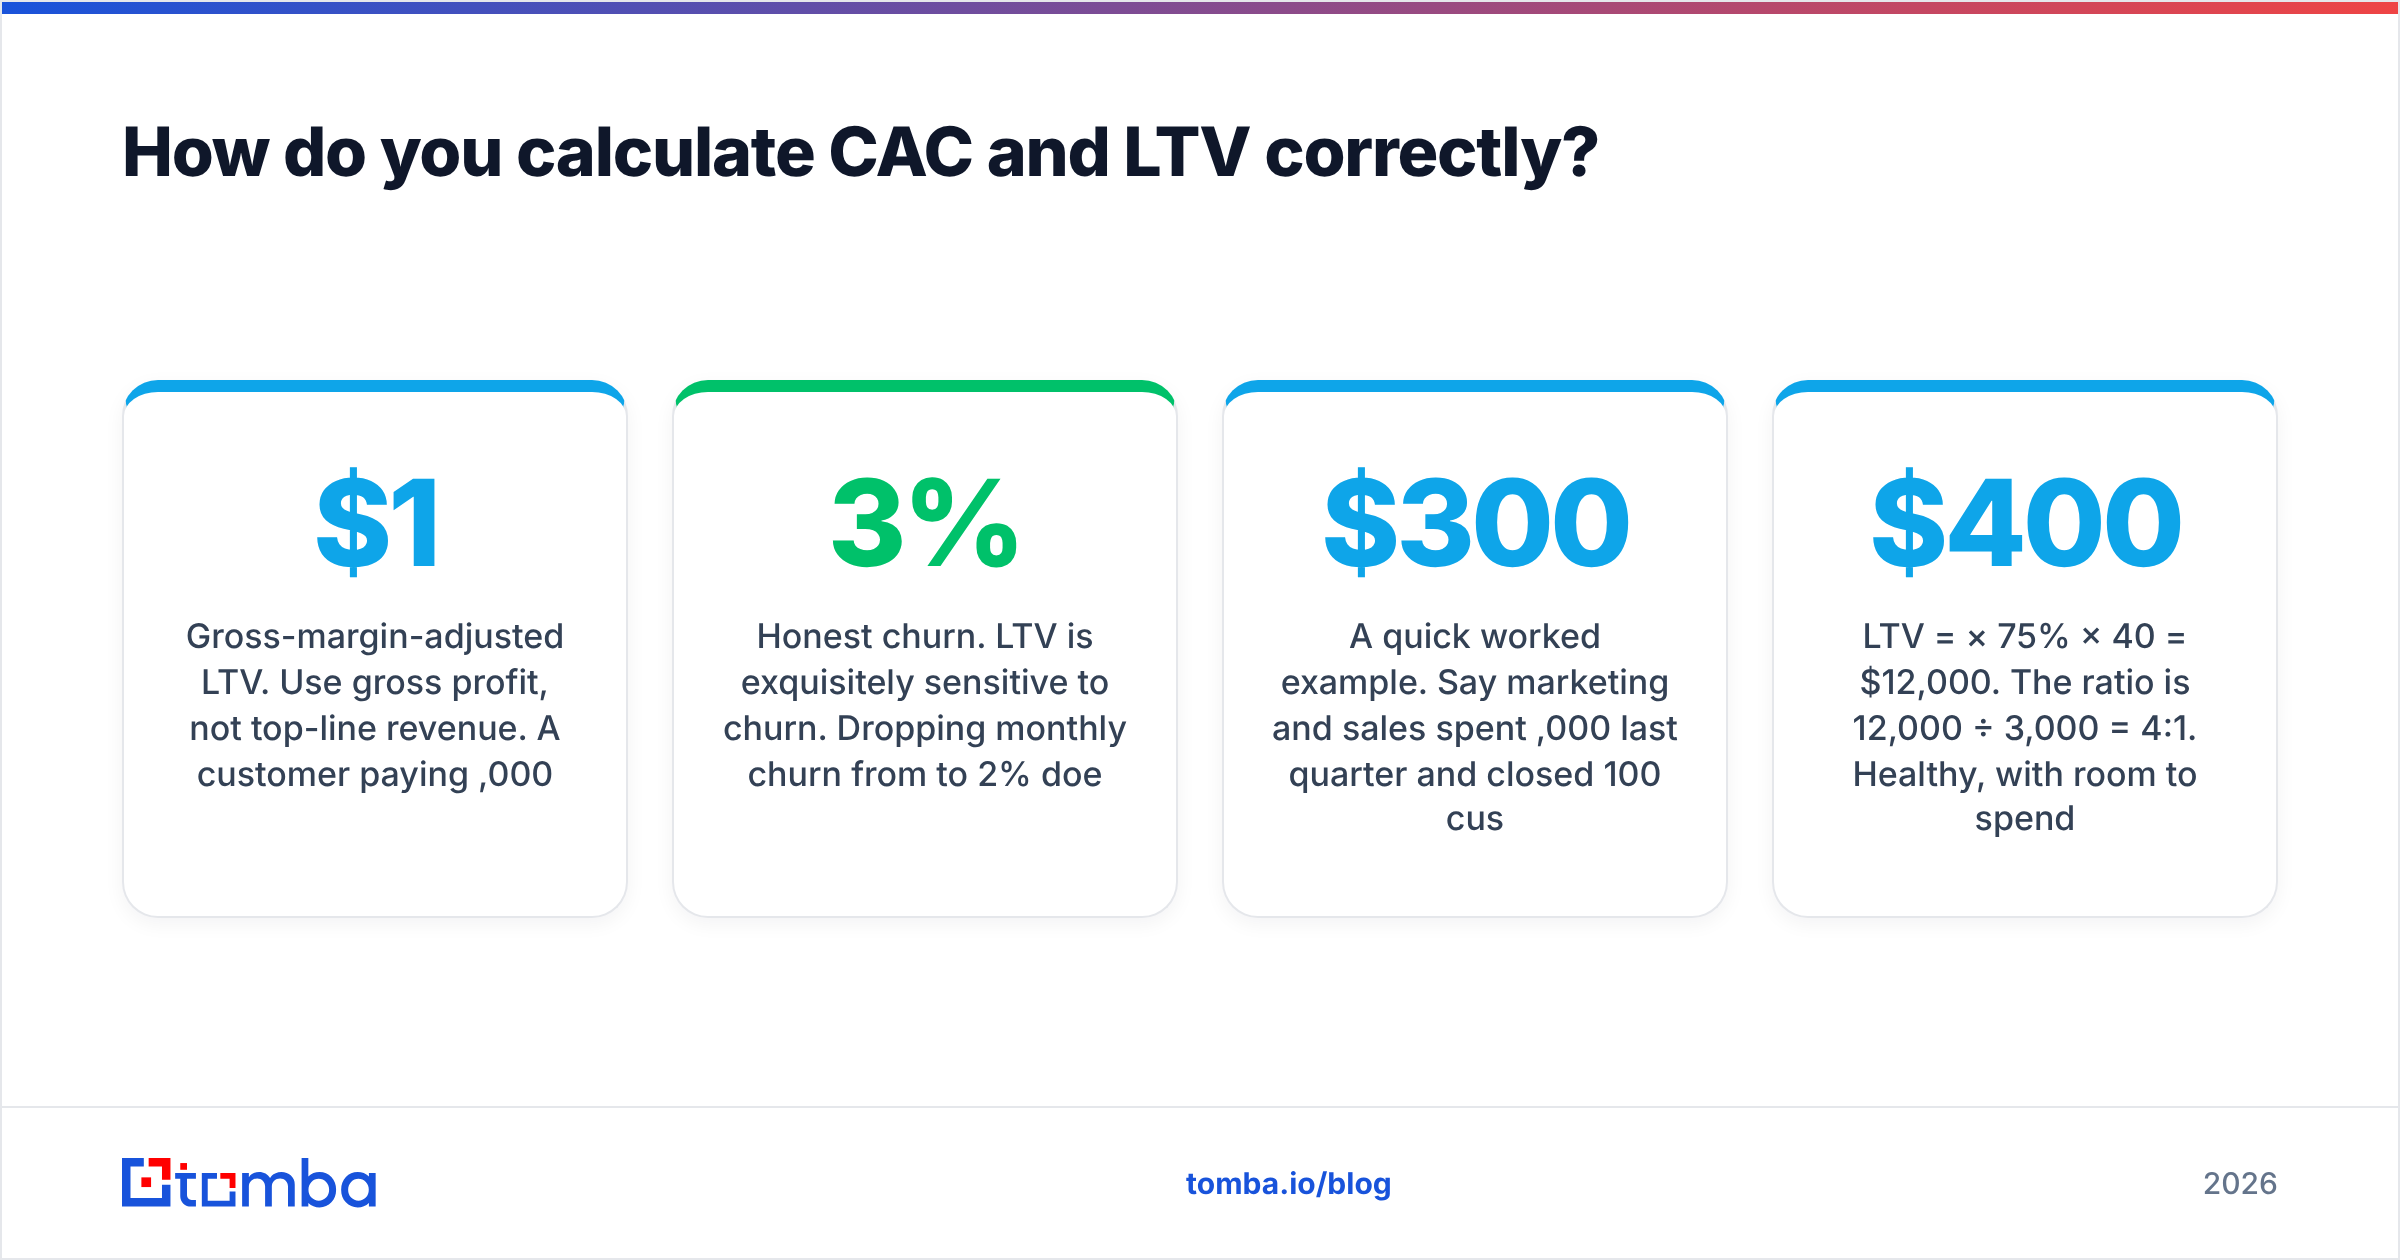
- Gross-margin-adjusted LTV. Use gross profit, not top-line revenue. A customer paying $1,000/month at 80% margin is worth far less than one paying the same at 95% margin. Revenue-based LTV systematically overstates the ratio.
- Honest churn. LTV is exquisitely sensitive to churn. Dropping monthly churn from 3% to 2% does not shave a third off the denominator — it extends average customer lifetime from ~33 months to 50, inflating LTV by roughly 50%.
- Matched time windows. Measure CAC and the cohort it produced over comparable periods. Comparing this quarter's spend to customers won two years ago produces nonsense.
- Segment, don't average. A single company-wide ratio hides the truth. Enterprise and self-serve often have wildly different economics; blend them and you optimize for neither.
A quick worked example. Say marketing and sales spent $300,000 last quarter and closed 100 customers. CAC is $3,000. Those customers pay $400/month at 75% gross margin, and you lose 2.5% of them monthly (a 40-month average lifetime).
LTV = $400 × 75% × 40 = $12,000. The ratio is 12,000 ÷ 3,000 = 4:1. Healthy, with room to spend more aggressively on acquisition.
What is a good CAC to LTV ratio in 2026?#
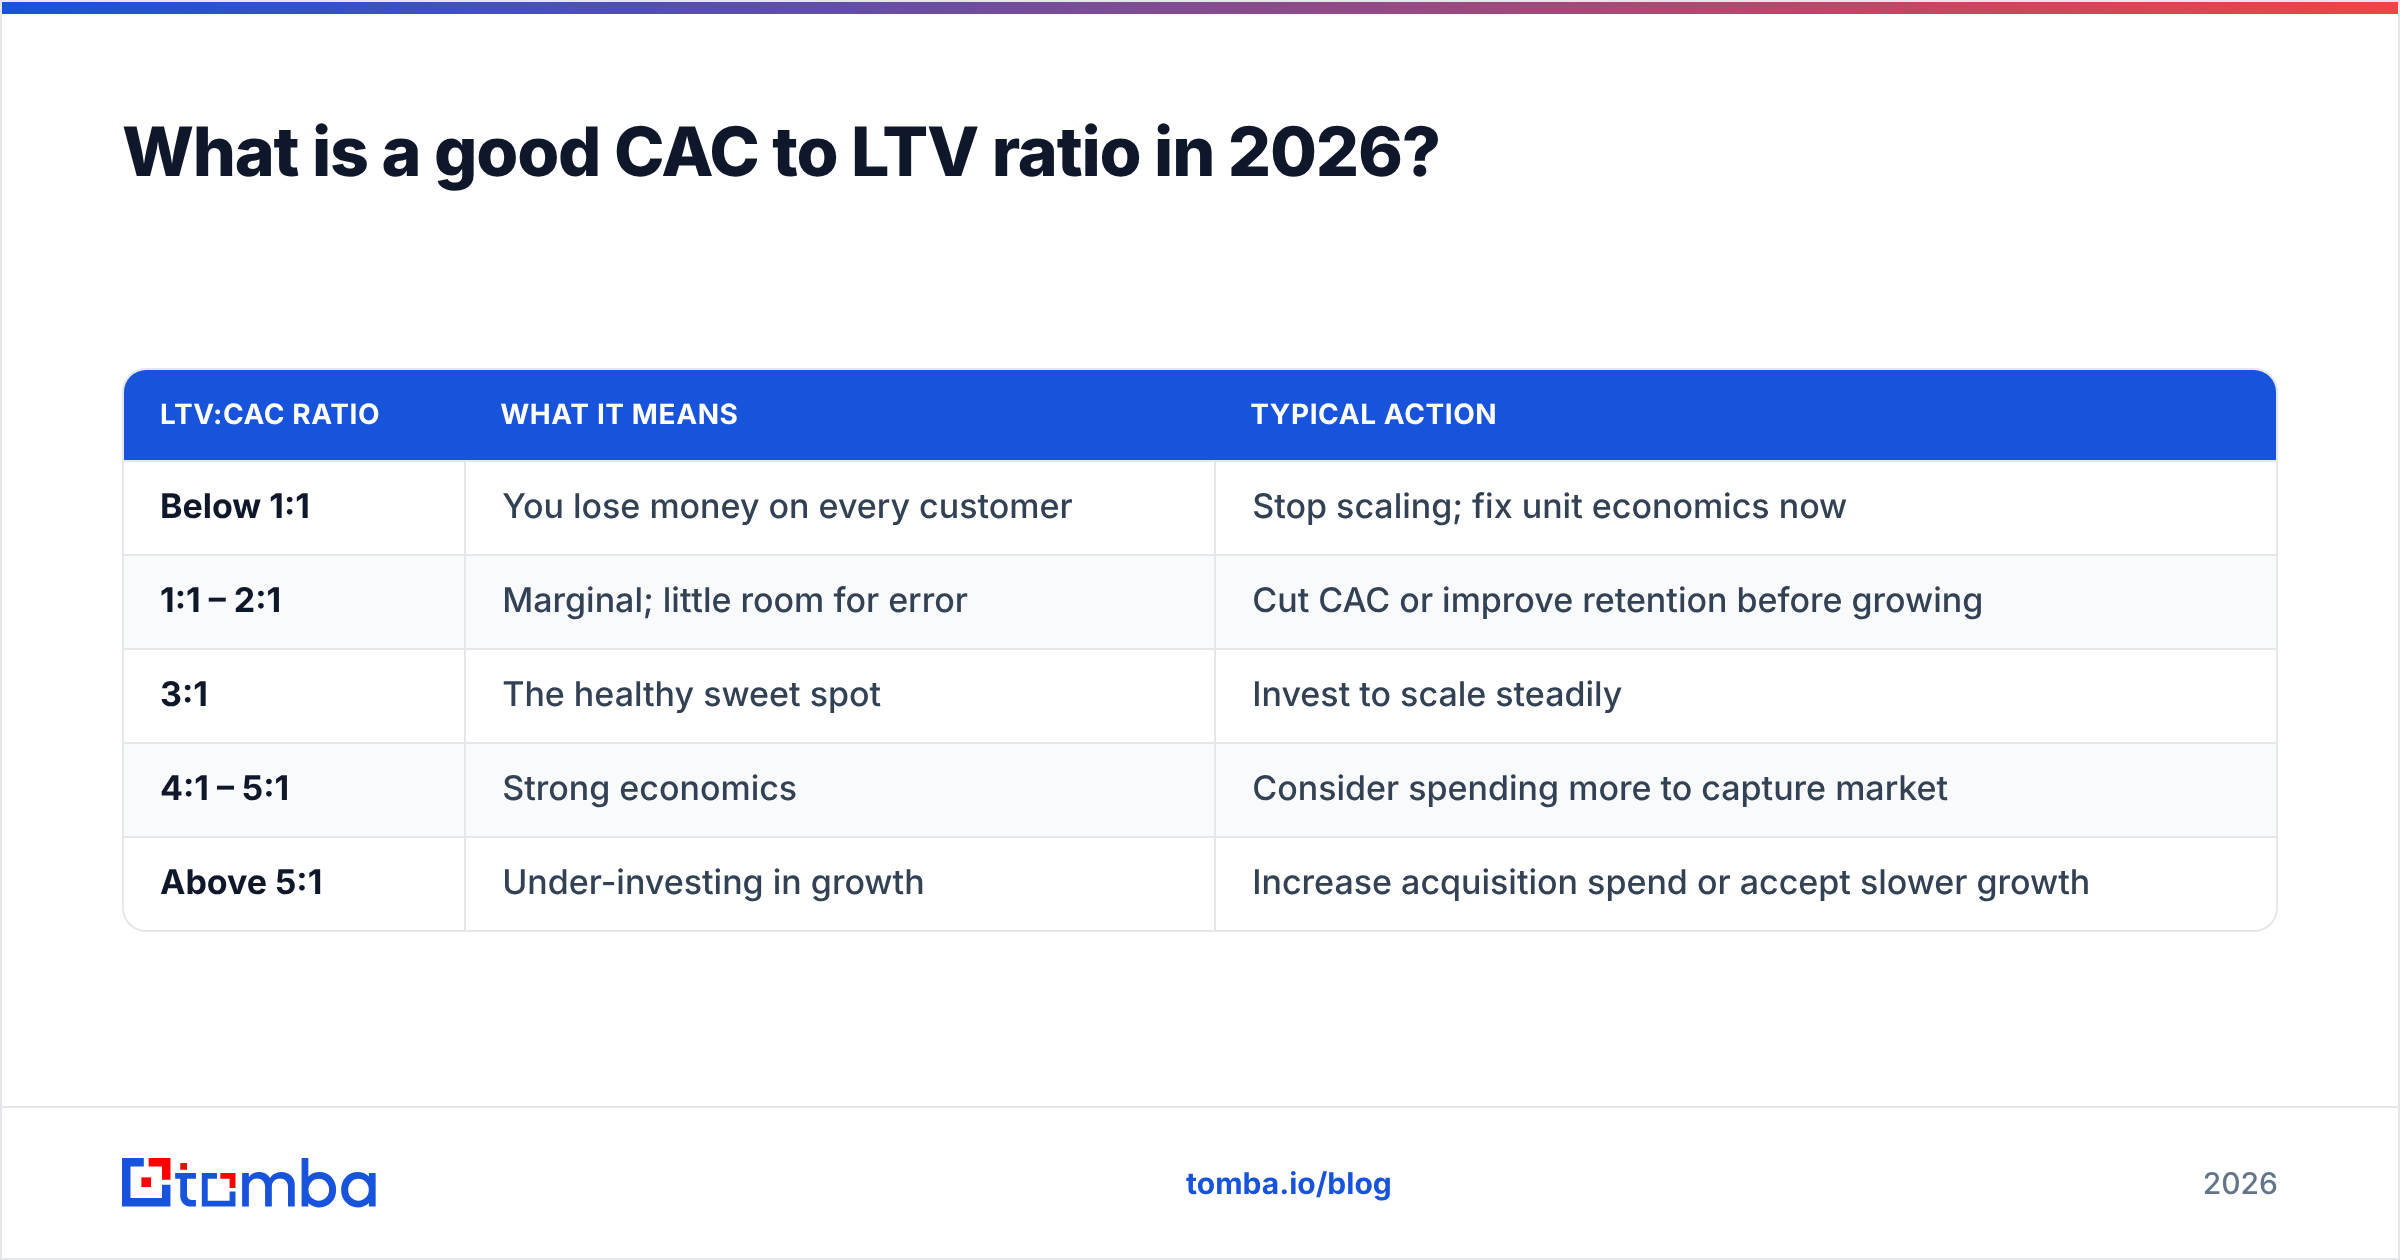
The short answer: aim for 3:1, treat 1:1 as a fire alarm, and view anything above 5:1 as a signal you are leaving growth on the table. That benchmark has held remarkably steady across SaaS, and analyst firms like Gartner and the broader SaaS metrics literature continue to anchor to it.
But the headline number deserves nuance. Here is how to read where you land.
| LTV:CAC ratio | What it means | Typical action |
|---|---|---|
| Below 1:1 | You lose money on every customer | Stop scaling; fix unit economics now |
| 1:1 – 2:1 | Marginal; little room for error | Cut CAC or improve retention before growing |
| 3:1 | The healthy sweet spot | Invest to scale steadily |
| 4:1 – 5:1 | Strong economics | Consider spending more to capture market |
| Above 5:1 | Under-investing in growth | Increase acquisition spend or accept slower growth |
A second benchmark pairs with the ratio: CAC payback period, the number of months it takes to recoup acquisition cost. Best-in-class B2B SaaS recovers CAC in under 12 months; 12–18 is acceptable; beyond 24 months strains cash flow even when the lifetime ratio looks fine. The two metrics together — ratio plus payback — give you a far more complete picture than either alone.
One caveat for 2026: rising data and tooling costs have pushed CAC up across most categories, which means teams that win on input efficiency — cleaner lists, better-fit targeting, fewer wasted touches — increasingly out-earn teams that simply outspend.
Why does data quality move the ratio more than you think?#
CAC is not just an advertising number. A large slice of acquisition cost is rep time, and rep time is destroyed by bad data. Every bounced email, every disconnected phone number, every wrong-fit lead is paid-for effort that produces zero pipeline.
Picture two SDR teams with identical budgets. Team A works a list where 30% of emails bounce and a quarter of contacts are mistargeted. Team B works a verified, enriched list. Team B books more meetings from the same hours, which means a lower CAC and a higher ratio — without changing the ad budget, the pricing, or the product. The lever was data.
This is why a clean acquisition motion starts upstream. Using an accurate email finder and a reliable email verifier before a sequence ever launches strips out the dead weight that silently inflates CAC. Layering in data enrichment so reps only chase fits-the-ICP accounts compounds the effect. The deliverability discipline matters too — a poisoned sender reputation from bouncing campaigns raises the cost of every future email.

How do you actually improve your CAC to LTV ratio?#
There are only two directions to push: drive LTV up or drive CAC down. The best teams do both, in this rough order of leverage.
Raise LTV first — it is usually cheaper than cutting CAC.
- Attack churn. Because LTV scales inversely with churn, retention is the highest-leverage number on the board. A reactivation playbook, better onboarding, and a clear value milestone in the first 30 days move it more than any pricing tweak.
- Expand existing accounts. Upsells and cross-sells raise average revenue per account with near-zero incremental CAC, so every expansion dollar lands almost entirely in the numerator.
- Revisit pricing and margin. Even a modest price increase or a shift to higher-margin tiers flows directly into LTV. Most SaaS companies underprice for years.
Then lower CAC.
- Tighten targeting. Spend against your highest-converting segments, not the widest possible audience. A smaller, better-fit B2B database beats a giant generic one because conversion, not volume, drives CAC.
- Improve conversion rates. Faster lead response, better sales collateral, and tighter handoffs between marketing and sales mean fewer dollars per closed deal.
- Clean your inputs. As covered above, verified contact data reduces wasted rep hours and protects deliverability — a quiet but durable CAC reduction.
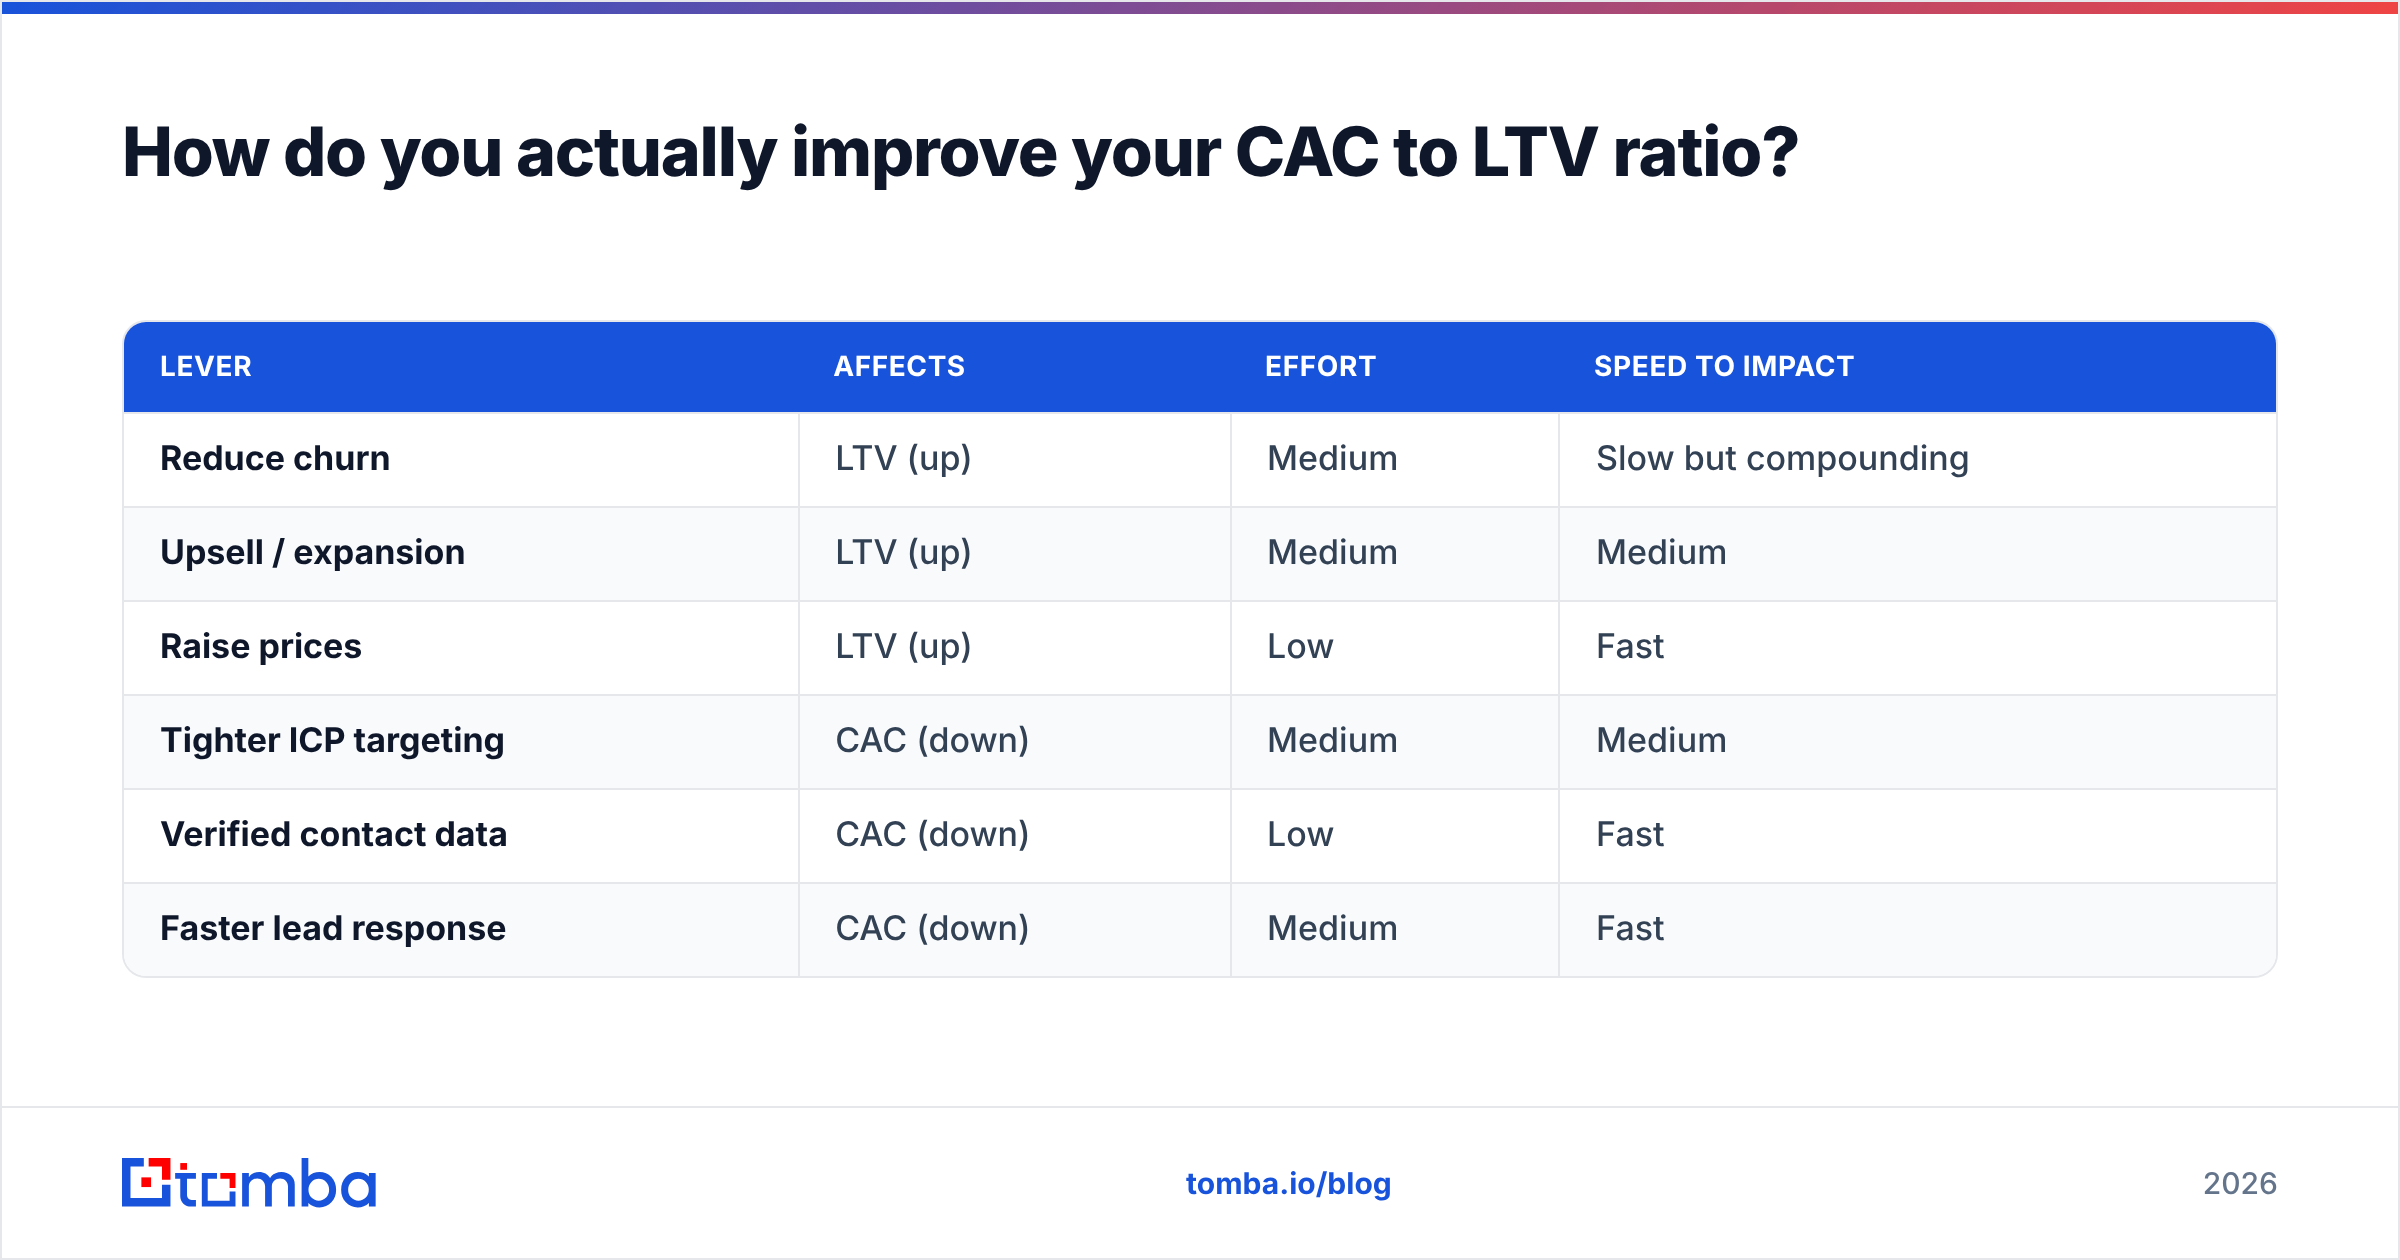
To put the trade-offs side by side:
| Lever | Affects | Effort | Speed to impact |
|---|---|---|---|
| Reduce churn | LTV (up) | Medium | Slow but compounding |
| Upsell / expansion | LTV (up) | Medium | Medium |
| Raise prices | LTV (up) | Low | Fast |
| Tighter ICP targeting | CAC (down) | Medium | Medium |
| Verified contact data | CAC (down) | Low | Fast |
| Faster lead response | CAC (down) | Medium | Fast |
Notice that two of the fastest-impact, lowest-effort levers — raising prices and using verified data — are also the most overlooked. Teams obsess over ad creative while ignoring the cheaper wins sitting in their pricing page and their CRM hygiene.
How often should you measure the ratio?#
Quarterly is the practical cadence for the headline number, with monthly tracking of the inputs. The ratio itself is a lagging metric — churn and lifetime only resolve over time — so reacting to it weekly invites overcorrection. Instead, watch the leading indicators monthly: CAC by channel, payback period, lead-to-meeting conversion, and bounce rate on outbound.
A useful operating rhythm:
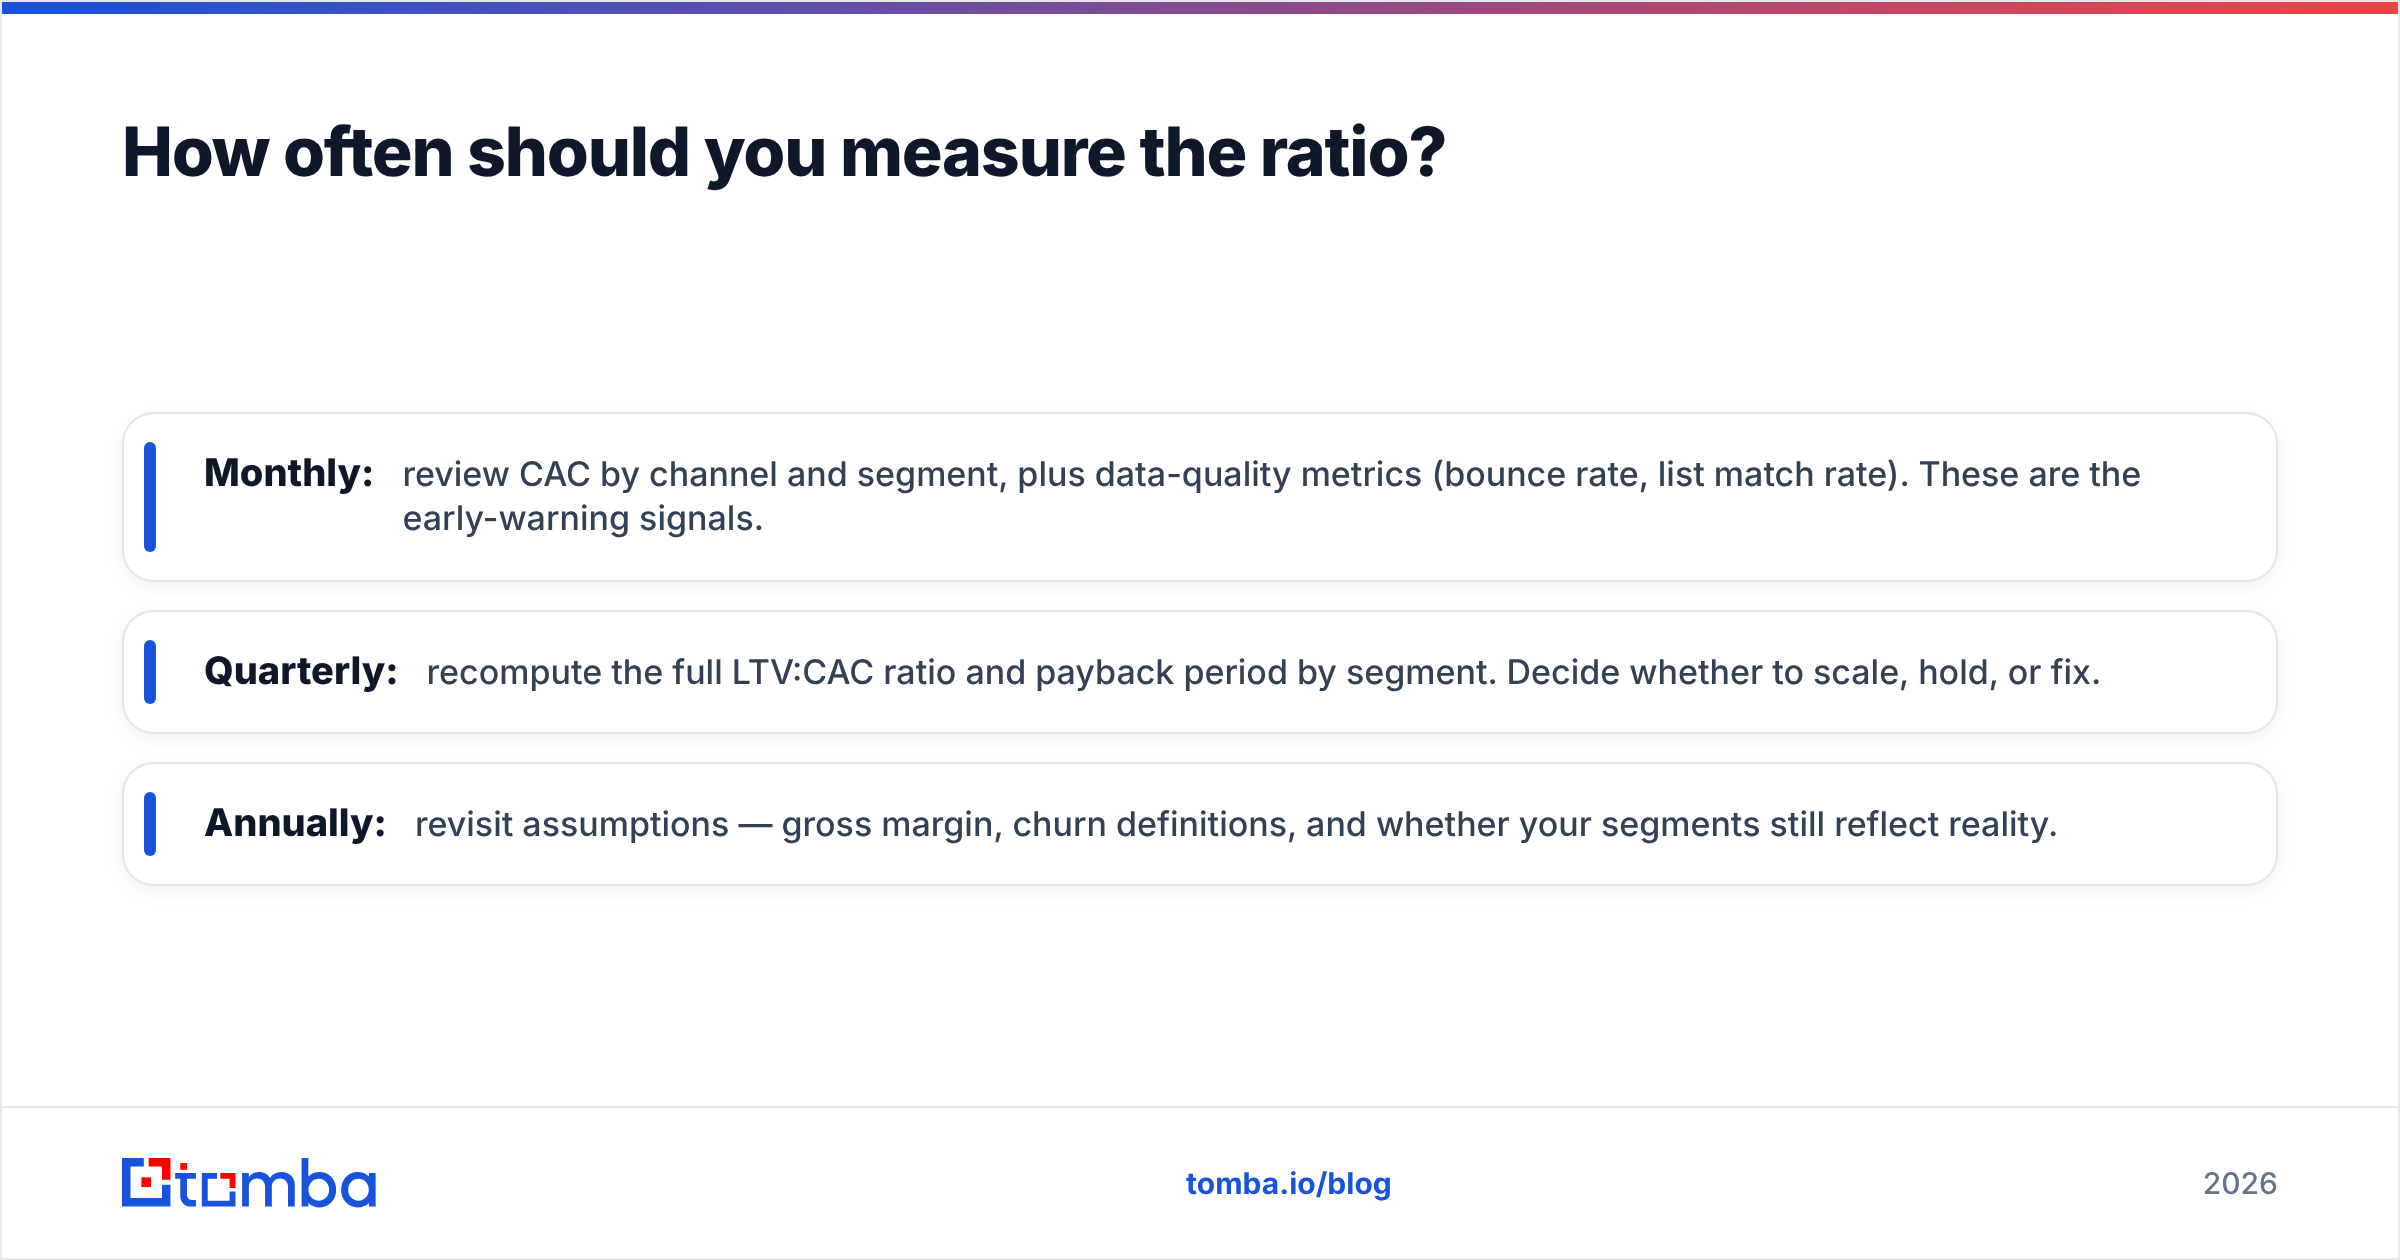
- Monthly: review CAC by channel and segment, plus data-quality metrics (bounce rate, list match rate). These are the early-warning signals.
- Quarterly: recompute the full LTV:CAC ratio and payback period by segment. Decide whether to scale, hold, or fix.
- Annually: revisit assumptions — gross margin, churn definitions, and whether your segments still reflect reality.
Tools matter here too. Platforms like HubSpot centralize the revenue and cost data the calculation depends on, while peer benchmarks on G2 help you sanity-check where your category actually sits. The goal is not a perfect number — it is a number you trust enough to act on.
Common mistakes that distort the ratio#
Even disciplined teams trip over the same few errors. Watch for these:
- Counting revenue instead of gross profit in LTV. Inflates the ratio, hides margin problems.
- Using blended CAC that excludes salaries and tooling. Makes acquisition look cheaper than it is.
- Averaging across segments. Masks a money-losing self-serve motion behind a profitable enterprise one.
- Ignoring payback period. A 4:1 ratio with a 30-month payback can still starve you of cash.
- Treating the ratio as static. It drifts as CAC inflates and cohorts mature; a number you computed last year is fiction today.
Each of these is a data problem at heart — wrong inputs, wrong granularity, or stale measurement. Fix the data and the ratio starts telling the truth.
The bottom line#
The CAC to LTV ratio is the closest thing GTM has to a fitness test. A healthy 3:1 means growth funds itself; a sagging 1.5:1 means you are buying revenue at a loss and calling it traction. The path to a better ratio runs through retention, pricing, targeting, and — more than most teams admit — the quality of the data feeding the top of the funnel.
That last lever is where you can move fastest. Bouncing emails and wrong-fit prospects inflate CAC before a single deal is worked, and they are entirely preventable. Start by cleaning the inputs: use Tomba's Email Finder to build verified, ICP-matched prospect lists, pair it with verification and enrichment, and watch your acquisition cost fall without touching your ad budget. You can test it on the free tier (25 searches/month) and scale into the Starter plan at $49/month as your pipeline grows — full pricing details are on the site. Lower CAC, cleaner data, a healthier ratio. That is unit economics working for you instead of against you.
// get started
Find, verify and enrich your first contacts today
Start on the free plan with 25 searches a month, then scale when your team is ready.
Free plan · No credit card required · GDPR & CCPA
// about the author