Churn Analysis in 2026: Metrics, Models & How to Reduce It
A practical 2026 guide to churn analysis: the metrics that matter, how to segment at-risk accounts, build a churn model, and turn the findings into retention revenue.

TL;DR
- Churn analysis is the disciplined study of why customers leave — not just how many, but which ones, when, and why — so you can intervene before the renewal date.
- Track customer churn, revenue churn, and net revenue retention together. One number lies; three numbers tell the truth.
- Segment churn by cohort, plan, acquisition channel, and usage. Aggregate churn hides the accounts you can actually save.
- Predictive churn models work, but only on clean, enriched data. Garbage contact and account data produces garbage risk scores.
- The payoff is concrete: a 5% lift in retention can raise profit 25%+ (Bain). Churn analysis is where RevOps earns its seat.
What is churn analysis?#
Churn analysis is the practice of measuring and explaining customer loss so you can reduce it. Think of it like a hospital triage system: you don't treat every patient identically, you measure vital signs, sort by risk, and send the critical cases to the front of the line. Churn analysis does the same for your customer base — it scores accounts by health, surfaces the ones bleeding, and routes them to the right intervention before they cancel.
Technically, churn analysis combines three things: measurement (the rate and dollar value of customers leaving), diagnosis (the patterns and root causes behind those departures), and prediction (which current accounts will leave next). Most teams stop at measurement — they report a churn percentage in the monthly board deck and move on. That number, on its own, is nearly useless. It tells you the building is on fire without telling you which floor.
Done properly, churn analysis sits at the center of revenue operations. It pulls from your billing system, product analytics, support tickets, and CRM, then turns that mess into a ranked list of accounts a human can act on this week.
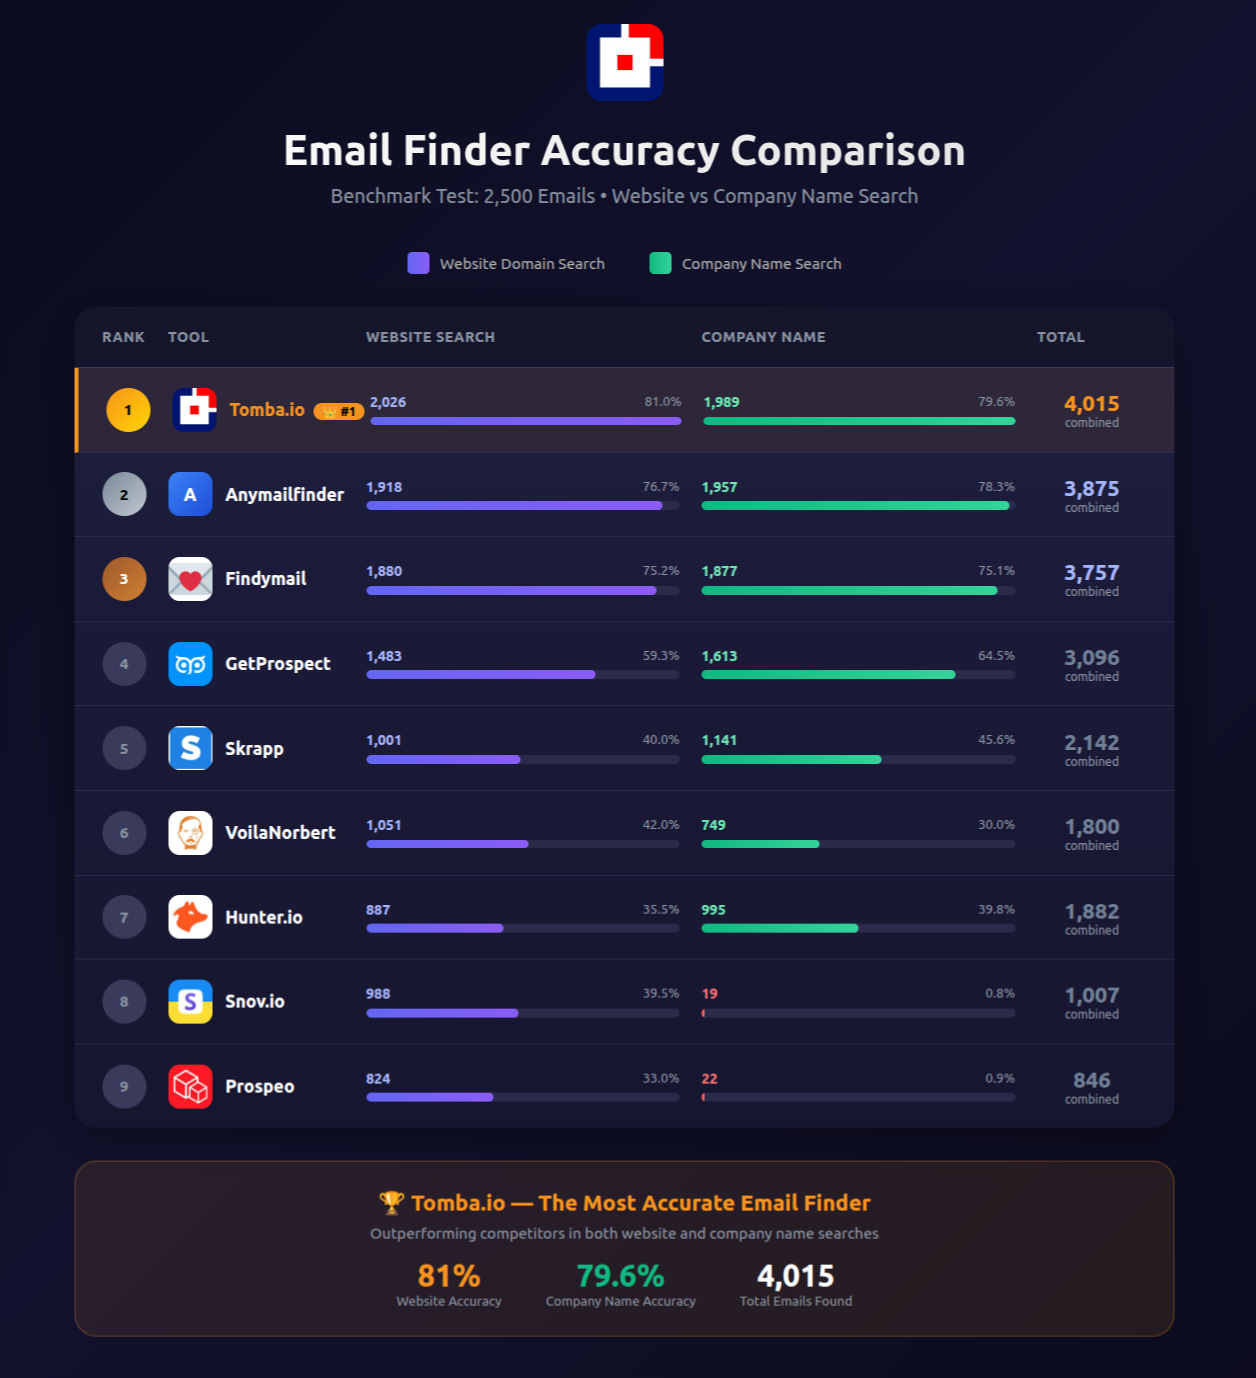
Wait — ignore that placeholder; the visual you want here is the contrast between guessing at churn and analyzing it:
(Use the meme below.)

Which churn metrics actually matter?#
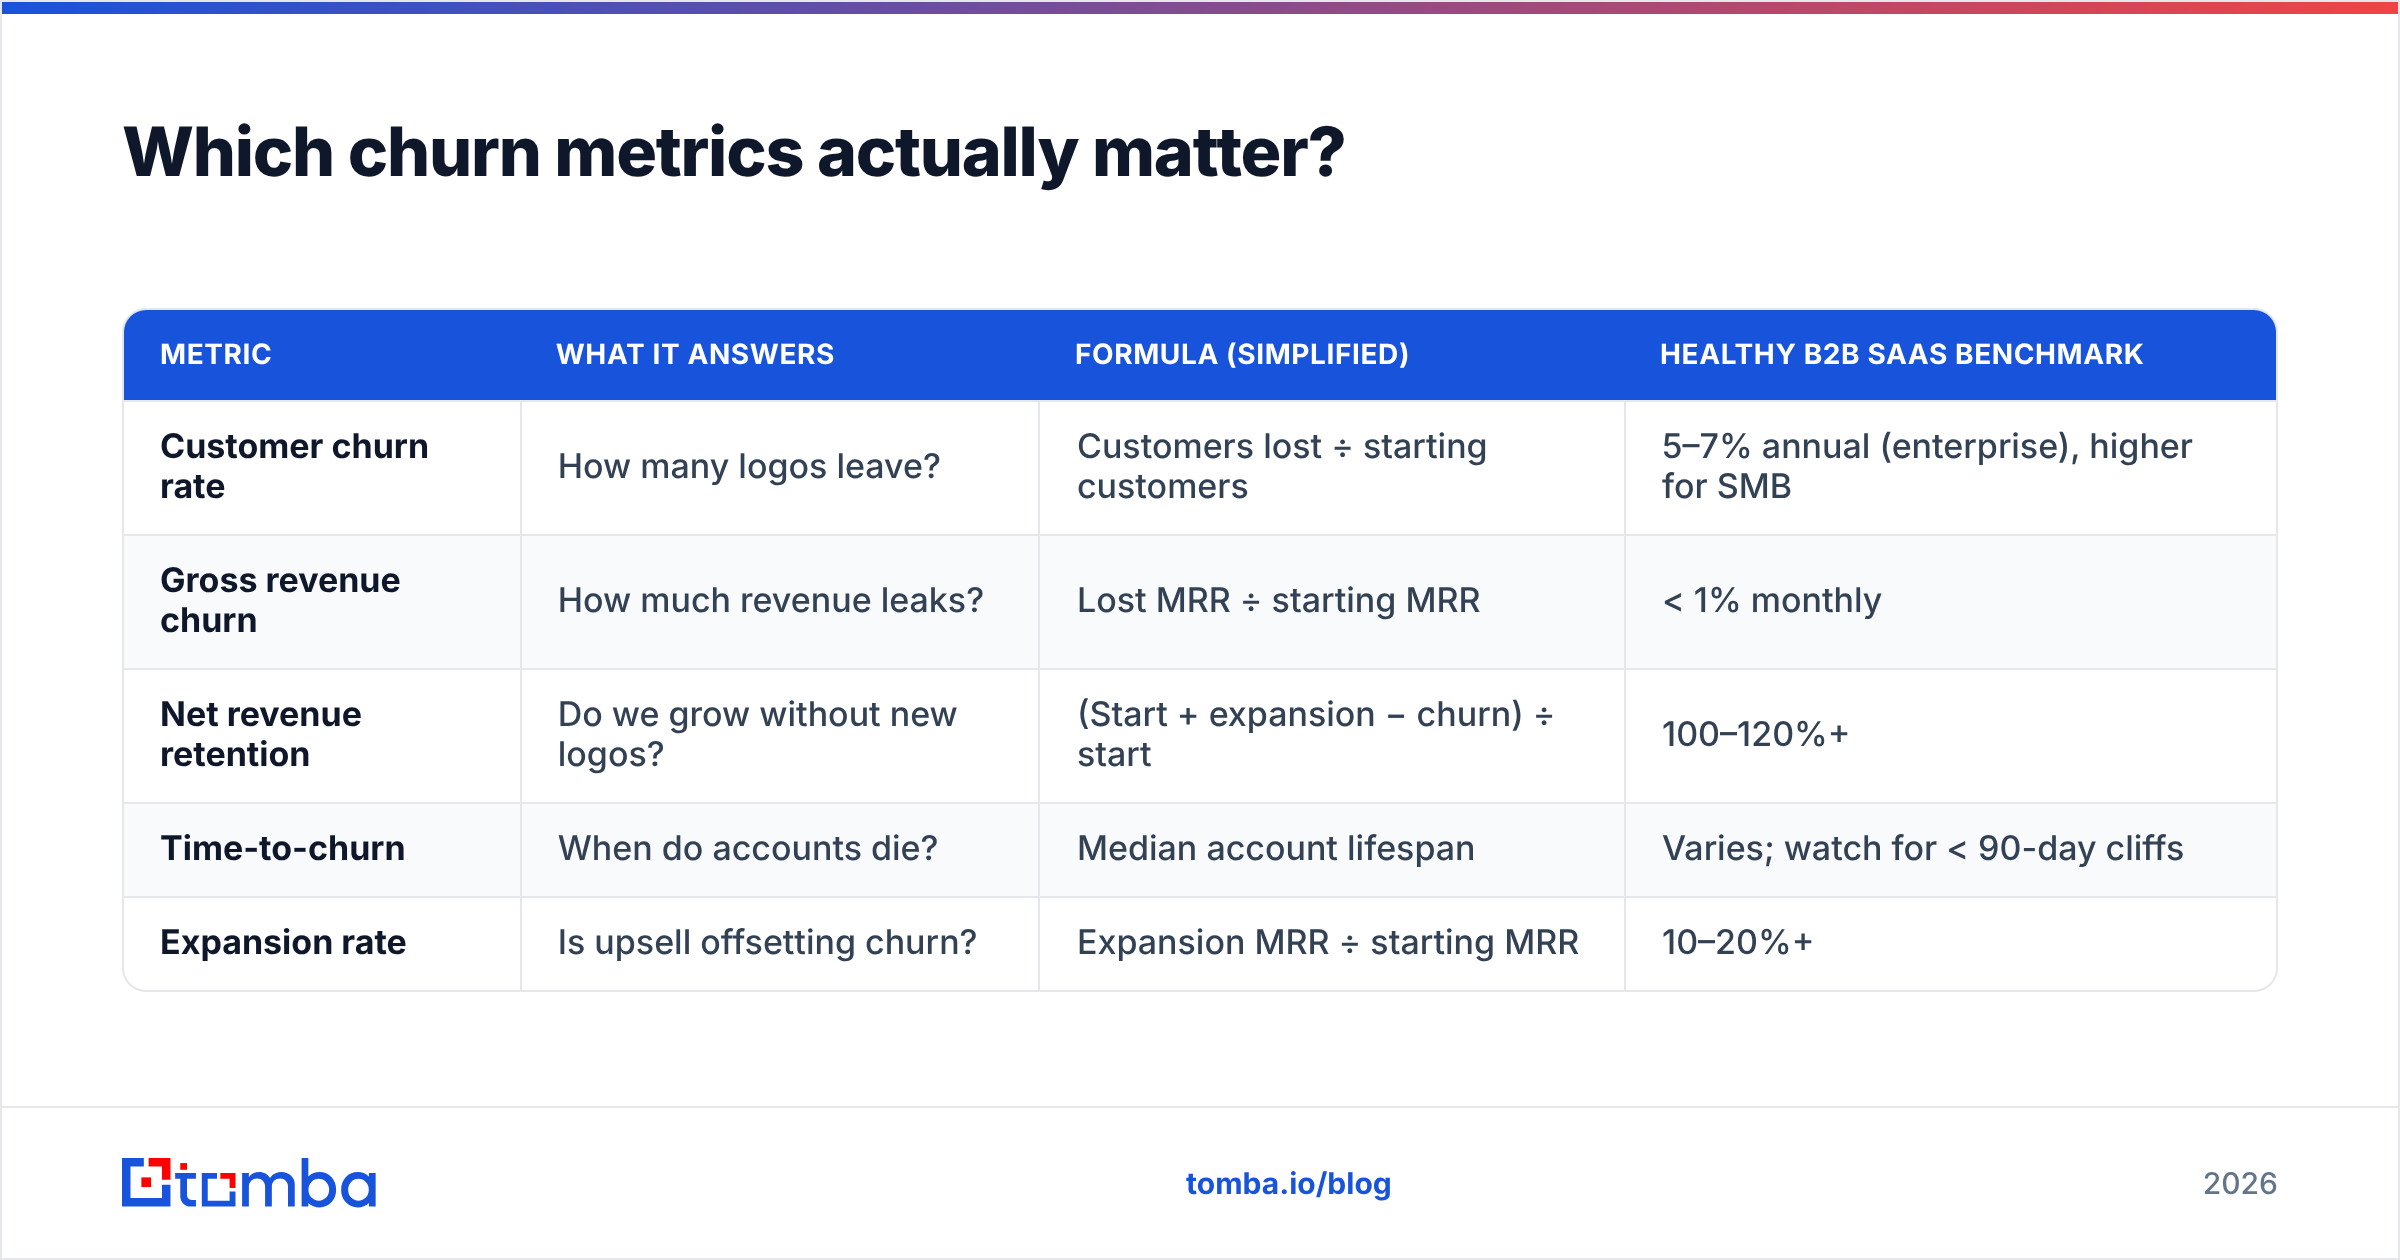
There is no single "churn rate." There are several, and reporting only one is how teams fool themselves. Here are the core metrics and what each one is for.
- Customer churn rate — the percentage of customers who left in a period. Formula:
(customers lost ÷ customers at start) × 100. Good for understanding logo retention and product-market fit at the low end. - Revenue churn rate — the percentage of recurring revenue lost. This weights a $50k enterprise account far more heavily than a $20/mo self-serve user. If your logos churn but your dollars don't, you have a pricing/segment problem, not a product problem.
- Net revenue retention (NRR) — revenue churn offset by expansion (upsells, seat growth). NRR above 100% means you grow even if you acquire zero new customers. This is the metric investors care about most in 2026.
- Gross revenue retention (GRR) — revenue churn with no expansion credit. It's the honest floor of your retention. NRR can mask a leaky bucket; GRR cannot.
- Time-to-churn — how long accounts survive before leaving. Surfaces whether you have an onboarding problem (early churn) or a value-decay problem (late churn).
The mistake is averaging these into a vibe. A SaaS business can post a healthy 110% NRR while quietly losing 30% of its small-business logos every year — fine until the expansion engine stalls. Report customer churn, revenue churn, and NRR side by side, every month, by segment.
| Metric | What it answers | Formula (simplified) | Healthy B2B SaaS benchmark |
|---|---|---|---|
| Customer churn rate | How many logos leave? | Customers lost ÷ starting customers | 5–7% annual (enterprise), higher for SMB |
| Gross revenue churn | How much revenue leaks? | Lost MRR ÷ starting MRR | < 1% monthly |
| Net revenue retention | Do we grow without new logos? | (Start + expansion − churn) ÷ start | 100–120%+ |
| Time-to-churn | When do accounts die? | Median account lifespan | Varies; watch for < 90-day cliffs |
| Expansion rate | Is upsell offsetting churn? | Expansion MRR ÷ starting MRR | 10–20%+ |
How do you actually run a churn analysis?#
The conclusion first: segment before you summarize. A blended company-wide churn number is the average of healthy and dying cohorts, and the average hides exactly the accounts you can save.
A workable process looks like this:
- Pull the raw events. Cancellations, downgrades, and contraction with timestamps. Tie each to an account ID so you can join other data later.
- Cohort it. Group customers by signup month, plan tier, acquisition channel, and company size. Plot retention curves per cohort. You're looking for the cohort that drops off a cliff.
- Layer in behavior. Join product usage (logins, feature adoption, seats active), support volume, and NPS. Churned accounts almost always show a leading signal — declining logins, an unresolved ticket, a champion who left.
- Find the root cause. Run win-back interviews and read cancellation reasons. Quantitative data tells you who and when; qualitative tells you why. You need both.
- Score current accounts. Apply what you learned to live customers and produce a ranked at-risk list your CS team works weekly.
Step 3 is where most analyses break, and the reason is almost always data quality. If your CRM account records are stale — wrong contacts, missing firmographics, a champion who changed jobs six months ago — your churn signals are noise. This is why retention teams invest in data enrichment: an enriched, current account record is the difference between a predictive model and a random number generator.

Can you predict churn before it happens?#
Yes — and in 2026 you should. Predictive churn modeling has moved from data-science luxury to RevOps standard, helped by accessible tooling and better data pipelines. The idea is simple: take the patterns that preceded past churn and use them to flag current accounts showing the same pattern.
A basic but effective model uses these signal categories:
- Engagement signals — login frequency, daily/weekly active users, feature breadth. A steady decline over 30–60 days is the single strongest predictor.
- Relationship signals — champion still employed? Number of stakeholders engaged? Single-threaded accounts churn far more than multi-threaded ones.
- Commercial signals — recent downgrade, support escalations, invoice disputes, contract approaching renewal with no QBR booked.
- Firmographic signals — company growth or contraction, layoffs, acquisition. An account in distress churns regardless of how much they like your product.
You don't need a deep neural net to start. A logistic regression — or even a weighted scorecard — over those signals beats gut feel dramatically. The constraint is never the algorithm; it's whether the underlying account and contact data is accurate. Relationship and firmographic signals in particular depend on knowing who your stakeholders are and whether they still work there — exactly the kind of fact that decays silently in a CRM.
This is the link people miss: churn prediction is a data-freshness problem disguised as a modeling problem. Teams that keep account contacts current with a reliable B2B database and re-verify stakeholders on a schedule get models that actually hold up. Teams that don't get a confident-looking dashboard built on six-month-old contacts.
What causes churn, and which causes can you fix?#
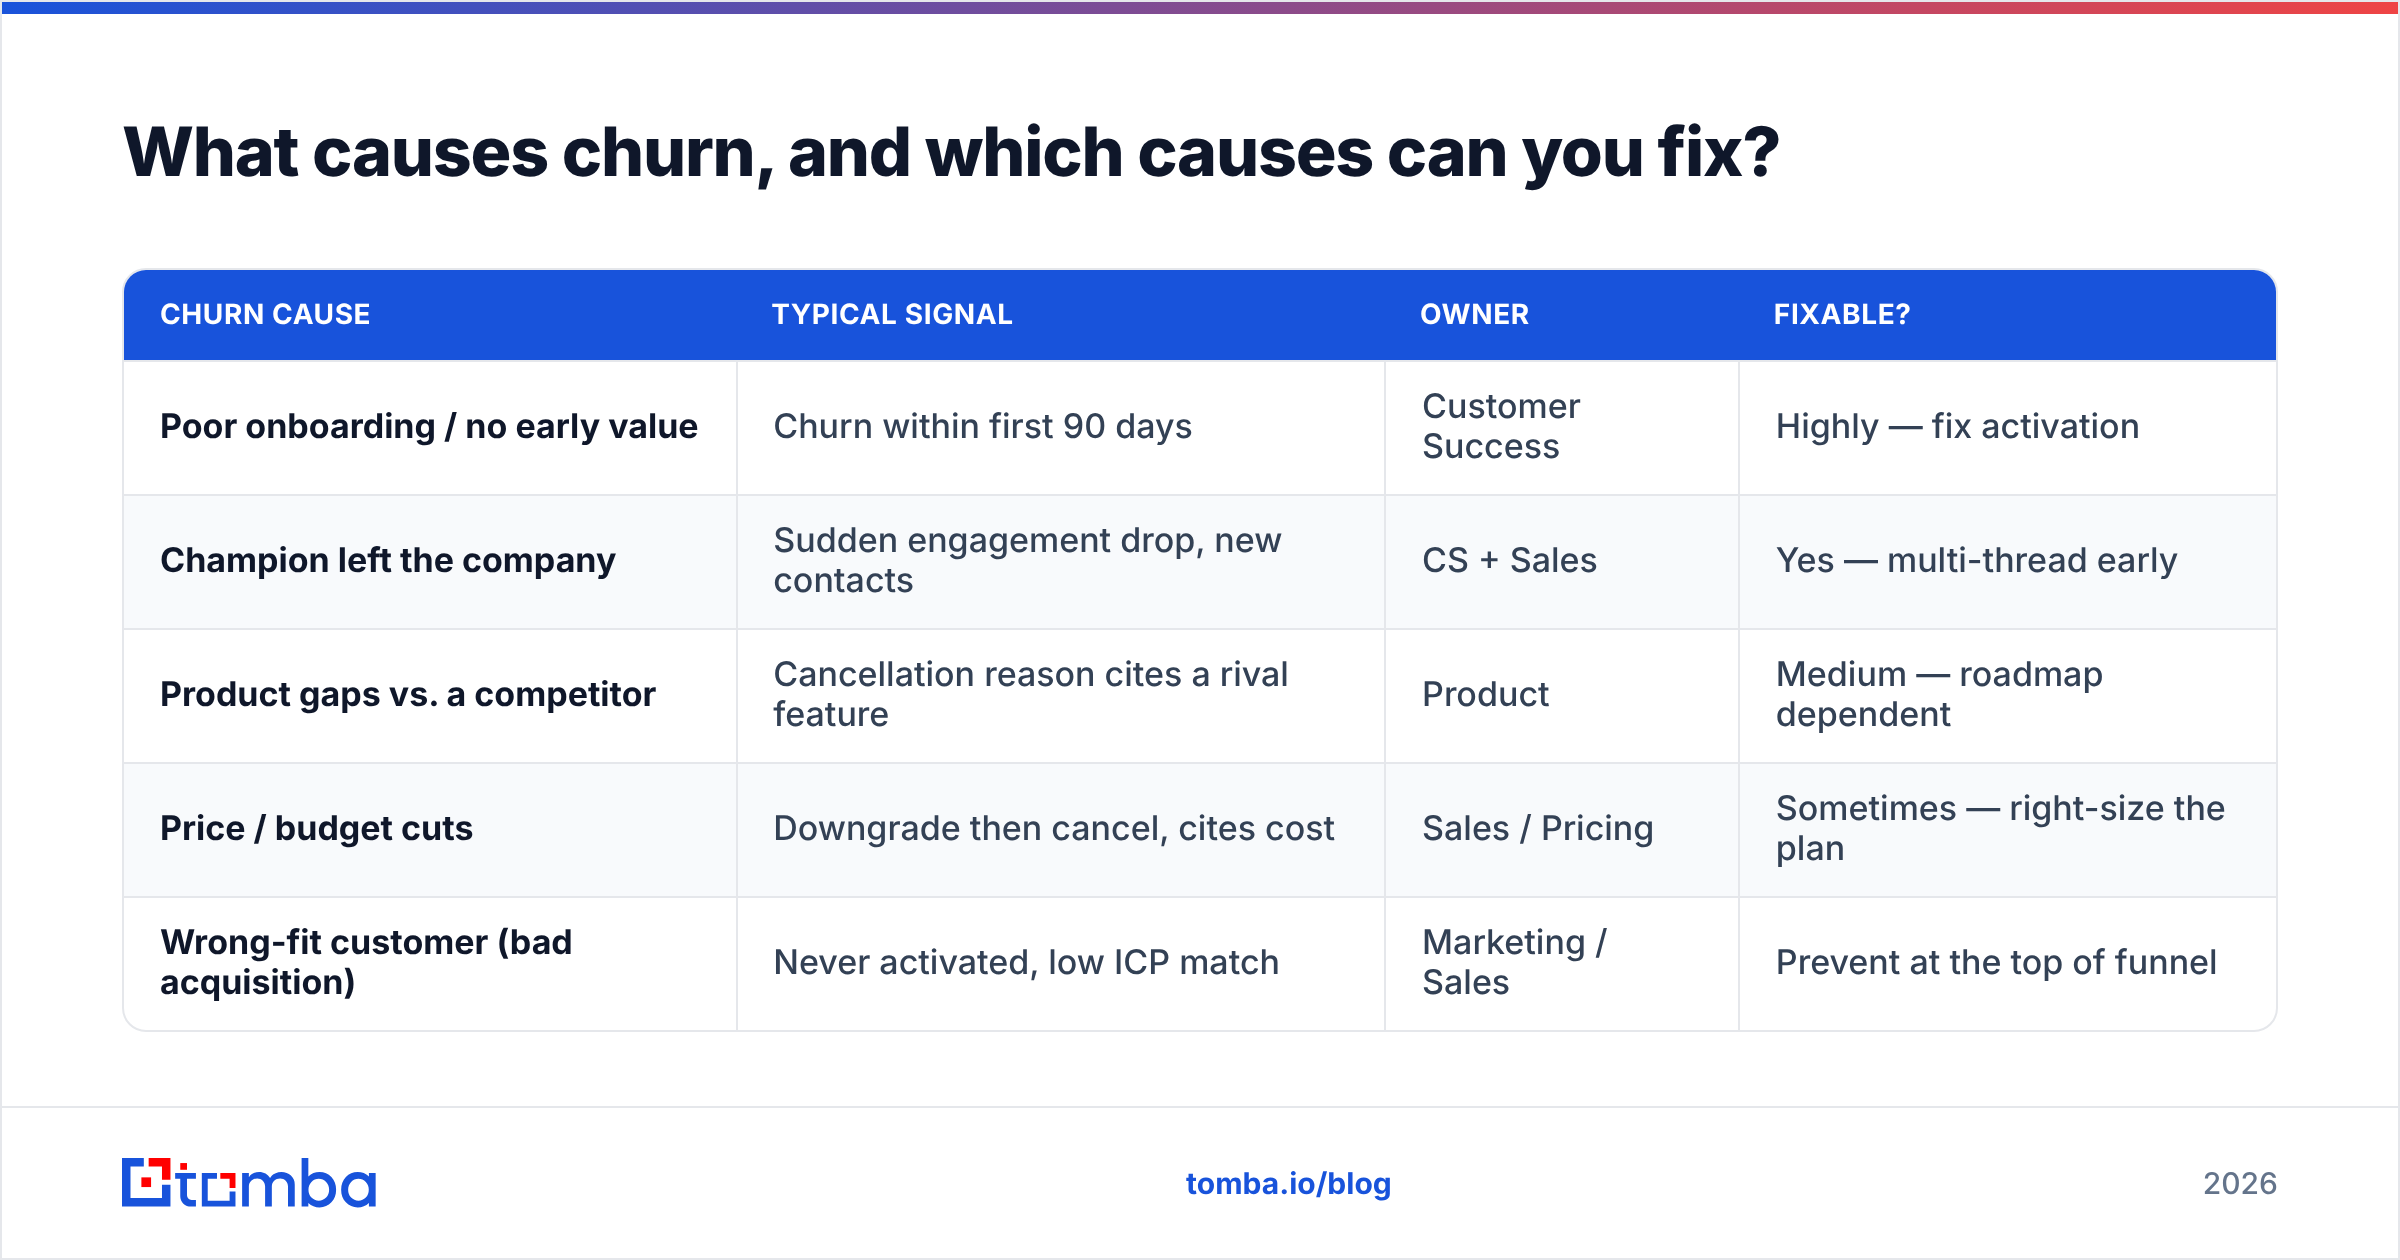
Group root causes into three buckets, because each demands a different owner and fix.
| Churn cause | Typical signal | Owner | Fixable? |
|---|---|---|---|
| Poor onboarding / no early value | Churn within first 90 days | Customer Success | Highly — fix activation |
| Champion left the company | Sudden engagement drop, new contacts | CS + Sales | Yes — multi-thread early |
| Product gaps vs. a competitor | Cancellation reason cites a rival feature | Product | Medium — roadmap dependent |
| Price / budget cuts | Downgrade then cancel, cites cost | Sales / Pricing | Sometimes — right-size the plan |
| Wrong-fit customer (bad acquisition) | Never activated, low ICP match | Marketing / Sales | Prevent at the top of funnel |
The most overlooked cause is the departed champion. Your day-to-day contact gets a new job, the replacement never gets onboarded, usage quietly drops, and the renewal dies. The defense is to multi-thread accounts and to catch the personnel change fast. When a champion leaves, you need their replacement's contact details now — finding the new decision-maker quickly with an email finder and re-engaging within days is often the difference between a save and a lost logo.
Wrong-fit acquisition is the other silent killer. If marketing optimizes for volume and sales closes anyone with a pulse, you import churn at signup. Tightening your ideal customer profile — and measuring churn by acquisition channel — usually reveals one or two channels quietly poisoning your retention numbers.
How does churn analysis fit into the wider RevOps stack?#
Churn analysis is not a standalone report; it's a feedback loop into acquisition, onboarding, and expansion. The data flows both ways. What you learn from churned accounts should tighten your ICP, reshape onboarding, and inform which accounts get proactive data enrichment and outreach.
Practically, the loop runs like this:
- Churn → Marketing: which channels and segments produce customers who never stick. Defund the leaky channels.
- Churn → Onboarding: which activation milestones separate survivors from quitters. Make those milestones the onboarding goal.
- Churn → Sales: which deal characteristics (single-threaded, discount-heavy, off-ICP) predict cancellation. Adjust qualification.
- Churn → Product: which missing capabilities show up repeatedly in exit interviews. Re-rank the roadmap.
Each arrow only works if the underlying customer records are trustworthy. A churn analysis built on a clean, enriched account base improves your response rate on win-back campaigns and your accuracy on risk scoring at the same time. The teams that win here treat their customer data as a living asset, not a one-time import.
What tools do you need for churn analysis?#
You can start with a spreadsheet and a billing export. To operationalize it, most teams assemble four layers:
- Billing/subscription data — Stripe, Chargebee, or your billing system, for the revenue truth.
- Product analytics — Amplitude, Mixpanel, or PostHog, for engagement signals.
- CRM + customer success platform — to store health scores and trigger plays. Compare options on a marketplace like G2 or Gartner's reviews before committing.
- Data enrichment + contact discovery — to keep account and stakeholder records current, which is what makes the other three layers trustworthy. (HubSpot's own research on retention economics is a useful primer on why this matters.)
You do not need to buy a dedicated "churn platform" on day one. You need clean data, three honest metrics, and a weekly habit of working the at-risk list. The tooling should serve that habit, not replace it.
Churn analysis: a quick worked example#
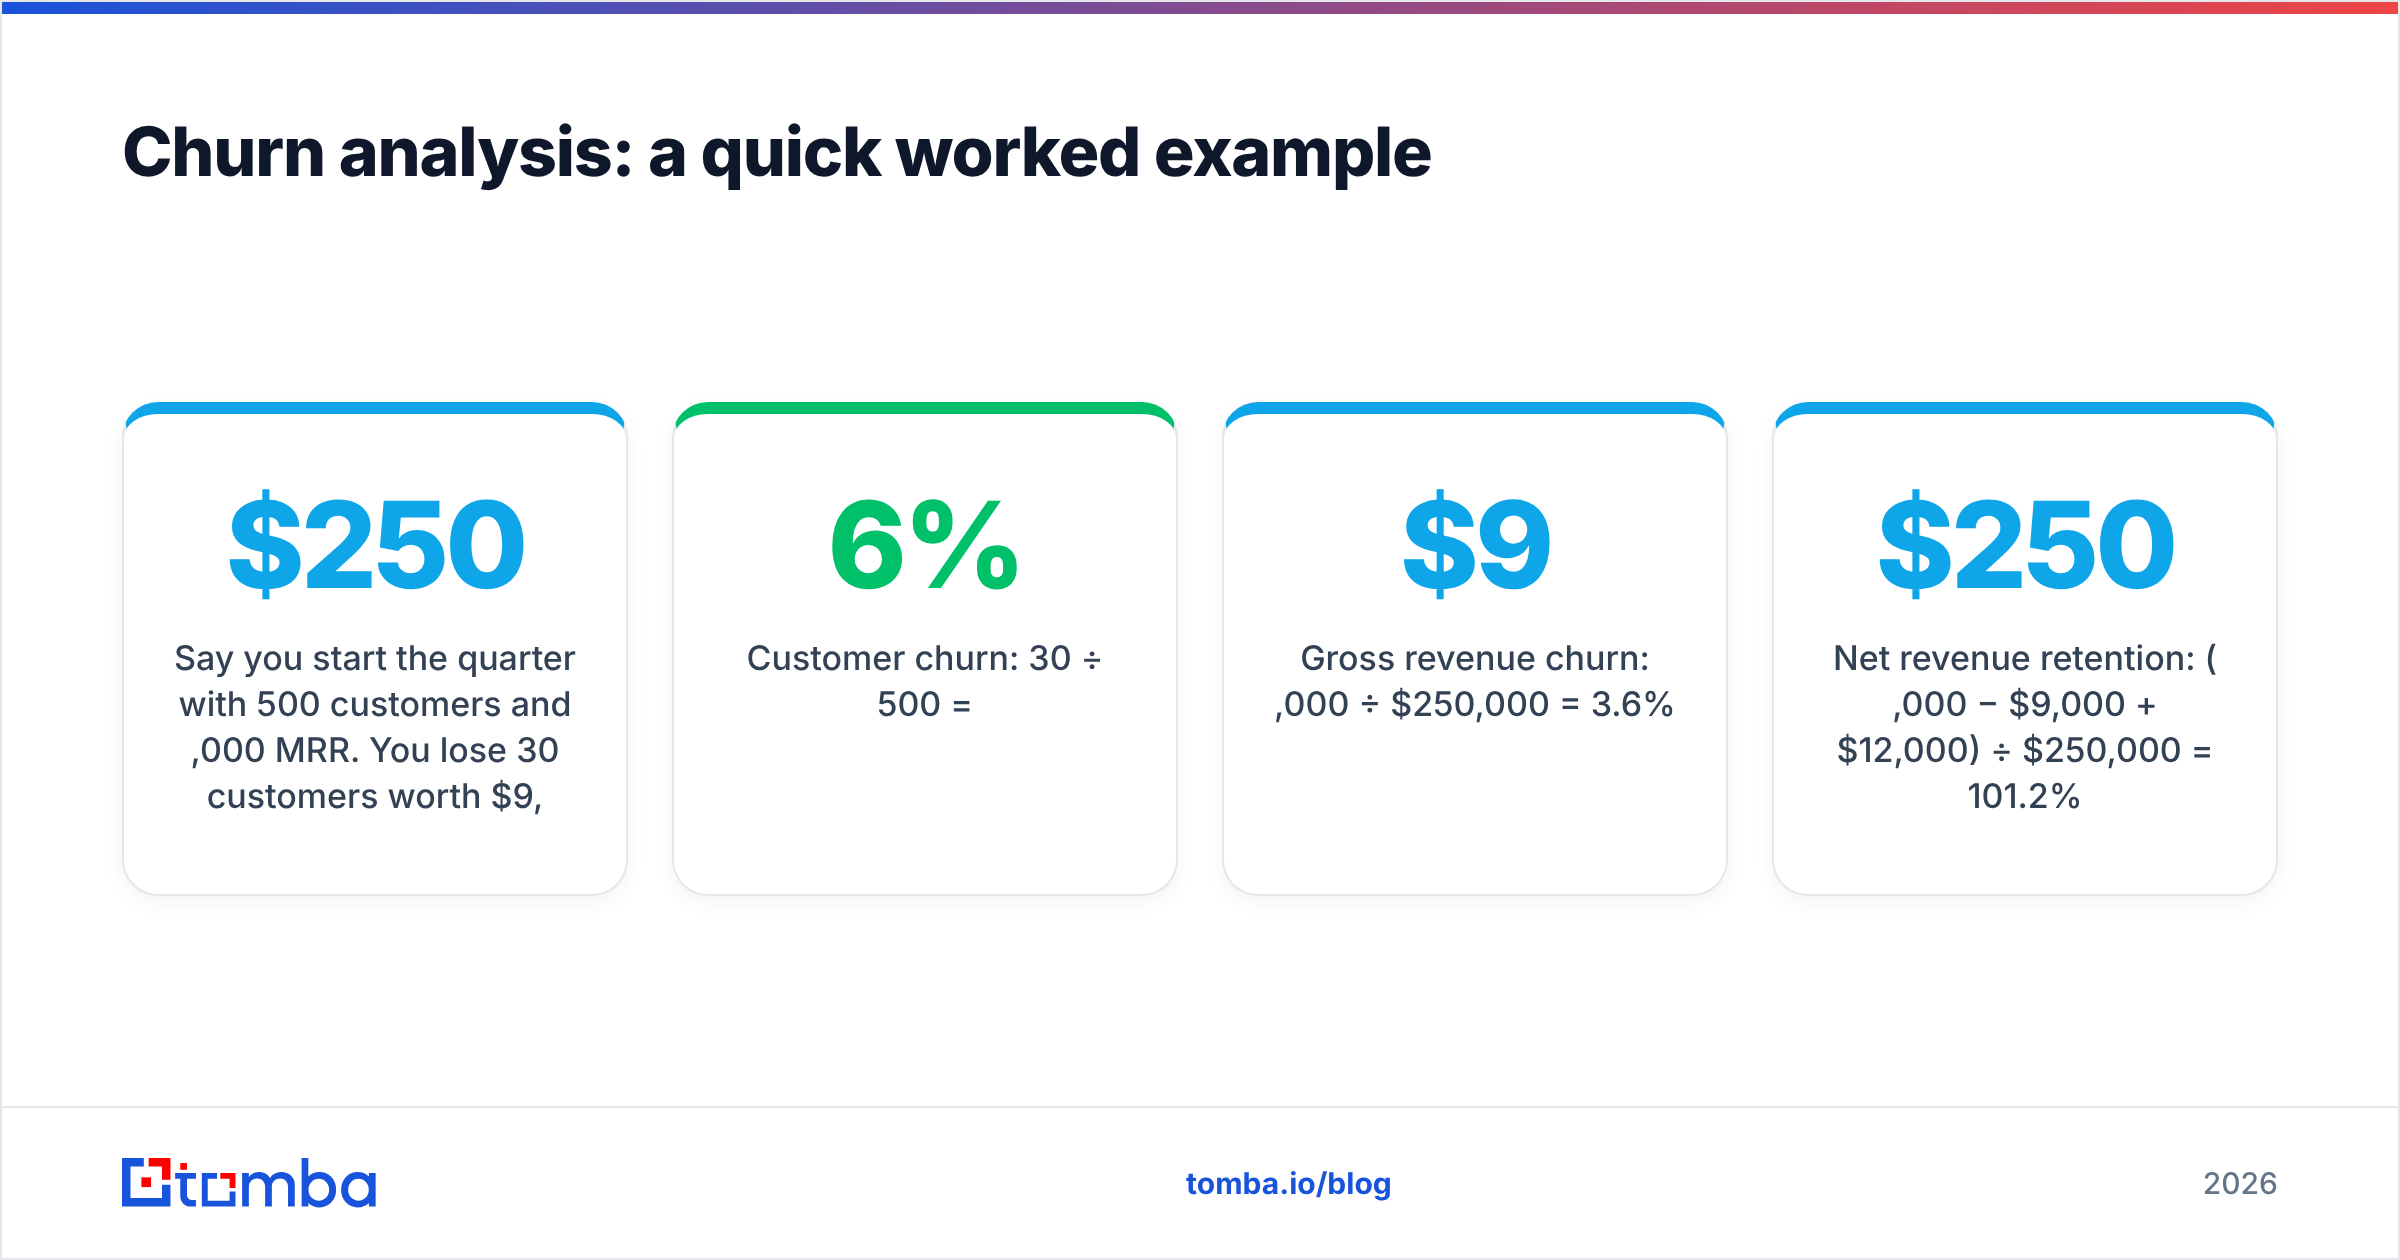
Say you start the quarter with 500 customers and $250,000 MRR. You lose 30 customers worth $9,000 in MRR, but expansion adds $12,000.
- Customer churn: 30 ÷ 500 = 6%
- Gross revenue churn: $9,000 ÷ $250,000 = 3.6%
- Net revenue retention: ($250,000 − $9,000 + $12,000) ÷ $250,000 = 101.2%
Three numbers, three stories. NRR over 100% looks healthy. But 6% logo churn in a single quarter is a warning, and the fact that revenue churn (3.6%) is lower than customer churn (6%) tells you your small accounts are leaving — a classic SMB-fit or onboarding problem. That single comparison points your investigation at exactly one cohort. That's the whole value of churn analysis: it turns a vague worry into a specific, ownable action.
Frequently asked questions#
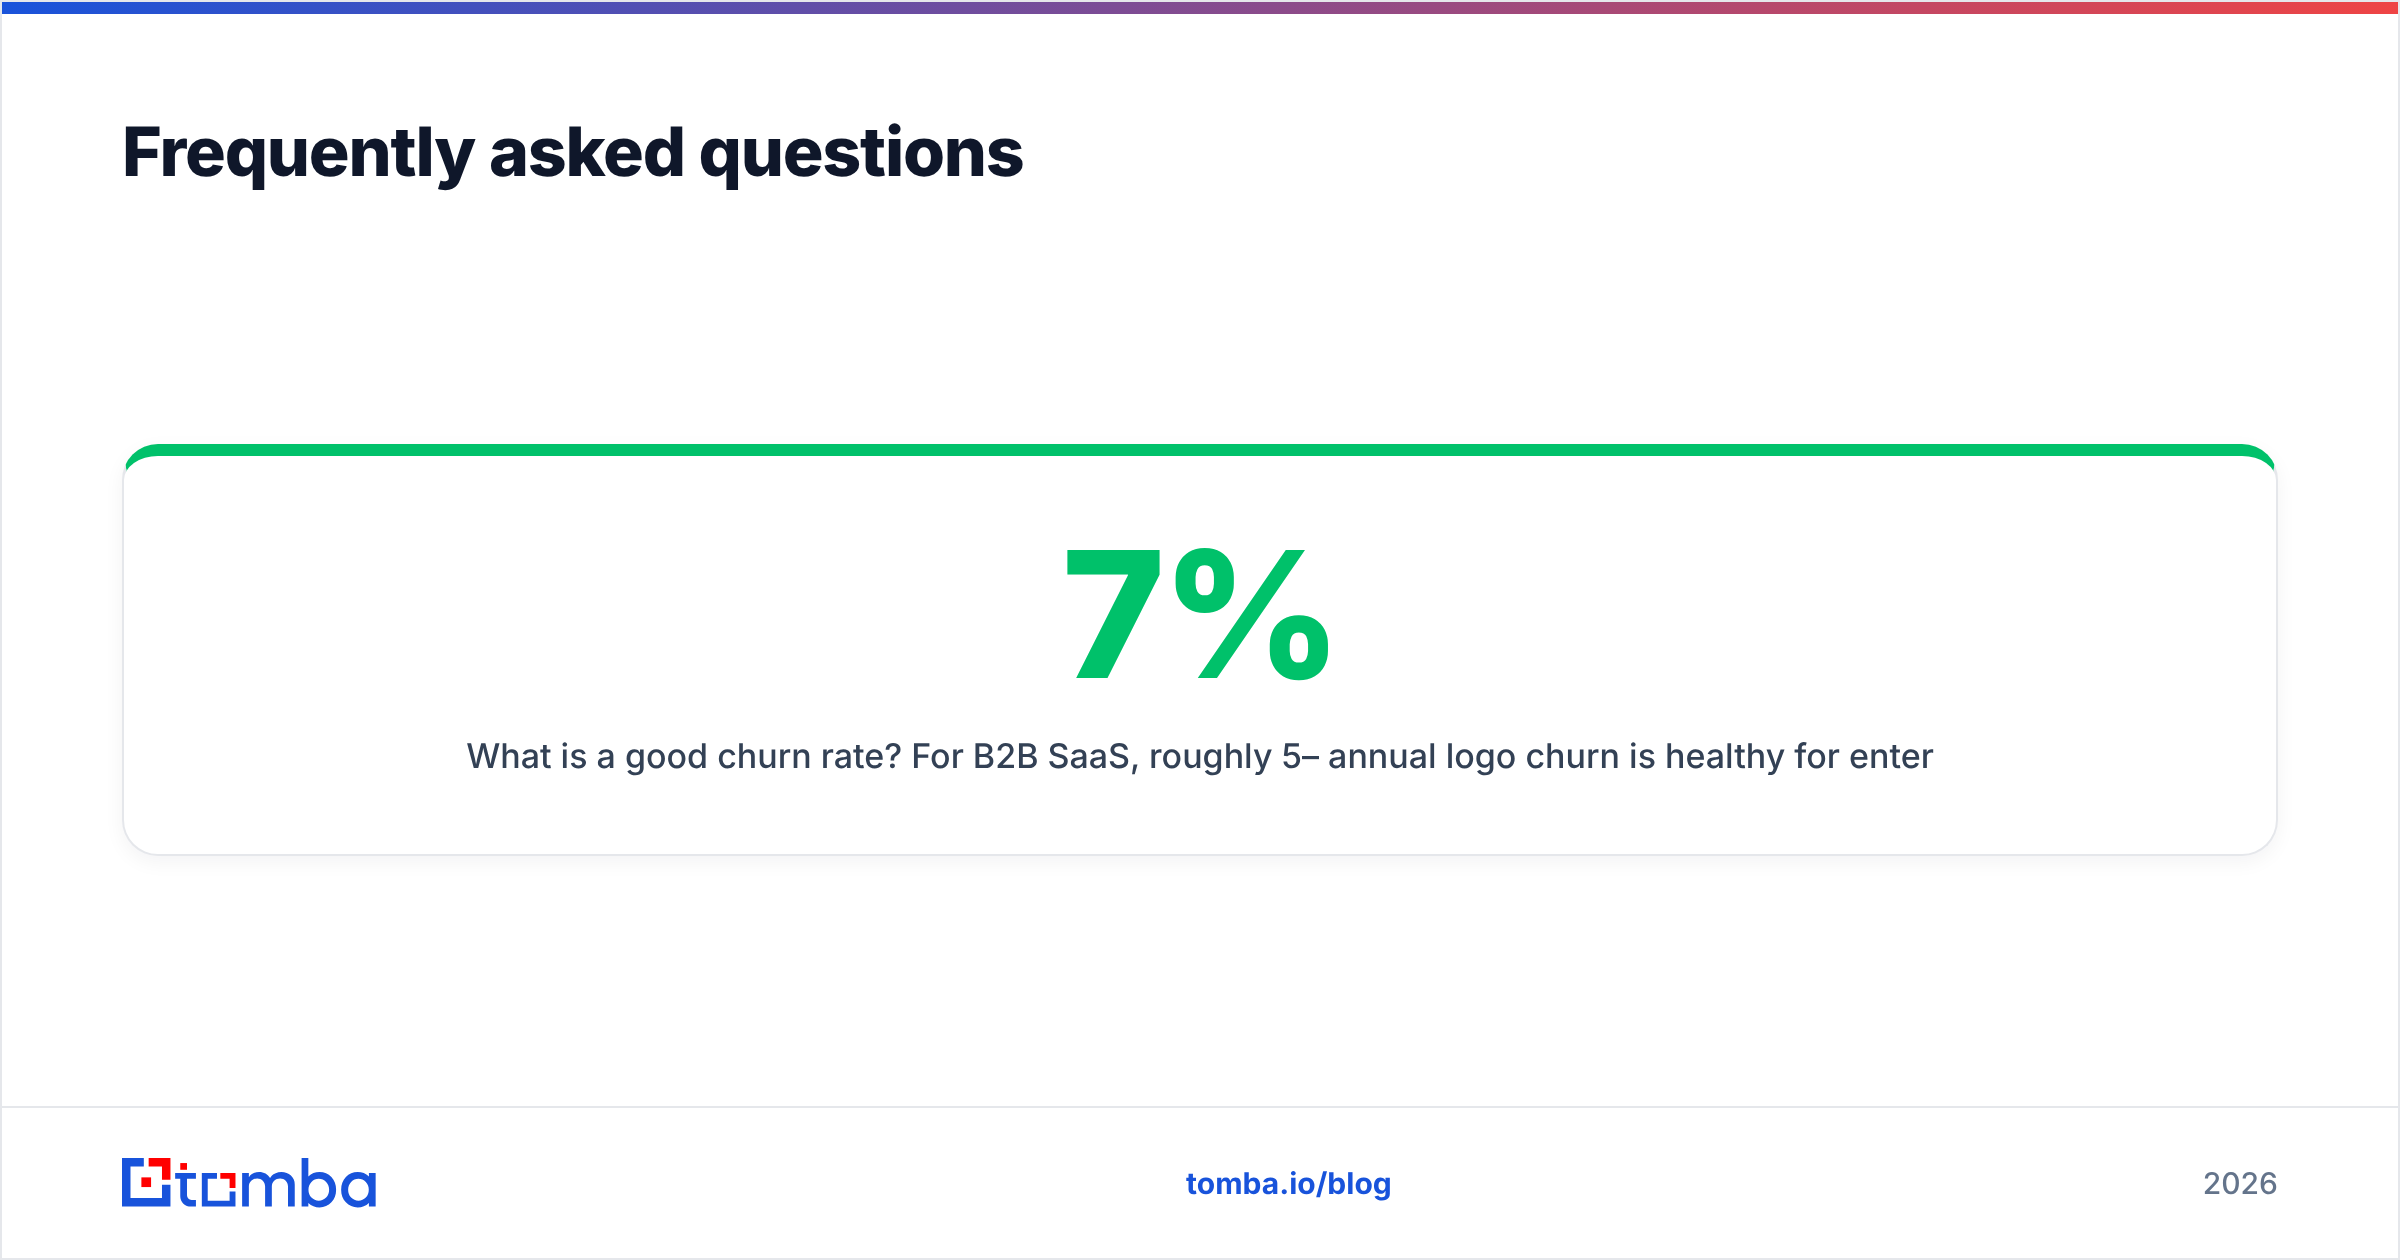
What is a good churn rate? For B2B SaaS, roughly 5–7% annual logo churn is healthy for enterprise; SMB-heavy businesses run higher. On revenue, aim for under 1% monthly gross churn and 100%+ net revenue retention. Benchmarks vary by segment — measure your own trend before chasing an external number.
How often should I run churn analysis? Measure monthly, do a deep cohort/root-cause analysis quarterly, and work your at-risk list weekly. Forrester and other analysts consistently find that proactive, frequent review beats reactive year-end post-mortems.
Is customer churn or revenue churn more important? Both. Revenue churn protects the P&L; customer churn protects future expansion potential and signals product-market fit. Reporting one without the other hides problems.
Can churn analysis work without a data team? Yes, to start. A spreadsheet, your billing export, and disciplined segmentation get you most of the way. You graduate to predictive models once the basics are a habit and your data is clean.
Turn churn analysis into retention revenue#
Churn analysis is only as good as the account data underneath it — stale contacts and missing stakeholders quietly wreck every risk score and every win-back campaign. When a champion leaves or an account changes shape, you need accurate, current contact details fast.
That's where Tomba's Email Finder fits your retention motion: find and verify the new decision-maker the moment a champion departs, re-engage at-risk accounts before the renewal date, and keep your CRM records fresh enough that your churn model actually predicts churn. Start free with 25 searches a month, and check the full Tomba pricing when you're ready to scale your retention data across the whole book. Clean data is the cheapest churn insurance you'll ever buy.
// get started
Find, verify and enrich your first contacts today
Start on the free plan with 25 searches a month, then scale when your team is ready.
Free plan · No credit card required · GDPR & CCPA
// about the author