Churn Rate by Industry: 2026 Benchmarks & How to Lower It
What counts as a healthy churn rate depends entirely on your industry. See 2026 benchmarks for SaaS, ecommerce, telecom, and more — plus how to calculate and cut yours.
TL;DR
- "Good" churn is relative — a 5% monthly rate is a crisis for enterprise SaaS but unremarkable for consumer subscription apps. You can only judge your number against your industry.
- 2026 benchmarks: B2B SaaS sits around 3–5% annual logo churn for healthy companies, ecommerce subscriptions run 6–10% monthly, and telecom hovers near 1–2% monthly.
- Churn rate by industry is shaped by contract length, switching costs, and how essential the product is — not by how "good" your team is.
- Revenue churn and customer (logo) churn tell different stories; track both, and watch net revenue retention as the real health signal.
- Most churn is a data and targeting problem long before it's a product problem — you keep the customers you should have acquired in the first place.
What is churn rate, and why does industry matter?#
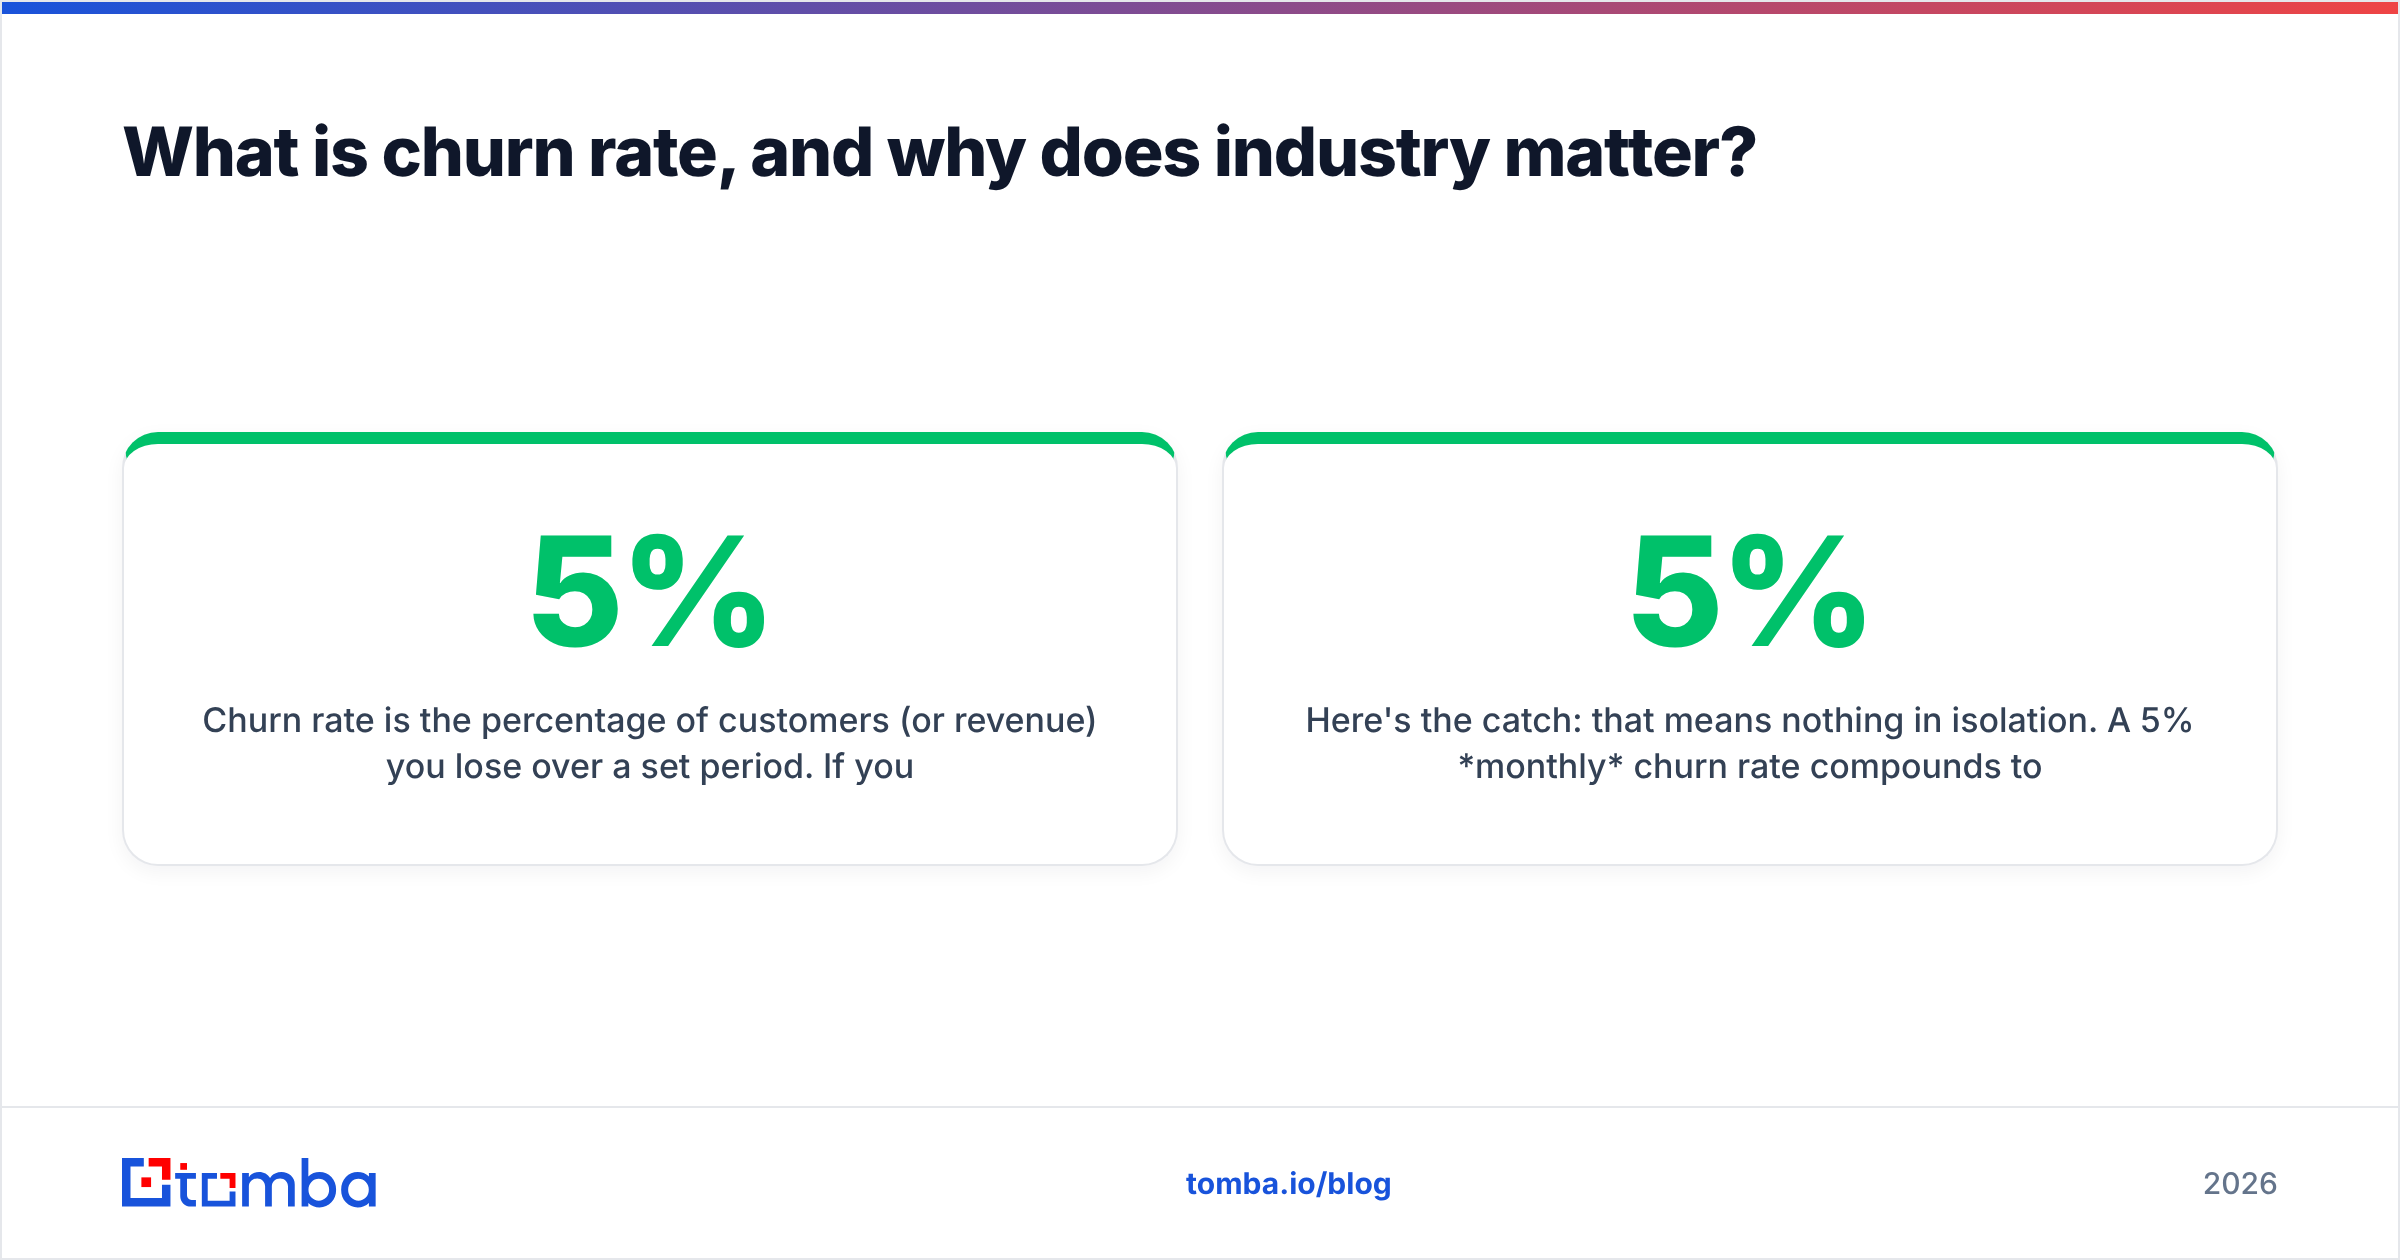
Churn rate is the percentage of customers (or revenue) you lose over a set period. If you start a month with 1,000 customers and 50 cancel, your monthly customer churn is 5%.
Here's the catch: that 5% means nothing in isolation. A 5% monthly churn rate compounds to roughly 46% lost over a year — fatal for a B2B SaaS company, but routine for a mobile gaming subscription where users dip in and out. Comparing yourself to the wrong benchmark leads to the wrong decisions: either panic over a normal number, or complacency over a dangerous one.
Industry sets the baseline because three structural forces vary wildly across sectors:
- Contract length — annual contracts mechanically lower monthly churn versus month-to-month billing.
- Switching costs — ripping out an ERP is painful; cancelling a meal-kit box is one click.
- Essentiality — utilities and banking are sticky because leaving is a hassle; entertainment apps compete with "just cancel it."
Think of churn like a leaky bucket. Industry decides the size of the holes you were born with. Your job is to plug the ones you can control, not to compare your bucket to one built for a different liquid.
)
How do you calculate churn rate correctly?#
Two formulas, two different truths. Track both.
Customer (logo) churn rate
Customer churn = (Customers lost in period ÷ Customers at start of period) × 100Revenue churn rate (gross MRR churn)
Revenue churn = (MRR lost in period ÷ MRR at start of period) × 100The gap between them is the story. If logo churn is high but revenue churn is low, you're losing small accounts and keeping big ones — often fine. If revenue churn outpaces logo churn, your whales are leaving, which is an emergency.
The metric that matters most in 2026 is net revenue retention (NRR), which folds in expansion revenue:
NRR = ((Starting MRR + Expansion − Contraction − Churn) ÷ Starting MRR) × 100An NRR above 100% means your existing base grows even if you never add a new logo. Best-in-class SaaS targets 110–130%. For a deeper look at how retention ties into pipeline math, see how teams structure revenue operations around these signals.
What is the average churn rate by industry in 2026?#
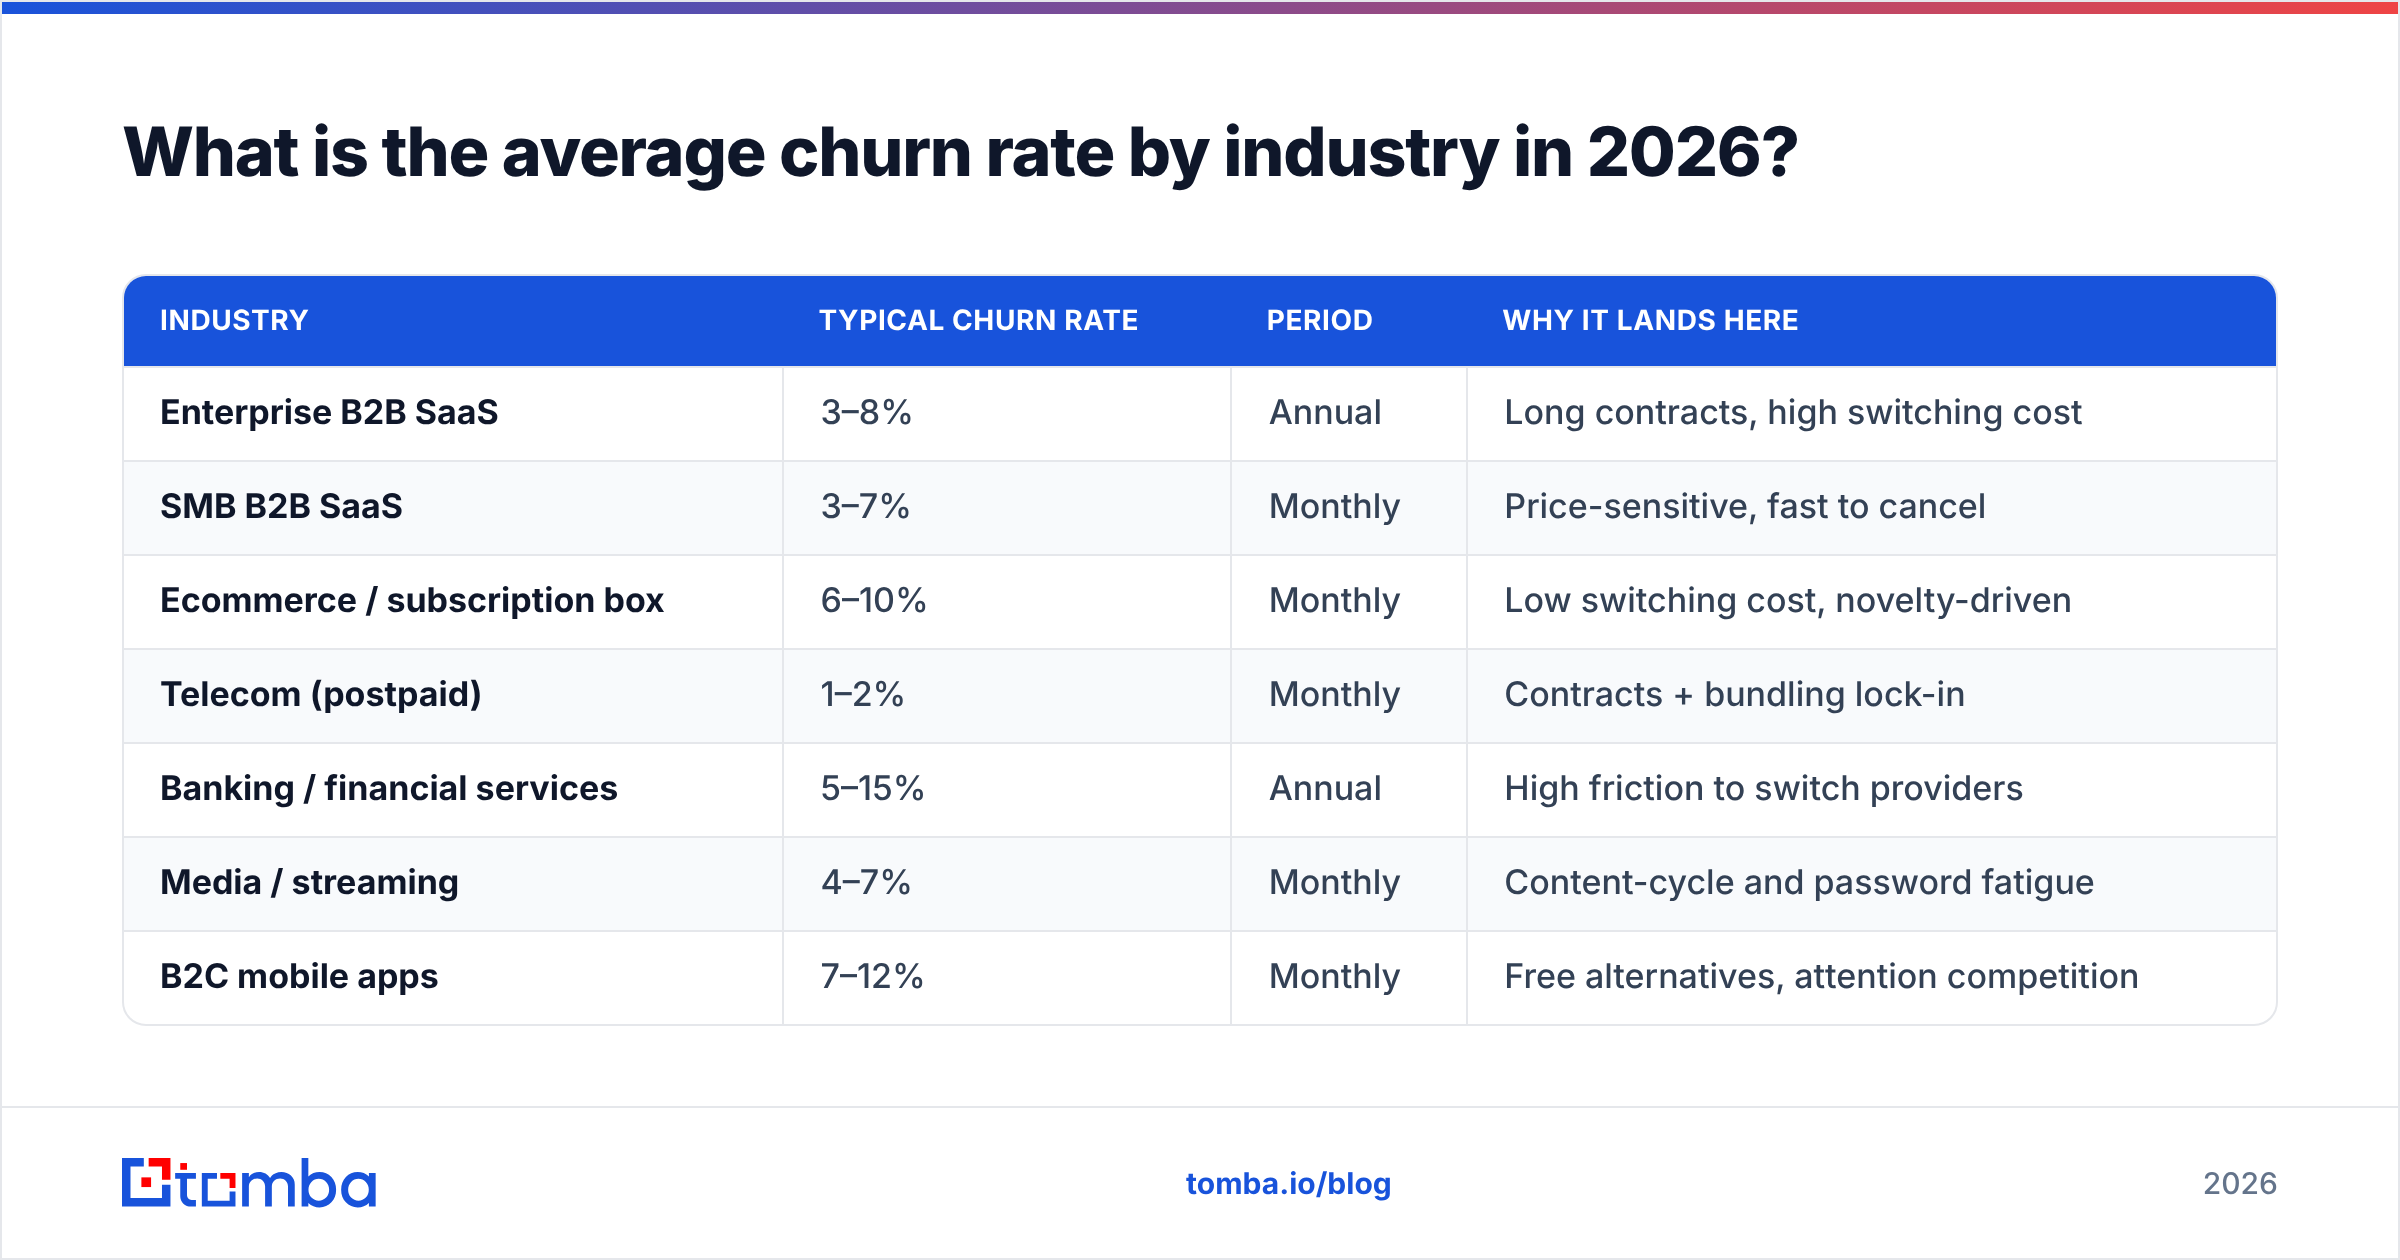
Below are representative 2026 benchmarks. Treat them as ranges, not targets — your sub-segment (SMB vs. enterprise, prepaid vs. contract) shifts the numbers significantly.
| Industry | Typical churn rate | Period | Why it lands here |
|---|---|---|---|
| Enterprise B2B SaaS | 3–8% | Annual | Long contracts, high switching cost |
| SMB B2B SaaS | 3–7% | Monthly | Price-sensitive, fast to cancel |
| Ecommerce / subscription box | 6–10% | Monthly | Low switching cost, novelty-driven |
| Telecom (postpaid) | 1–2% | Monthly | Contracts + bundling lock-in |
| Banking / financial services | 5–15% | Annual | High friction to switch providers |
| Media / streaming | 4–7% | Monthly | Content-cycle and password fatigue |
| B2C mobile apps | 7–12% | Monthly | Free alternatives, attention competition |
| Insurance | 10–15% | Annual | Annual renewal decision points |
Two patterns jump out. First, B2B beats B2C on retention almost everywhere, because business buyers commit to contracts and embed your product in workflows. Second, monthly-billed consumer products carry the highest churn — they live or die on continuous, visible value.
If your number sits inside the band for your industry, you're normal. If you're above it, the rest of this post is for you.
Which industries have the highest and lowest churn?#
Highest churn: consumer subscriptions (apps, boxes, streaming) and discretionary services. When the product is a "nice to have" billed monthly, every renewal is a fresh decision the customer can decline. Insurance and consumer finance also churn hard at annual renewal points, when buyers shop around.
Lowest churn: telecom, utilities, and deeply embedded B2B infrastructure. These benefit from contracts, bundling, and genuine pain-to-leave. A company running its billing on your platform isn't migrating over a price bump.
The lesson isn't "go become a telecom." It's that you can borrow tactics from sticky industries: longer commitment terms, bundling complementary value, and raising switching costs through integrations and data lock-in (the good kind — where leaving means losing accumulated value the customer wants to keep).
How do you know if your churn rate is good or bad?#
Run this four-step check before you react to any churn number:
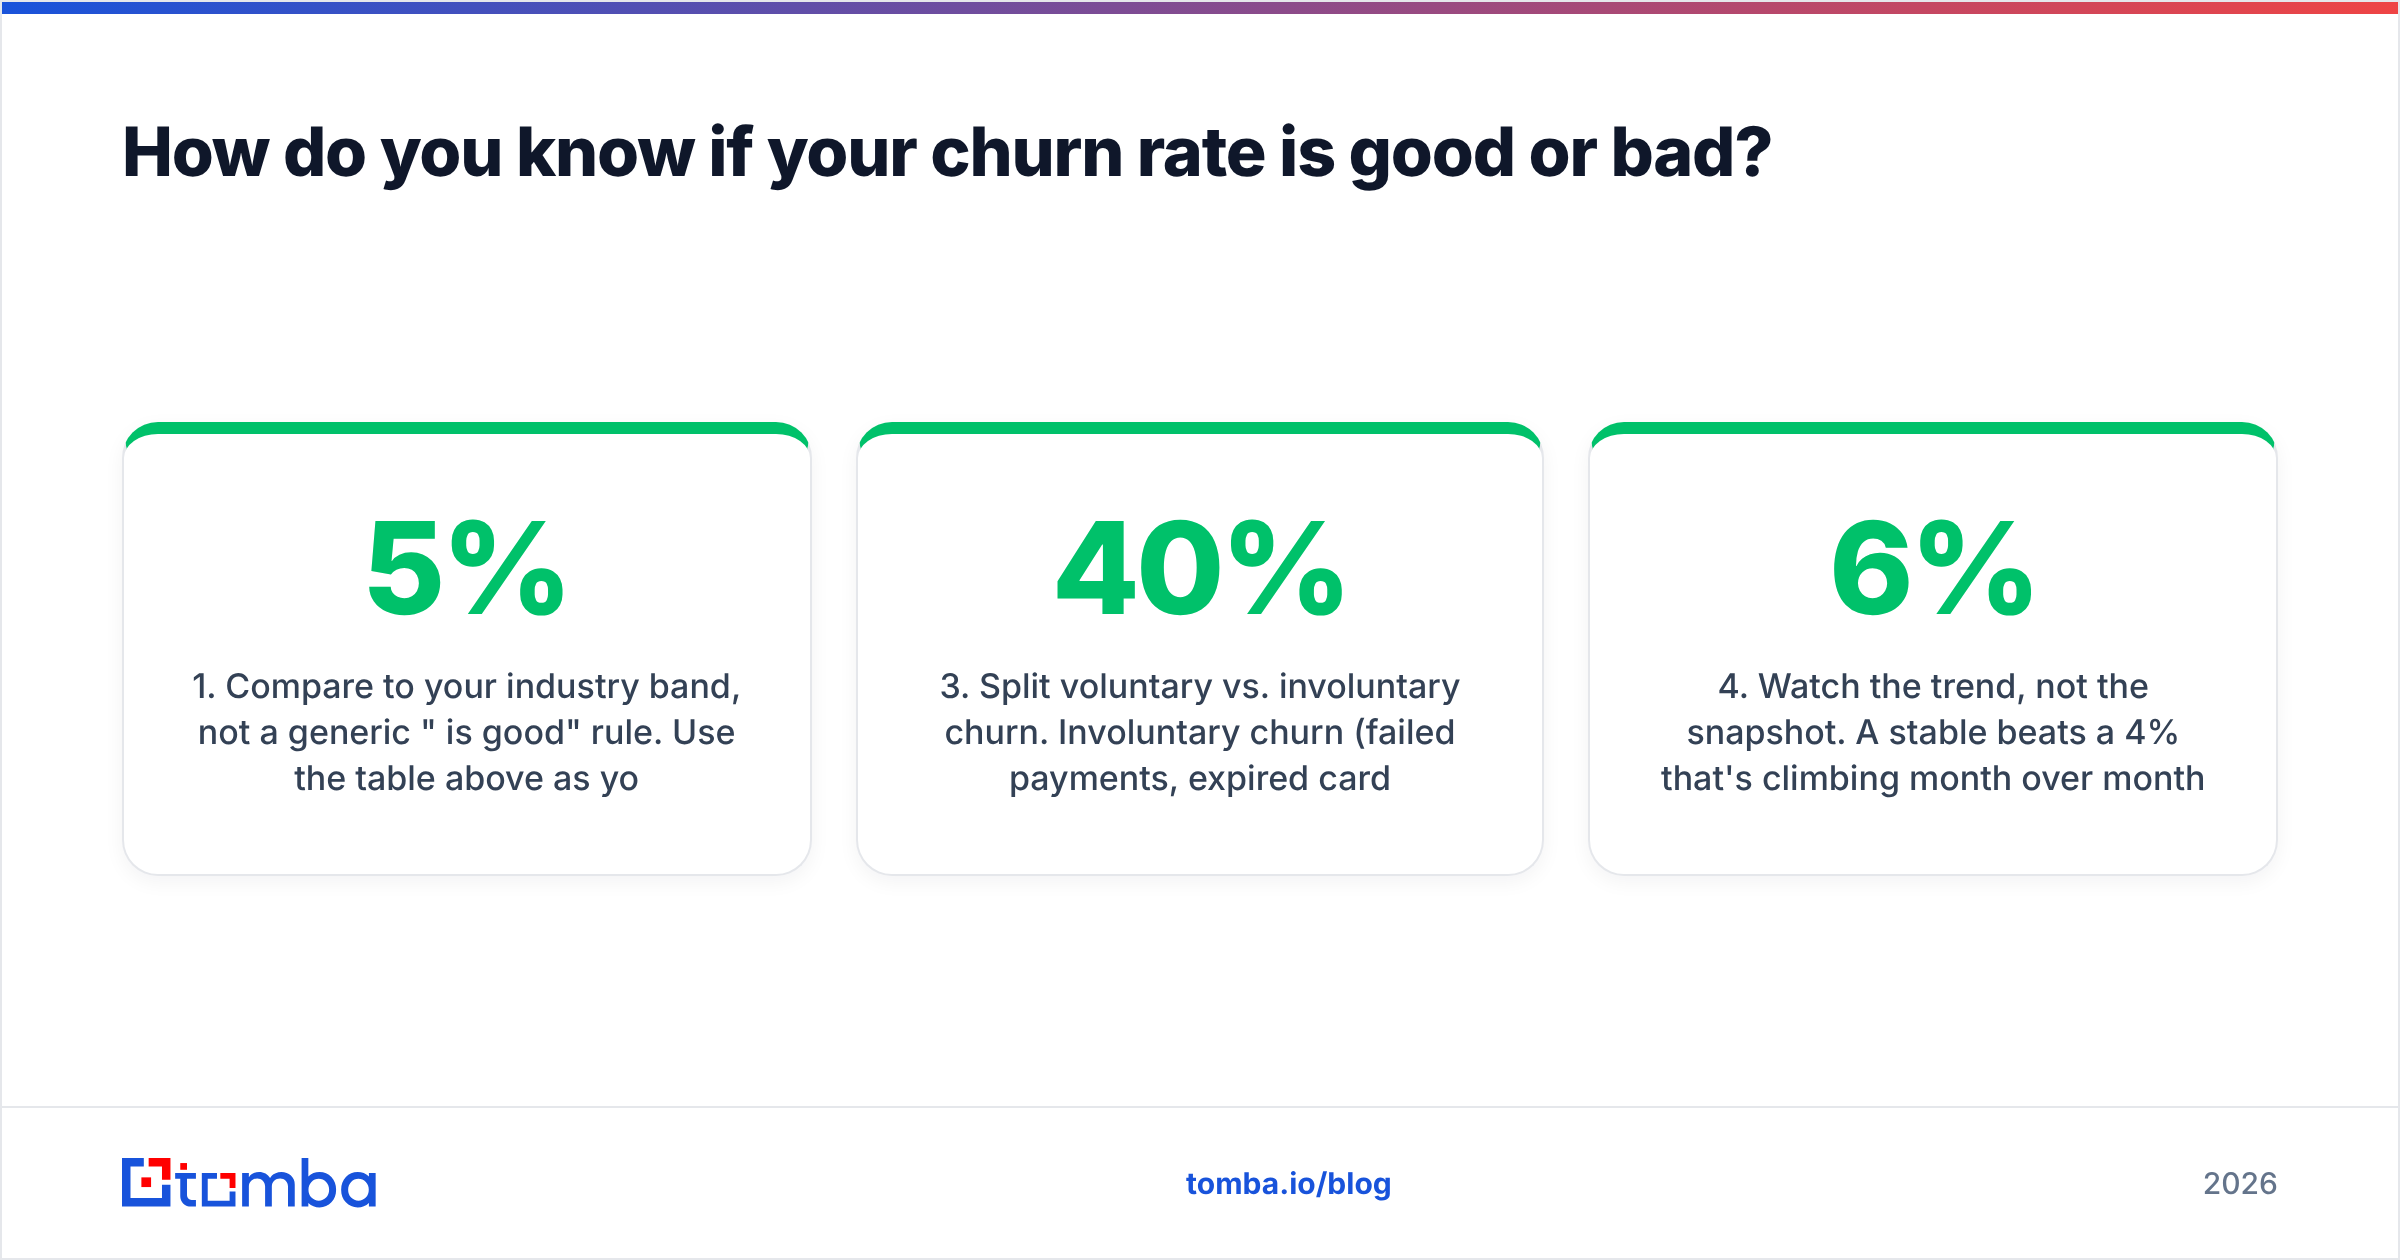
- Compare to your industry band, not a generic "5% is good" rule. Use the table above as your starting reference.
- Segment by cohort. Blended churn hides everything. New-customer churn in months 1–3 is an onboarding problem; churn after year two is a value-delivery problem.
- Split voluntary vs. involuntary churn. Involuntary churn (failed payments, expired cards) can be 20–40% of total churn and is fixable with dunning and card-updater tools — no product changes required.
- Watch the trend, not the snapshot. A stable 6% beats a 4% that's climbing month over month.
For broader context on retention benchmarks across SaaS, the HubSpot research library and analyst coverage from Gartner are useful neutral references, and peer reviews on G2 reveal why customers in your category actually leave.
)
Why is most churn actually a data and targeting problem?#
The uncomfortable truth: a large share of churn is decided before the sale closes. You churn the customers you should never have acquired.
When sales chases poorly-qualified leads — wrong company size, wrong use case, bought on a discount they'll resent at renewal — those accounts churn no matter how good your product is. The fix starts upstream, at the point where you build your prospect list and decide who to pursue.
This is where clean, accurate contact and company data pays for itself twice: once in acquisition efficiency, and again in retention. When your targeting hits the right ideal-customer-profile accounts, those customers stick. A few concrete levers:
- Enrich before you reach out. Knowing firmographics, tech stack, and role before the first email keeps you from selling to bad-fit accounts. Tools like data enrichment append the context your reps need to disqualify early.
- Verify contact data so onboarding emails, renewal notices, and check-ins actually land — undeliverable lifecycle emails quietly inflate churn.
- Score and route by fit, not just engagement, so your best accounts get the attention that prevents churn.
Retention and acquisition aren't separate departments fighting over budget. They're the same leaky bucket. Better data narrows the holes at both ends.
What are the most effective ways to reduce churn?#
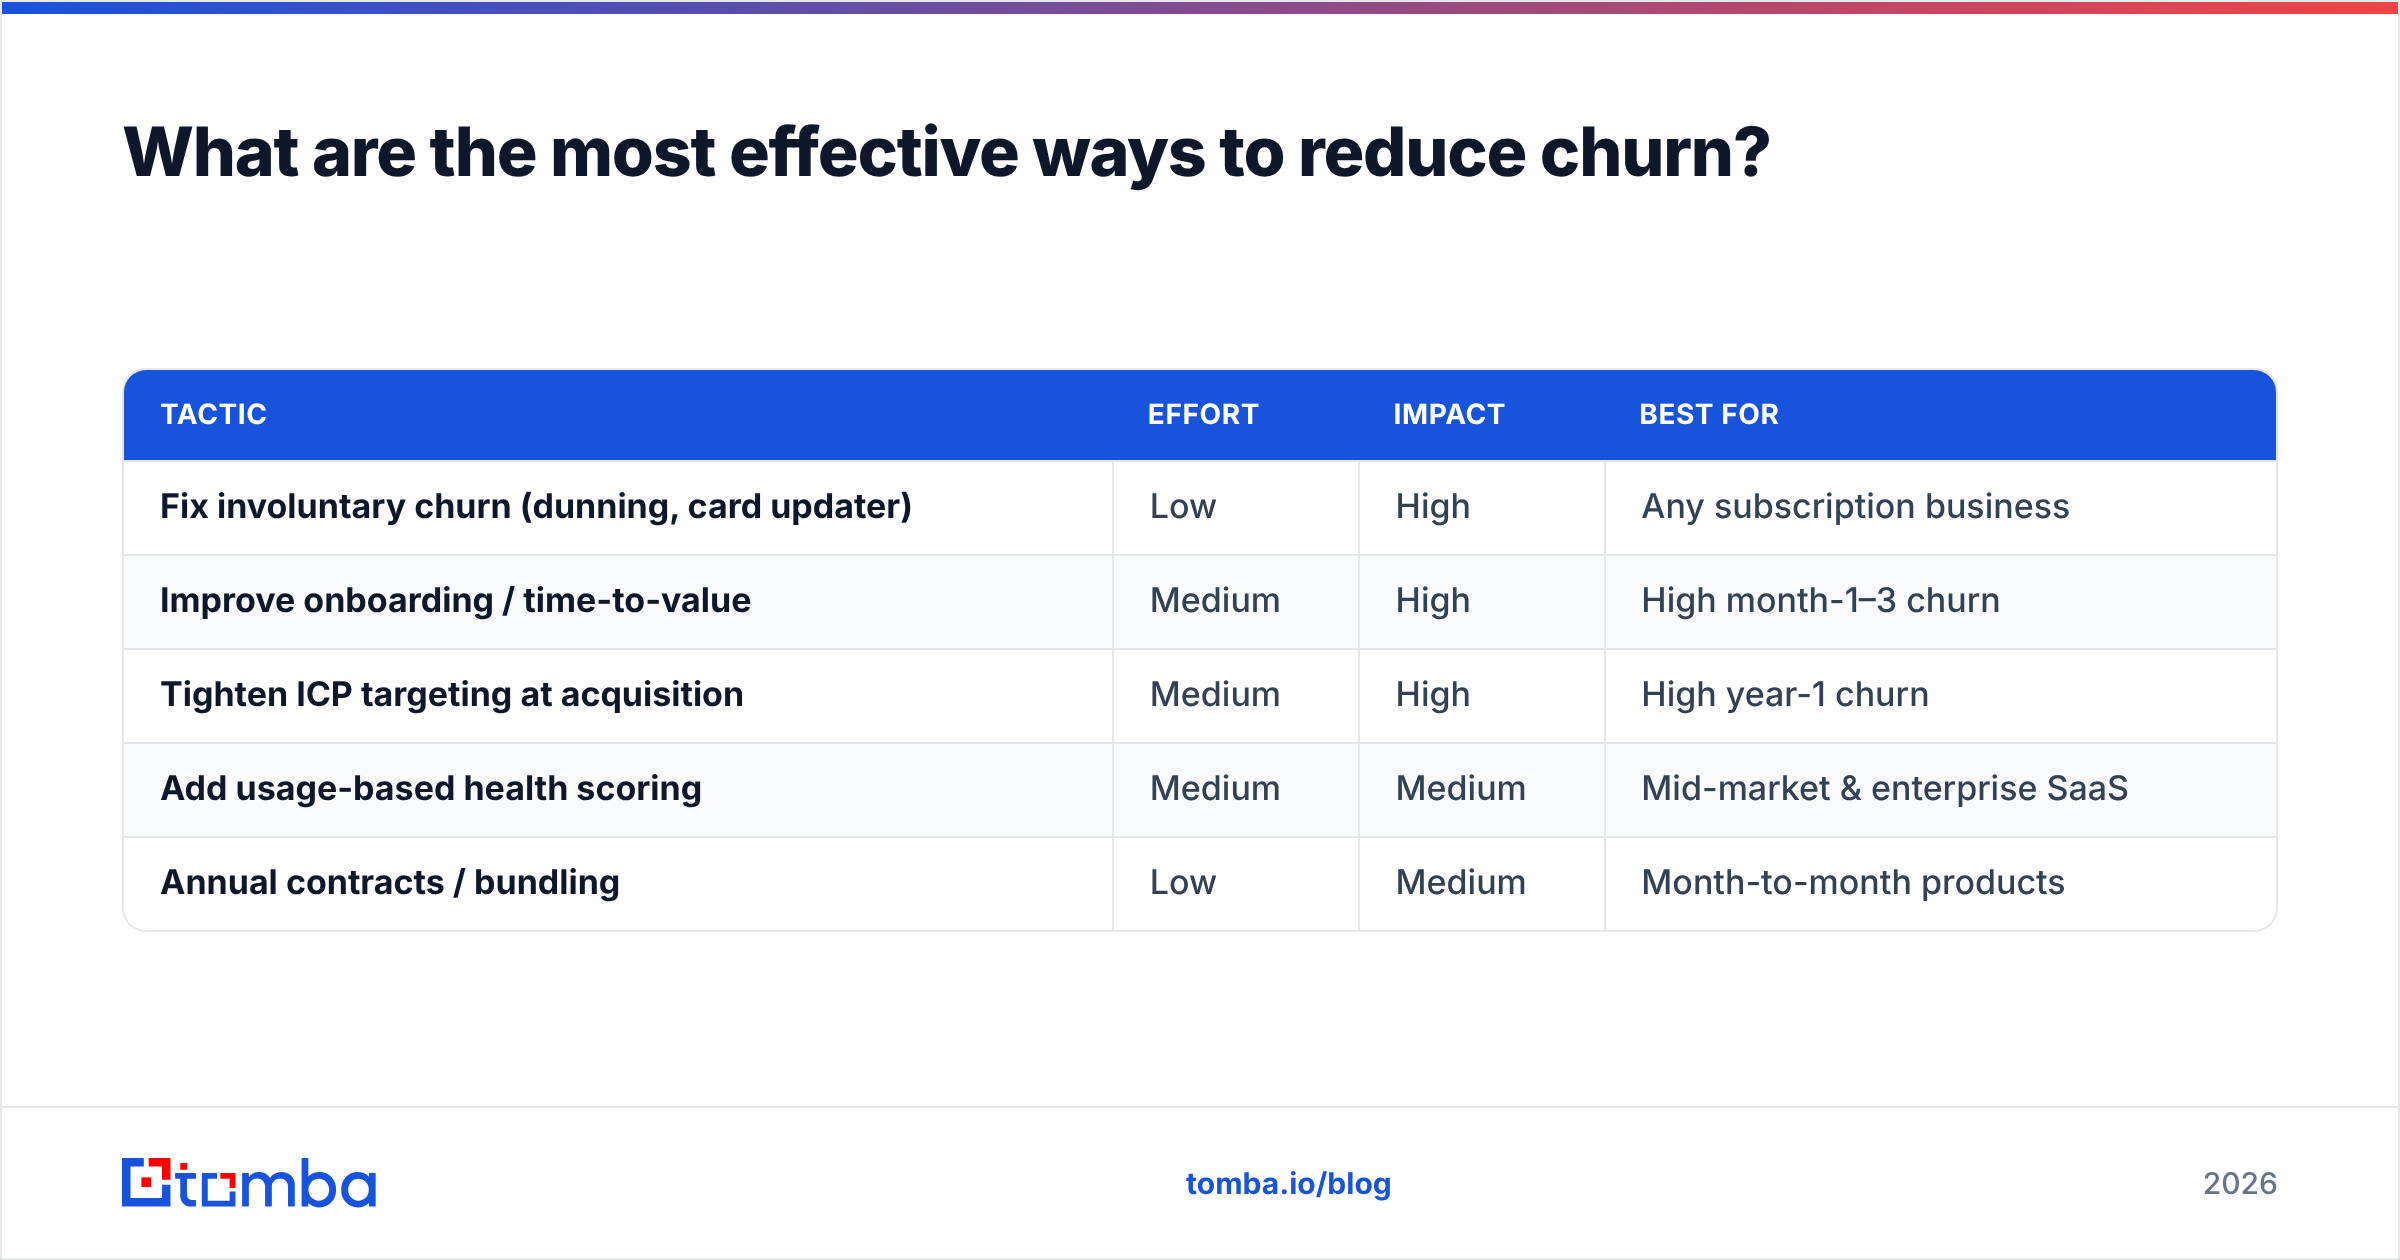
There's no single fix, but the highest-ROI moves cluster into five categories. Here's how they compare on effort and impact:
| Tactic | Effort | Impact | Best for |
|---|---|---|---|
| Fix involuntary churn (dunning, card updater) | Low | High | Any subscription business |
| Improve onboarding / time-to-value | Medium | High | High month-1–3 churn |
| Tighten ICP targeting at acquisition | Medium | High | High year-1 churn |
| Add usage-based health scoring | Medium | Medium | Mid-market & enterprise SaaS |
| Annual contracts / bundling | Low | Medium | Month-to-month products |
A few principles tie these together:
Start with involuntary churn. It's the cheapest win in retention. Recovering even half of failed-payment churn often moves your net number more than a quarter of product work.
Make time-to-value brutally fast. Customers churn early when they never reach the "aha" moment. Map the shortest path to first value and remove every step that isn't on it.
Treat onboarding emails as deliverability-critical. Welcome flows, setup nudges, and renewal reminders only work if they reach the inbox. Bad addresses and spam folders silently break the retention engine you built.
Build a health score from real usage signals — logins, feature adoption, support tickets — and trigger human outreach before the customer mentally checks out. By the time someone clicks "cancel," you're usually too late.
Reward commitment. Annual plans, multi-year discounts, and bundles raise switching costs honestly. A customer who's prepaid a year has eleven months to fall in love with the product.
How does churn connect to acquisition data quality?#
Retention compounds, and so does its opposite. Every bad-fit account you acquire doesn't just churn — it consumes onboarding hours, generates support load, and skews your roadmap toward edge cases that don't matter to your core market.
The teams with the best churn rates in their industry almost always have one thing in common: disciplined, data-driven acquisition. They know exactly who their best customers are, they find more accounts that look like them, and they reach the right decision-maker with accurate contact data on the first try. That precision is built on tooling — a reliable email finder, verification, and enrichment working together so reps spend time on accounts that will renew, not on lists that will bounce.
In other words: you can't out-retain a bad acquisition strategy. The cheapest churn to prevent is the churn you never sign up for.
The bottom line on churn rate by industry#
Benchmark against your sector, segment your cohorts, separate voluntary from involuntary churn, and fix the upstream targeting problems that manufacture churn before a contract is even signed. The number that matters isn't whether you hit a generic "5% is healthy" rule — it's whether you're inside your industry band and trending the right way.
And remember that retention starts at acquisition. If you're filling the top of the funnel with the wrong accounts, no amount of customer-success heroics will save your churn rate.
Want to lower churn by acquiring better-fit customers from day one? Start with accurate targeting. The Tomba Email Finder helps you reach the right decision-makers at your best-fit accounts with verified, accurate contact data — so the customers you sign are the ones who stay. Try it free with 25 searches a month, and check Tomba pricing when you're ready to scale to Starter at $49/mo.
// get started
Find, verify and enrich your first contacts today
Start on the free plan with 25 searches a month, then scale when your team is ready.
Free plan · No credit card required · GDPR & CCPA
// about the author